MALMÖ UNIVERSIT Y HEAL TH AND SOCIET Y DOCT OR AL DISSERT A TION 20 1 3:2 Y AN A Z N AMENS k A Y A MALMÖ UNIVERSIT Y 20 1 3 MALMÖ UNIVERSITY 205 06 MALMÖ, SwEDEN www.MAH.SE
YANA ZNAMENSkAYA
EffECT Of HYDRATION
ON THERMODYNAMIC,
RHEOLOgICAL AND
STRUCTURAL pROpERTIES
Of MUCIN
Isbn 978-91-7104-513-3 (print) Isbn 978-91-7104-514-0 (pdf) Issn 1653-5383 Eff ECT O f HYDR A TION ON THERMOD YN AMIC , RHEOL O g IC AL AND S TRUCTUR AL p R O p ERTIES O f MUCINe f f e c t o f h y d r a t i o n o n t h e r m o d y n a m i c , r h e o l o g i c a l a n d s t r u c t u r a l p r o p e r t i e s o f m u c i n
Malmö University
Health and Society, Doctoral Dissertation 2013:2
© Copyright Yana Znamenskaya, 2013
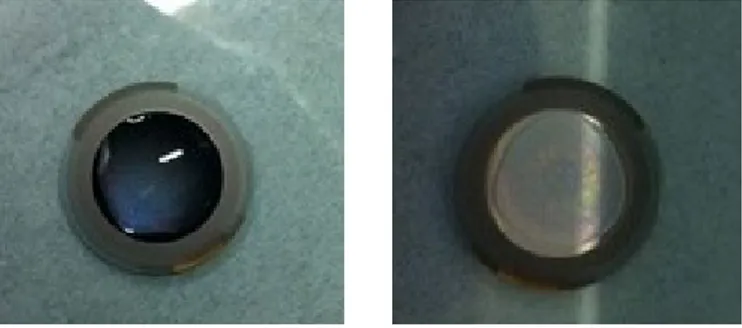
Front illustration: image of dehydrated human unpurified saliva in air obtained using polarized light microscopy
Back illustration: 3D image of PGM dumbbell-like structure obtained using AFM ISBN 978-91-7104-513-3 (print)
ISBN 978-91-7104-514-0 (pdf) ISSN 1653-5383
yana Znamenskaya
effect of hydration on
thermodynamic, rheological
and structural properties
of mucin
Malmö University, 2013
Faculty of Health and Society,
Biomedical Science Department
contents
ABBREVIATIONS AND SYMBOLS ... 9
ABSTRACT ... 11
LIST OF PAPERS ... 13
CHAPTER 1 INTRODUCTION ... 15
Mucous gel and mucins ... 16
Hydration of mucin ... 19
Polyelectrolyte multilayers ... 21
Studied systems ... 23
CHAPTER 2 EXPERIMENTAL TECHNIQUES ... 25
Isothermal sorption calorimetry ... 25
Differential scanning calorimetry ... 27
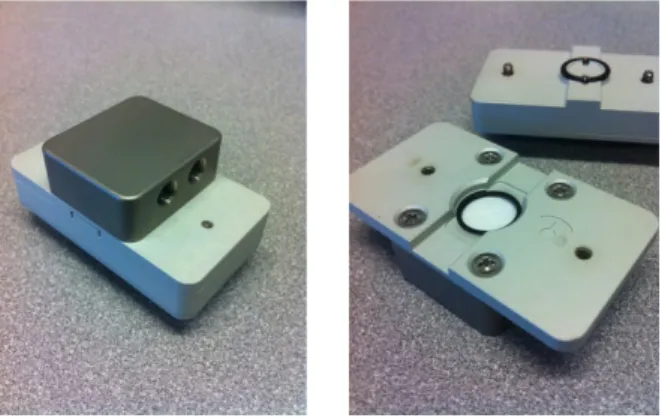
Quartz crystal microbalance with dissipation monitoring ... 28
Small-angle X-ray scattering ... 33
Atomic force microscopy ... 34
CHAPTER 3 RESULTS AND DISCUSSION ... 37
Thermodynamics of water sorption of mucin ... 37
The effect of hydration on mucin rheology ... 43
Structural properties of mucin ... 46
The effect of hydration on BSM/chitosan multilayer film ... 50
CONCLUDING REMARKS AND FUTURE OUTLOOKS ... 55
POPULÄRVETENSKAPLIG SAMMANFATTNING ... 57
ACKNOWLEDGEMENTS ... 59
REFERENCES ... 63
9
abbreviations and symbols
9
ABBREVIATIONS AND SYMBOLS
𝑎𝑎𝑤𝑤 – water activity
AFM – atomic force microscopy
BSM – bovine submaxillary gland mucin ∆𝐶𝐶𝑝𝑝 – the difference in heat capacity
DSC – differential scanning calorimetry
𝐻𝐻𝑤𝑤𝑚𝑚 – partial molar enthalpy of mixing of water (enthalpy of hydration)
PEM – polyelectrolyte mutlilayers PGM – pig gastric mucin
PGMC - mucus collected from pig’s stomach Tg – glass transition temperature
QCM-D - quartz crystal microbalance with dissipation monitoring RH – relative humidity
SANS - small angle neutron scattering SAXS - small-angle X-ray scattering
– water activity
AFM – atomic force microscopy
BSM – bovine submaxillary gland mucin
9
ABBREVIATIONS AND SYMBOLS
𝑎𝑎𝑤𝑤 – water activity
AFM – atomic force microscopy
BSM – bovine submaxillary gland mucin ∆𝐶𝐶𝑝𝑝 – the difference in heat capacity
DSC – differential scanning calorimetry
𝐻𝐻𝑤𝑤𝑚𝑚 – partial molar enthalpy of mixing of water (enthalpy of hydration)
PEM – polyelectrolyte mutlilayers PGM – pig gastric mucin
PGMC - mucus collected from pig’s stomach Tg – glass transition temperature
QCM-D - quartz crystal microbalance with dissipation monitoring RH – relative humidity
SANS - small angle neutron scattering SAXS - small-angle X-ray scattering
– the difference in heat capacity DSC – differential scanning calorimetry
9
ABBREVIATIONS AND SYMBOLS
𝑎𝑎𝑤𝑤 – water activity
AFM – atomic force microscopy
BSM – bovine submaxillary gland mucin ∆𝐶𝐶𝑝𝑝 – the difference in heat capacity
DSC – differential scanning calorimetry
𝐻𝐻𝑤𝑤𝑚𝑚 – partial molar enthalpy of mixing of water (enthalpy of hydration)
PEM – polyelectrolyte mutlilayers PGM – pig gastric mucin
PGMC - mucus collected from pig’s stomach Tg – glass transition temperature
QCM-D - quartz crystal microbalance with dissipation monitoring RH – relative humidity
SANS - small angle neutron scattering SAXS - small-angle X-ray scattering
– partial molar enthalpy of mixing of water (enthalpy of hydration) PEM – polyelectrolyte mutlilayers
PGM – pig gastric mucin
PGMC - mucus collected from pig’s stomach Tg – glass transition temperature
QCM-D - quartz crystal microbalance with dissipation monitoring RH – relative humidity
SANS - small-angle neutron scattering SAXS - small-angle X-ray scattering
11
abstract
Mucus, an adherent hydrated layer covering the epithelium, is found in all internal tracts of the body and plays an important role in animal and human life. One of the essential functions of mucus is protection of tissues against dehydration. A major component of mucus, forming the macromolecular matrix and also being responsible for its viscoelastic properties, is the glycoprotein mucin. Mucin is a complex molecule owing to the high molar mass, its polydispersity and high degree of glycosylation. This thesis is aimed to investigate how thermodynamic, structural and rheological properties of mucin are affected by hydration.
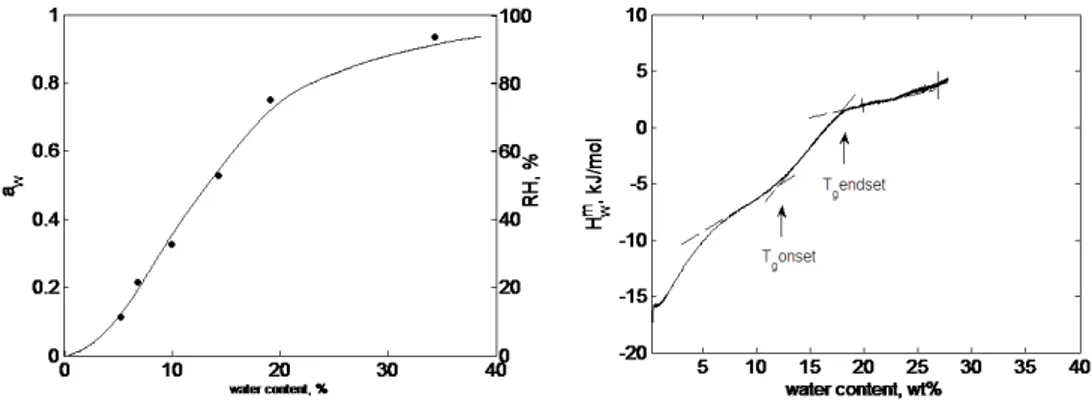
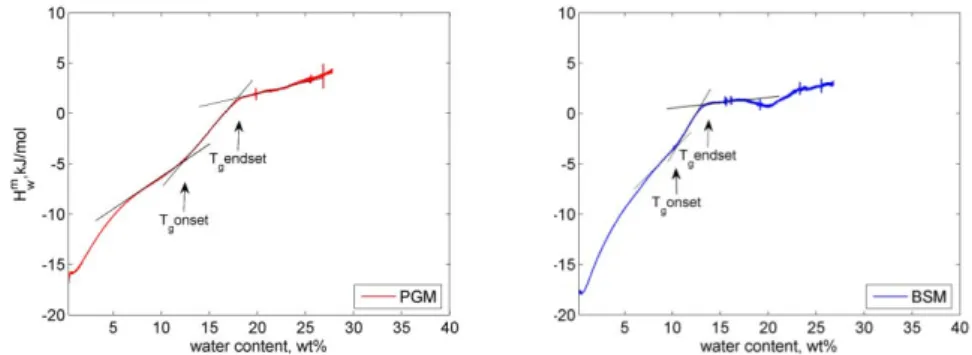
The effect of hydration on thermodynamic properties of pig gastric mucin (PGM) and bovine submaxillary mucin (BSM) has been studied using sorption calorimetry and differential scanning calorimetry (DSC). The analysis of sorption isotherms shows higher water sorption capacity of PGM compared to BSM at relative humidity (RH) levels lower than about 78%. The value of the hydration enthalpy at zero water content at 25ºC for both biopolymers is close to -20 kJ/ mol. RH levels at which glass transition of both mucins occurs are shown to be between 60 and 70%. The RH at which glass transition occurs is weakly dependent on the temperature and mucin type. The phase diagram of PGM demonstrates two different glass transition regions: dependent and independent on hydration levels, respectively. In particular at mucin concentrations from 0 to 67 wt%, the glass transition occurs at a constant temperature of about –15ºC. At higher concentrations of mucin, the glass transition temperature (Tg) increases with increasing mucin concentrations.
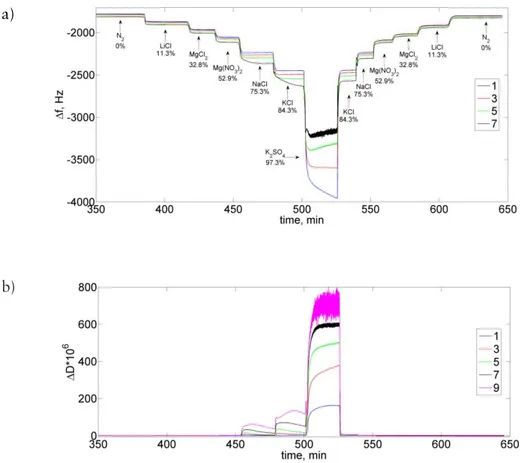
It is also demonstrated that the QCM-D technique can be used to obtain the water sorption isotherms of mucin films in particular and in general to monitor glass transitions in biopolymers. Hydration-induced changes of rheological properties of mucin films are investigated using a model-free approach. The ratio
12
of G’/G’’ is evaluated as a function of relative humidity. Observed transitions from solid-like behaviour to liquid-like behaviour in mucin system occur in the same humidity range as that found in sorption calorimetric experiments.
The structural properties of mucin have been studied using atomic force microscopy (AFM) and small-angle X-ray scattering (SAXS). AFM indicates the presence of dumbbell as well as fiber-like structures in PGM samples. In the case of BSM samples, only fiber-like structures are observed. SAXS studies show three ranges of scattering vector q corresponding to different fractal dimensions in dilute PGM and BSM solutions. Dehydration-induced structural changes in PGM are demonstrated by a distinct appearance of peaks on scattering curves starting from 20 wt% of mucin. Structural changes at about 80 wt% obtained in SAXS at 25°C, correspond to mucin glass transition, and are in agreement with sorption calorimetry and DSC studies. Temperature-induced phase behaviour changes occur around 60-70°C at intermediate levels of hydration.
A comparison between water sorption isotherms of BSM/chitosan multilayers and those of individual biopolymers shows that the water sorption capacity of BSM/chitosan multilayers is similar compared to that of individual biopolymers, although some differences exist. In particular, at low RH levels the water sorption capacity of multilayers is slightly higher compared to each biopolymer, however at high RH the multilayer films are less hydrated than individual biopolymers.
13
list of papers
This thesis is based on the following papers, which are cited in the text by their Roman numerals. The papers are appended in the end of the thesis.
I. Znamenskaya, Y.; Sotres, J.; Engblom, J.; Arnebrant, T.; Kocherbitov, V. Effect of Hydration on Structural and Thermodynamic Properties of Pig Gastric and Bovine Submaxillary Gland Mucins. J. Phys. Chem. B. (2012), 116, 5047–5055.
II. Znamenskaya, Y.; Sotres, J.; Gavryushov, S.; Engblom, J.; Arnebrant, T.; Kocherbitov, V. Water Sorption and Glass Transition of Pig Gastric Mucin Studied by QCM-D. J. Phys. Chem. B. (2013), 117, 2554−2563
III. Znamenskaya, Y.; Sotres, J.; Arnebrant, T.; Kocherbitov, V. Hydration of Bovine Submaxillary Gland Mucin/Chitosan Multilayers Studied by QCM-D. Manuscript
IV. Znamenskaya, Y.; Engblom, J.; Arnebrant, T.; Kocherbitov, V. Effects of Dehydration on Structural Properties and Phase Behaviour of Pig Gastric Mucin Evaluated by SAXS. Manuscript
Paper I: I, JE and VK designed the study. I performed sorption calorimetry and DSC experiments and analyzed the data. JS performed AFM experiments, analyzed AFM data and wrote the AFM part of the paper. I wrote the paper with contributions from JS, JE, TA and VK
Paper II: I, JE and VK designed the study. I performed QCM-D experiments and analyzed the data. JS performed AFM experiments, analyzed AFM data and wrote the AFM part of the paper. SG and VK analyzed QCM-D data with model-free approach and extracted the G’/G’’ ratio. I wrote the paper with contributions from JS, SG, JE, TA and VK.
14
Paper III: I designed the study with input from TA and VK. I performed sorption calorimetry and QCM-D experiments and analyzed the data. JS performed AFM experiments, analyzed AFM data and wrote the AFM part of the manuscript. I wrote the manuscript with contributions from JS, TA and VK.
Paper IV: I, JE and VK designed the study, performed SAXS experiments and analyzed the data. I wrote the manuscript with contributions from JE, TA and VK.
15
chapter 1 introduction
One of the essential functions of the mucous gel is protection of tissues against dehydration (drying). In order to fulfil this function, the mucous gel should be strongly hydrated, i.e. it should contain a large amount of water. The presence of large amounts of water prevents extensive changes of the water activity in the mucous gel when the relative humidity of the surrounding atmosphere changes. Nonetheless, when subjected to dry conditions, mucous gel does dry out. I.e. under 30% RH, the eyes and skin become dry, and under 10% RH the nasal mucous membrane becomes dry. Consequently, dehydration changes the protective properties of the mucous gel and may become a pathogenic factor in many diseases such as cystic fibrosis1-3, asthma1, gastric carcinoma4, rhinorrhea5.
The focus of this thesis is to investigate effects of mucous gel hydration. In particular, we focus on how macroscopic properties of mucus, such as hydrophilicity and elasticity, are affected by different RH levels. In order to achieve this goal, a further understanding of the components properties in mucous gel is required. The glycoprotein mucin is the main component of mucus, and forms the macromolecular matrix responsible for its viscoelastic properties. Hence, we investigate how thermodynamic, structural and rheological features of mucin are affected by hydration.
The main objectives have been:
• To characterise the hydrophilicity of mucin by determining the equilibrium water vapour sorption at constant temperature as a function of the RH • To obtain RH levels at which glass transition of mucin systems occurs and
show the dependence of the glass transition temperature of mucin on water content
16
• To study hydration-induced glass transition behaviour and rheological changes of mucin in thin films
• To indicate temperature and hydration-induced structural changes in mucin systems, using X-ray scattering
To construct BSM/chitosan multilayers and compare the water sorption isotherms of BSM/chitosan multilayers to those of singular biopolymers
The justification for pursuing this work was to increase the appreciation of the fundamental properties of native tissues, especially how the highly hydrated layer covering mucosal surfaces of our body is affected by changes in ambient conditions; understanding hydration fundamentals can be relevant for areas like biomaterial coatings and transmucosal drug delivery. Moreover, the mucin/ chitosan multilayer system is a mimic of extra-cellular matrices, which is interesting to study with respect to interactions with pharmaceutical components. The “Introduction” part of the thesis contains general aspects on the properties of mucous gel and the glycoprotein mucin. Also the layer-by-layer assembly of oppositely charged polymers is explained. In the “Materials and Methods” section, a detailed description of two major experimental techniques, sorption calorimetry and QCM-D is presented, while others are characterized briefly.
The “Results and Discussion” part includes the effect of hydration on the properties of water-mucin system, i.e. Papers I, II, and IV. In Paper III, a study of a more complex system, mucin/chitosan multilayers, is presented, and in particular how the mucin/chitosan system is affected by hydration.
mucous gel (mucus) and mucins
Mucus, an adherent hydrated layer covering the epithelium, is found in all internal tracts of the body and plays an important role in animal and human life1,6. The
properties of mucus are essential for the proper functioning of the digestive, respiratory, and reproductive systems of vertebrates, including humans7,8.
The function of mucous gel differs depending on its origin, but generally it contributes to protection and transportation. For example, in the gastrointestinal tract mucus protects the epithelial cells from digestive enzymes, bile salts, hydrochloric acid and microorganisms9. Mucus is a barrier to pathogens and
noxious substances and is the first barrier nutrients and delivered drugs will interact with and diffuse through10. From an engineering point of view, mucus is
an outstanding water-based lubricant7. However the most important biological
function of mucus is protection of tissues against dehydration. In order to fulfil this function, the mucous gel needs to be strongly hydrated.
17 Thus, the highly hydrated gel consists primarily of water (~95%), the glycoprotein mucin, and other components: enzymes, other proteins, electrolytes, lipids10-14; the concentration of which depends on the mucus source. The thickness
of the mucus film also varies with its origin. For example, in the stomach it is reported to be 50-600 µm and in the intestine and colon 15-450 µm 15. For the
respiratory tract mucus the thickness is estimated to be 5-10 µm and for the alveolar regions it is less than or equal to 1 µm16.
Mucin
The term “mucin” comes from the mucus glycoproteins, secreted by epithelia. However, later it turned out that the epithelia produce transmembrane glycoproteins, which were described as mucins as well. Thus both glycoproteins, membrane bound and secreted, are considered as mucins. Established in 1990, the gene family, with the symbol MUC, followed by a number, represents the mucins17. Presently about twenty MUC – genes have been found but not all are
fully sequenced1,8,10,18. Mucus secretion comprises more than one gene product,
for example, human colon epithelia contains at least three mucin genes: MUC 2, 3, and 419.
Mucin molecule
Mucin is a major component of mucus, forming the macromolecular matrix responsible for its viscoelastic properties11,12,20. Mucins are large glycoproteins
with high molar masses, varying from 0.5-40 MDa, and are expressed in epithelial and glandular tissues10,21. Even though structural and physico-chemical
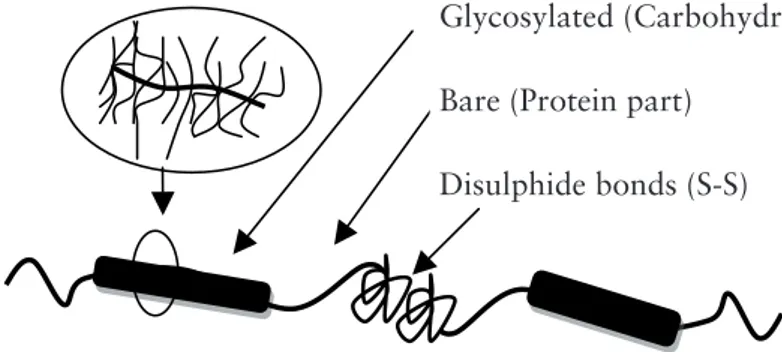
properties of mucins vary depending on origin, the glycoproteins share common features. Generally, the mucin molecule consists of hydrophilic and hydrophobic parts: a highly glycosylated central protein core and one or two terminal peptide regions which are either non-glycosylated22 or carry only a few carbohydrate
moieties (Figure 1.1).
The protein core, containing domains rich in the amino acids threonine, serine, and proline, represents 10-30% of the total mass of the mucin molecule23. These
domains are composed of tandemly repeated sequences that vary in number, length, and amino acid sequence from one mucin to another24. Threonine and
serine hydroxyl groups are linked to the glycosylated part of the mucin molecule8.
The carbohydrate content can be up to 80% of the total mass of the molecule, and consists of N-acetylgalactosamine, N-acetylglucosamine, fucose, galactose, and sialic acid25. The carbohydrates are present as short chains, often branched,
and attached to the polypeptide chain by O-glycosidic bonds to the –OH group of serine and threonine residues25. The carbohydrate side chains size depends
18
on the mucous secretion source and varies from 2 to 5 sugar units per chain (sheep and pig submaxillary mucus) up to 16 to 19 sugar units per chain (human ovarian cyst and pig gastric mucus)6.
Non-glycosylated or bare parts of the mucin molecule are rich in cysteine, found in the N- and C-terminal ends of the protein core. Cysteine-rich domains are responsible for dimerization via disulphide bond formation, and afterwards polymerizations of these dimers to form mucin multimers (Figure 1.1). Disulphide bond formation plays an important role in the gel forming properties of mucin10. The electrostatic character of mucins is determined by the polypeptide
backbone, for example, glutamic acid and aspartic acid residues (pKa=4)26 and
by carbohydrate side chains27,28, which are often negatively charged owing to
the presence of sialic acid residues (pKa=2.6) and sulphate groups (pKa=1)29. The
isoelectric point of mucin, caused by these acidic groups, have been determined to 2-327. Such negatively charged mucins may form polyelectrolyte complexes
with positively charged polymers, for example, with chitosan22.
Models of pig gastric and bovine submaxillary gland mucins
(PGM and BSM)
As previously mentioned, the structural and physico-chemical properties of mucin vary depending on its origin. The high molar mass of the mucin molecule, its polydispersity and high degree of glycosylation10 make this glycoprotein
molecule complex and it is difficult to characterise its structure. Hence mucin molecules are described using different models6,7,14,30-32.
Often PGM and BSM are described with reference to a bottlebrush model (Figure 1.1): a copolymer of relatively rigid (glycosylated) and relatively flexible (bare) moeties6,7,14,30. In this mucin model, the carbohydrate side chain length can
vary from 15 to 50 nm7.
Figure 1.1 Schematic illustration of a bottlebrush mucin molecule7.
10
Non-glycosylated or bare parts of the mucin molecule are rich in cysteine, found in the N-
and C-terminal ends of the protein core. Cysteine-rich domains are responsible for
dimerization via disulphide bond formation, and afterwards polymerizations of these dimers
to form mucin multimers (Figure 1.1). Disulphide bond formation plays an important role in
the gel forming properties of mucin
10. The electrostatic character of mucins is determined by
the polypeptide backbone, for example, glutamic acid and aspartic acid residues (pK
a=4)
26and by carbohydrate side chains
27,28, which are often negatively charged owing to the
presence of sialic acid residues (pK
a=2.6) and sulphate groups (pK
a=1)
29. The isoelectric
point of mucin, caused by these acidic groups, have been determined to 2-3
27. Such
negatively charged mucins may form polyelectrolyte complexes with positively charged
polymers, for example, with chitosan
22.
Models of pig gastric and bovine submaxillary gland mucins (PGM and BSM)
As previously mentioned, the structural and physico-chemical properties of mucin vary
depending on its origin. The high molar mass of the mucin molecule, its polydispersity and
high degree of glycosylation
10make this glycoprotein molecule complex and it is difficult to
characterise its structure. Hence mucin molecules are described using different models
6,7,14,30-32
. Often PGM and BSM are described with reference to a bottlebrush model (Figure 1.1): a
copolymer of relatively rigid (glycosylated) and relatively flexible (bare) moeties
6,7,14,30. In
this mucin model, the carbohydrate side chain length can vary from 15 to 50 nm
7.
Figure1.1 Schematic illustration of a bottlebrush mucin molecule
7.
The PGM molecule has also been described as having a dumbbell shape (Figure 1.2),
presented as two asymmetric
31or symmetric
32globules per chain separated by a heavily
Glycosylated (Carbohydrate part)
Bare (Protein part)
Disulphide bonds (S-S)
Glycosylated (Carbohydrate part) Bare (Protein part)
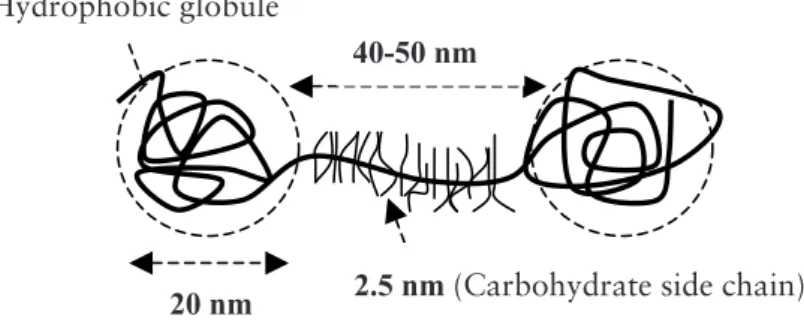
19 The PGM molecule has also been described as having a dumbbell shape (Figure 1.2), presented as two asymmetric31 or symmetric32 globules per chain separated
by a heavily glycosylated spacer. The carbohydrate side chain length for a dumbbell shaped molecule is different than that for a bottlebrush, and it is about 2.5 nm32.
Figure 1.2 Schematic illustration of a dumbbell PGM molecule32.
The carbohydrate content of BSM is different in comparison with PGM having the higher content; i.e., the carbohydrate content in PGM is about 83-86 wt%23,33,
and in BSM it is about 61-69 wt%23,33-36.
Also, the content of sialic acid in PGM and BSM differs. The sialic acid content in PGM is about 2-3 wt%23,33,36, therefore PGM is considered as a weakly charged
molecule28. BSM contains much higher amount of sialic acid, i.e. about 32-36
wt%23,33,36.
hydration of mucin
Water is the main constituent of our body: cells, tissues and organs primarily consist of water37; consequently dehydration of living systems results in
dysfunction, disease, or ultimately death. In living systems mucins are most often arranged in thin films covering the hydrated tissue. Hydration of mucin films therefore plays a key role in the protection of the tissues against dehydration. Monitoring hydration-induced changes in mucin systems upon addition of water, from the dry to the fully hydrated state, provides information regarding mucin properties in both dry and hydrated states. Thus, sorption isotherms, enthalpies of hydration, and glass transition behaviours need to be considered in the evaluation of mucin hydration.
11
glycosylated spacer. The carbohydrate side chain length for a dumbbell shaped molecule is
different than that for a bottlebrush, and it is about 2.5 nm
32.
Figure 1.2 Schematic illustration of a dumbbell PGM molecule
32.
The carbohydrate content of BSM is different in comparison with PGM having the higher
content; i.e., the carbohydrate content in PGM is about 83-86 wt%
23,33, and in BSM it is about
61-69 wt%
23,33-36.
Also, the content of sialic acid in PGM and BSM differs. The sialic acid content in PGM is
about 2-3 wt%
23,33,36, therefore PGM is considered as a weakly charged molecule
28. BSM
contains much higher amount of sialic acid, i.e. about 32-36 wt%
23,33,36.
Hydration of mucin
Water is the main constituent of our body: cells, tissues and organs primarily consist of water
37
; consequently dehydration of living systems results in dysfunction, disease, or ultimately
death. In living systems mucins are most often arranged in thin films covering the hydrated
tissue. Hydration of mucin films therefore plays a key role in the protection of the tissues
against dehydration.
Monitoring hydration-induced changes in mucin systems upon addition of water, from the
dry to the fully hydrated state, provides information regarding mucin properties in both dry
and hydrated states. Thus, sorption isotherms, enthalpies of hydration, and glass transition
behaviours need to be considered in the evaluation of mucin hydration.
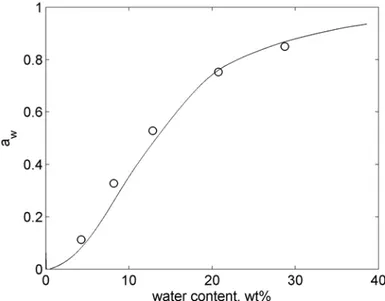
Sorption isotherm is usually presented in the form of water activity, ��, or RH, as a function
of water content (amount of absorbed water vapour). Water activity is defined as
��=����0
, where �� is the vapour pressure of water in the system studied and ��0 is the
vapour pressure of pure water. Also, the water activity can be expressed in terms of the
40-50 nm
20 nm
2.5 nm (Carbohydrate side chain)
Hydrophobic globule
40-50 nm
20 nm 2.5 nm (Carbohydrate side chain) Hydrophobic globule
20
Sorption isotherm is usually presented in the form of water activity, , or RH, as a function of water content (amount of absorbed water vapour). Water activity is defined as
22
therms, enthalpies of hydration, and glass transition behaviours need to be considered in the evaluation of mucin hydration.
Sorption isotherm is usually presented in the form of water activity, 𝑎𝑎𝑤𝑤, or
RH, as a function of water content (amount of absorbed water vapour). Wa-ter activity is defined as 𝑎𝑎𝑤𝑤 = 𝑝𝑝𝑤𝑤⁄ , where 𝑝𝑝𝑝𝑝𝑤𝑤0 𝑤𝑤 is the vapour pressure of
wa-ter in the system studied and 𝑝𝑝𝑤𝑤0 is the vapour pressure of pure water. Also,
the water activity can be expressed in terms of the relative humidity (RH) of air 𝑎𝑎𝑤𝑤 = 𝑝𝑝𝑤𝑤⁄𝑝𝑝𝑤𝑤0 = 𝑅𝑅𝑅𝑅 100⁄ . The chemical potential can also be expressed in
terms of RH 𝜇𝜇𝑤𝑤 = 𝜇𝜇𝑤𝑤𝑜𝑜 + 𝑅𝑅𝑅𝑅𝑅𝑅𝑅𝑅(𝑎𝑎𝑤𝑤) = 𝜇𝜇𝑤𝑤𝑜𝑜 + 𝑅𝑅𝑅𝑅𝑅𝑅𝑅𝑅(𝑝𝑝𝑤𝑤⁄ ) = 𝜇𝜇𝑝𝑝𝑤𝑤0 𝑤𝑤𝑜𝑜 + 𝑅𝑅𝑅𝑅𝑅𝑅𝑅𝑅(𝑅𝑅𝑅𝑅 100⁄ ), where 𝜇𝜇𝑤𝑤
is the chemical potential of water in the system; 𝜇𝜇𝑤𝑤𝑜𝑜 is the chemical potential
of pure water at the absolute temperature 𝑅𝑅; 𝑅𝑅 is the gas constant (8.314 J/molK). For a condensed phase, the chemical potential of water is equal to that of the vapour in equilibrium with the condensed phase.
The enthalpy 𝑅𝑅 is the measure of heat at constant pressure. The heat required for a temperature change 𝑑𝑑𝑅𝑅 at constant pressure 𝑃𝑃 is defined as heat capacity 𝐶𝐶𝑝𝑝= (𝑑𝑑𝑅𝑅 𝑑𝑑𝑅𝑅⁄ )𝑃𝑃. In sorption calorimetry, it is possible to measure the
enthal-py of hydration or partial molar enthalenthal-py of mixing of water, 𝑅𝑅𝑤𝑤𝑚𝑚. This is a
measure of water material interactions as it represents the change in partial molar enthalpy of water upon mixing, when the sorption process occurs at equilibrium conditions. Enthalpy of hydration is defined as the heat produced when one mole of the condensed vapour is mixed with an infinite amount of a material (at constant values of vapour content and total pressure)38.
Measuring the water activity and the enthalpy of hydration simultaneously, using sorption calorimetry, allows for detecting phase transitions and the iso-thermal glass transition. A more common method of determination of glass transition is differential scanning calorimetry (DSC). A solid phase is defined as a glass if it is noncrystalline and exhibits what appears to be a
second-is the vapour pressure of water in the system studied and
22
therms, enthalpies of hydration, and glass transition behaviours need to be considered in the evaluation of mucin hydration.
Sorption isotherm is usually presented in the form of water activity, 𝑎𝑎𝑤𝑤, or
RH, as a function of water content (amount of absorbed water vapour). Wa-ter activity is defined as 𝑎𝑎𝑤𝑤 = 𝑝𝑝𝑤𝑤⁄ , where 𝑝𝑝𝑝𝑝𝑤𝑤0 𝑤𝑤 is the vapour pressure of
wa-ter in the system studied and 𝑝𝑝𝑤𝑤0 is the vapour pressure of pure water. Also,
the water activity can be expressed in terms of the relative humidity (RH) of air 𝑎𝑎𝑤𝑤 = 𝑝𝑝𝑤𝑤⁄𝑝𝑝𝑤𝑤0 = 𝑅𝑅𝑅𝑅 100⁄ . The chemical potential can also be expressed in
terms of RH 𝜇𝜇𝑤𝑤 = 𝜇𝜇𝑤𝑤𝑜𝑜 + 𝑅𝑅𝑅𝑅𝑅𝑅𝑅𝑅(𝑎𝑎𝑤𝑤) = 𝜇𝜇𝑤𝑤𝑜𝑜 + 𝑅𝑅𝑅𝑅𝑅𝑅𝑅𝑅(𝑝𝑝𝑤𝑤⁄ ) = 𝜇𝜇𝑝𝑝𝑤𝑤0 𝑤𝑤𝑜𝑜 + 𝑅𝑅𝑅𝑅𝑅𝑅𝑅𝑅(𝑅𝑅𝑅𝑅 100⁄ ), where 𝜇𝜇𝑤𝑤
is the chemical potential of water in the system; 𝜇𝜇𝑤𝑤𝑜𝑜 is the chemical potential
of pure water at the absolute temperature 𝑅𝑅; 𝑅𝑅 is the gas constant (8.314 J/molK). For a condensed phase, the chemical potential of water is equal to that of the vapour in equilibrium with the condensed phase.
The enthalpy 𝑅𝑅 is the measure of heat at constant pressure. The heat required for a temperature change 𝑑𝑑𝑅𝑅 at constant pressure 𝑃𝑃 is defined as heat capacity 𝐶𝐶𝑝𝑝= (𝑑𝑑𝑅𝑅 𝑑𝑑𝑅𝑅⁄ )𝑃𝑃. In sorption calorimetry, it is possible to measure the
enthal-py of hydration or partial molar enthalenthal-py of mixing of water, 𝑅𝑅𝑤𝑤𝑚𝑚. This is a
measure of water material interactions as it represents the change in partial molar enthalpy of water upon mixing, when the sorption process occurs at equilibrium conditions. Enthalpy of hydration is defined as the heat produced when one mole of the condensed vapour is mixed with an infinite amount of a material (at constant values of vapour content and total pressure)38.
Measuring the water activity and the enthalpy of hydration simultaneously, using sorption calorimetry, allows for detecting phase transitions and the iso-thermal glass transition. A more common method of determination of glass transition is differential scanning calorimetry (DSC). A solid phase is defined as a glass if it is noncrystalline and exhibits what appears to be a
is the vapour pressure of pure water. Also, the water activity can be expressed in terms of the relative humidity (RH) of air
22
therms, enthalpies of hydration, and glass transition behaviours need to be considered in the evaluation of mucin hydration.
Sorption isotherm is usually presented in the form of water activity, 𝑎𝑎𝑤𝑤, or
RH, as a function of water content (amount of absorbed water vapour). Wa-ter activity is defined as 𝑎𝑎𝑤𝑤 = 𝑝𝑝𝑤𝑤⁄ , where 𝑝𝑝𝑝𝑝𝑤𝑤0 𝑤𝑤 is the vapour pressure of
wa-ter in the system studied and 𝑝𝑝𝑤𝑤0 is the vapour pressure of pure water. Also,
the water activity can be expressed in terms of the relative humidity (RH) of air 𝑎𝑎𝑤𝑤= 𝑝𝑝𝑤𝑤⁄𝑝𝑝𝑤𝑤0 = 𝑅𝑅𝑅𝑅 100⁄ . The chemical potential can also be expressed in
terms of RH 𝜇𝜇𝑤𝑤 = 𝜇𝜇𝑤𝑤𝑜𝑜 + 𝑅𝑅𝑅𝑅𝑅𝑅𝑅𝑅(𝑎𝑎𝑤𝑤) = 𝜇𝜇𝑤𝑤𝑜𝑜 + 𝑅𝑅𝑅𝑅𝑅𝑅𝑅𝑅(𝑝𝑝𝑤𝑤⁄ ) = 𝜇𝜇𝑝𝑝𝑤𝑤0 𝑤𝑤𝑜𝑜 + 𝑅𝑅𝑅𝑅𝑅𝑅𝑅𝑅(𝑅𝑅𝑅𝑅 100⁄ ), where 𝜇𝜇𝑤𝑤
is the chemical potential of water in the system; 𝜇𝜇𝑤𝑤𝑜𝑜 is the chemical potential
of pure water at the absolute temperature 𝑅𝑅; 𝑅𝑅 is the gas constant (8.314 J/molK). For a condensed phase, the chemical potential of water is equal to that of the vapour in equilibrium with the condensed phase.
The enthalpy 𝑅𝑅 is the measure of heat at constant pressure. The heat required for a temperature change 𝑑𝑑𝑅𝑅 at constant pressure 𝑃𝑃 is defined as heat capacity 𝐶𝐶𝑝𝑝= (𝑑𝑑𝑅𝑅 𝑑𝑑𝑅𝑅⁄ )𝑃𝑃. In sorption calorimetry, it is possible to measure the
enthal-py of hydration or partial molar enthalenthal-py of mixing of water, 𝑅𝑅𝑤𝑤𝑚𝑚. This is a
measure of water material interactions as it represents the change in partial molar enthalpy of water upon mixing, when the sorption process occurs at equilibrium conditions. Enthalpy of hydration is defined as the heat produced when one mole of the condensed vapour is mixed with an infinite amount of a material (at constant values of vapour content and total pressure)38.
Measuring the water activity and the enthalpy of hydration simultaneously, using sorption calorimetry, allows for detecting phase transitions and the iso-thermal glass transition. A more common method of determination of glass transition is differential scanning calorimetry (DSC). A solid phase is defined as a glass if it is noncrystalline and exhibits what appears to be a
second-. The chemical potential can also be expressed in terms of RH
22
therms, enthalpies of hydration, and glass transition behaviours need to be considered in the evaluation of mucin hydration.
Sorption isotherm is usually presented in the form of water activity, 𝑎𝑎𝑤𝑤, or
RH, as a function of water content (amount of absorbed water vapour). Wa-ter activity is defined as 𝑎𝑎𝑤𝑤= 𝑝𝑝𝑤𝑤⁄ , where 𝑝𝑝𝑝𝑝𝑤𝑤0 𝑤𝑤 is the vapour pressure of
wa-ter in the system studied and 𝑝𝑝𝑤𝑤0 is the vapour pressure of pure water. Also,
the water activity can be expressed in terms of the relative humidity (RH) of air 𝑎𝑎𝑤𝑤 = 𝑝𝑝𝑤𝑤⁄𝑝𝑝𝑤𝑤0 = 𝑅𝑅𝑅𝑅 100⁄ . The chemical potential can also be expressed in
terms of RH 𝜇𝜇𝑤𝑤= 𝜇𝜇𝑤𝑤𝑜𝑜 + 𝑅𝑅𝑅𝑅𝑅𝑅𝑅𝑅(𝑎𝑎𝑤𝑤) = 𝜇𝜇𝑤𝑤𝑜𝑜 + 𝑅𝑅𝑅𝑅𝑅𝑅𝑅𝑅(𝑝𝑝𝑤𝑤⁄ ) = 𝜇𝜇𝑝𝑝𝑤𝑤0 𝑤𝑤𝑜𝑜 + 𝑅𝑅𝑅𝑅𝑅𝑅𝑅𝑅(𝑅𝑅𝑅𝑅 100⁄ ), where 𝜇𝜇𝑤𝑤
is the chemical potential of water in the system; 𝜇𝜇𝑤𝑤𝑜𝑜 is the chemical potential
of pure water at the absolute temperature 𝑅𝑅; 𝑅𝑅 is the gas constant (8.314 J/molK). For a condensed phase, the chemical potential of water is equal to that of the vapour in equilibrium with the condensed phase.
The enthalpy 𝑅𝑅 is the measure of heat at constant pressure. The heat required for a temperature change 𝑑𝑑𝑅𝑅 at constant pressure 𝑃𝑃 is defined as heat capacity 𝐶𝐶𝑝𝑝= (𝑑𝑑𝑅𝑅 𝑑𝑑𝑅𝑅⁄ )𝑃𝑃. In sorption calorimetry, it is possible to measure the
enthal-py of hydration or partial molar enthalenthal-py of mixing of water, 𝑅𝑅𝑤𝑤𝑚𝑚. This is a
measure of water material interactions as it represents the change in partial molar enthalpy of water upon mixing, when the sorption process occurs at equilibrium conditions. Enthalpy of hydration is defined as the heat produced when one mole of the condensed vapour is mixed with an infinite amount of a material (at constant values of vapour content and total pressure)38.
Measuring the water activity and the enthalpy of hydration simultaneously, using sorption calorimetry, allows for detecting phase transitions and the iso-thermal glass transition. A more common method of determination of glass transition is differential scanning calorimetry (DSC). A solid phase is defined as a glass if it is noncrystalline and exhibits what appears to be a
second-where
22
therms, enthalpies of hydration, and glass transition behaviours need to be considered in the evaluation of mucin hydration.
Sorption isotherm is usually presented in the form of water activity, 𝑎𝑎𝑤𝑤, or
RH, as a function of water content (amount of absorbed water vapour). Wa-ter activity is defined as 𝑎𝑎𝑤𝑤= 𝑝𝑝𝑤𝑤⁄ , where 𝑝𝑝𝑝𝑝𝑤𝑤0 𝑤𝑤 is the vapour pressure of
wa-ter in the system studied and 𝑝𝑝𝑤𝑤0 is the vapour pressure of pure water. Also,
the water activity can be expressed in terms of the relative humidity (RH) of air 𝑎𝑎𝑤𝑤= 𝑝𝑝𝑤𝑤⁄𝑝𝑝𝑤𝑤0 = 𝑅𝑅𝑅𝑅 100⁄ . The chemical potential can also be expressed in
terms of RH 𝜇𝜇𝑤𝑤 = 𝜇𝜇𝑤𝑤𝑜𝑜 + 𝑅𝑅𝑅𝑅𝑅𝑅𝑅𝑅(𝑎𝑎𝑤𝑤) = 𝜇𝜇𝑤𝑤𝑜𝑜 + 𝑅𝑅𝑅𝑅𝑅𝑅𝑅𝑅(𝑝𝑝𝑤𝑤⁄ ) = 𝜇𝜇𝑝𝑝𝑤𝑤0 𝑤𝑤𝑜𝑜 + 𝑅𝑅𝑅𝑅𝑅𝑅𝑅𝑅(𝑅𝑅𝑅𝑅 100⁄ ), where 𝜇𝜇𝑤𝑤
is the chemical potential of water in the system; 𝜇𝜇𝑤𝑤𝑜𝑜 is the chemical potential
of pure water at the absolute temperature 𝑅𝑅; 𝑅𝑅 is the gas constant (8.314 J/molK). For a condensed phase, the chemical potential of water is equal to that of the vapour in equilibrium with the condensed phase.
The enthalpy 𝑅𝑅 is the measure of heat at constant pressure. The heat required for a temperature change 𝑑𝑑𝑅𝑅 at constant pressure 𝑃𝑃 is defined as heat capacity 𝐶𝐶𝑝𝑝= (𝑑𝑑𝑅𝑅 𝑑𝑑𝑅𝑅⁄ )𝑃𝑃. In sorption calorimetry, it is possible to measure the
enthal-py of hydration or partial molar enthalenthal-py of mixing of water, 𝑅𝑅𝑤𝑤𝑚𝑚. This is a
measure of water material interactions as it represents the change in partial molar enthalpy of water upon mixing, when the sorption process occurs at equilibrium conditions. Enthalpy of hydration is defined as the heat produced when one mole of the condensed vapour is mixed with an infinite amount of a material (at constant values of vapour content and total pressure)38.
Measuring the water activity and the enthalpy of hydration simultaneously, using sorption calorimetry, allows for detecting phase transitions and the iso-thermal glass transition. A more common method of determination of glass transition is differential scanning calorimetry (DSC). A solid phase is defined as a glass if it is noncrystalline and exhibits what appears to be a
is the chemical potential of water in the system;
22
therms, enthalpies of hydration, and glass transition behaviours need to be considered in the evaluation of mucin hydration.
Sorption isotherm is usually presented in the form of water activity, 𝑎𝑎𝑤𝑤, or
RH, as a function of water content (amount of absorbed water vapour). Wa-ter activity is defined as 𝑎𝑎𝑤𝑤 = 𝑝𝑝𝑤𝑤⁄ , where 𝑝𝑝𝑝𝑝𝑤𝑤0 𝑤𝑤 is the vapour pressure of
wa-ter in the system studied and 𝑝𝑝𝑤𝑤0 is the vapour pressure of pure water. Also,
the water activity can be expressed in terms of the relative humidity (RH) of air 𝑎𝑎𝑤𝑤 = 𝑝𝑝𝑤𝑤⁄𝑝𝑝𝑤𝑤0 = 𝑅𝑅𝑅𝑅 100⁄ . The chemical potential can also be expressed in
terms of RH 𝜇𝜇𝑤𝑤 = 𝜇𝜇𝑤𝑤𝑜𝑜 + 𝑅𝑅𝑅𝑅𝑅𝑅𝑅𝑅(𝑎𝑎𝑤𝑤) = 𝜇𝜇𝑤𝑤𝑜𝑜 + 𝑅𝑅𝑅𝑅𝑅𝑅𝑅𝑅(𝑝𝑝𝑤𝑤⁄ ) = 𝜇𝜇𝑝𝑝𝑤𝑤0 𝑤𝑤𝑜𝑜 + 𝑅𝑅𝑅𝑅𝑅𝑅𝑅𝑅(𝑅𝑅𝑅𝑅 100⁄ ), where 𝜇𝜇𝑤𝑤
is the chemical potential of water in the system; 𝜇𝜇𝑤𝑤𝑜𝑜 is the chemical potential
of pure water at the absolute temperature 𝑅𝑅; 𝑅𝑅 is the gas constant (8.314 J/molK). For a condensed phase, the chemical potential of water is equal to that of the vapour in equilibrium with the condensed phase.
The enthalpy 𝑅𝑅 is the measure of heat at constant pressure. The heat required for a temperature change 𝑑𝑑𝑅𝑅 at constant pressure 𝑃𝑃 is defined as heat capacity 𝐶𝐶𝑝𝑝= (𝑑𝑑𝑅𝑅 𝑑𝑑𝑅𝑅⁄ )𝑃𝑃. In sorption calorimetry, it is possible to measure the
enthal-py of hydration or partial molar enthalenthal-py of mixing of water, 𝑅𝑅𝑤𝑤𝑚𝑚. This is a
measure of water material interactions as it represents the change in partial molar enthalpy of water upon mixing, when the sorption process occurs at equilibrium conditions. Enthalpy of hydration is defined as the heat produced when one mole of the condensed vapour is mixed with an infinite amount of a material (at constant values of vapour content and total pressure)38.
Measuring the water activity and the enthalpy of hydration simultaneously, using sorption calorimetry, allows for detecting phase transitions and the iso-thermal glass transition. A more common method of determination of glass transition is differential scanning calorimetry (DSC). A solid phase is defined as a glass if it is noncrystalline and exhibits what appears to be a
is the chemical potential of pure water at the absolute temperature T; R is the gas constant (8.314 J/mol/K). For a condensed phase, the chemical potential of water is equal to that of the vapour in equilibrium with the condensed phase.
The enthalpy H is the measure of heat at constant pressure. The heat required for a temperature change dT at constant pressure P is defined as heat capacity
22
therms, enthalpies of hydration, and glass transition behaviours need to be considered in the evaluation of mucin hydration.
Sorption isotherm is usually presented in the form of water activity, 𝑎𝑎𝑤𝑤, or
RH, as a function of water content (amount of absorbed water vapour). Wa-ter activity is defined as 𝑎𝑎𝑤𝑤= 𝑝𝑝𝑤𝑤⁄ , where 𝑝𝑝𝑝𝑝𝑤𝑤0 𝑤𝑤 is the vapour pressure of
wa-ter in the system studied and 𝑝𝑝𝑤𝑤0 is the vapour pressure of pure water. Also,
the water activity can be expressed in terms of the relative humidity (RH) of air 𝑎𝑎𝑤𝑤 = 𝑝𝑝𝑤𝑤⁄𝑝𝑝𝑤𝑤0 = 𝑅𝑅𝑅𝑅 100⁄ . The chemical potential can also be expressed in
terms of RH 𝜇𝜇𝑤𝑤= 𝜇𝜇𝑤𝑤𝑜𝑜 + 𝑅𝑅𝑅𝑅𝑅𝑅𝑅𝑅(𝑎𝑎𝑤𝑤) = 𝜇𝜇𝑤𝑤𝑜𝑜 + 𝑅𝑅𝑅𝑅𝑅𝑅𝑅𝑅(𝑝𝑝𝑤𝑤⁄ ) = 𝜇𝜇𝑝𝑝𝑤𝑤0 𝑤𝑤𝑜𝑜 + 𝑅𝑅𝑅𝑅𝑅𝑅𝑅𝑅(𝑅𝑅𝑅𝑅 100⁄ ), where 𝜇𝜇𝑤𝑤
is the chemical potential of water in the system; 𝜇𝜇𝑤𝑤𝑜𝑜 is the chemical potential
of pure water at the absolute temperature 𝑅𝑅; 𝑅𝑅 is the gas constant (8.314 J/molK). For a condensed phase, the chemical potential of water is equal to that of the vapour in equilibrium with the condensed phase.
The enthalpy 𝑅𝑅 is the measure of heat at constant pressure. The heat required for a temperature change 𝑑𝑑𝑅𝑅 at constant pressure 𝑃𝑃 is defined as heat capacity 𝐶𝐶𝑝𝑝= (𝑑𝑑𝑅𝑅 𝑑𝑑𝑅𝑅⁄ )𝑃𝑃. In sorption calorimetry, it is possible to measure the
enthal-py of hydration or partial molar enthalenthal-py of mixing of water, 𝑅𝑅𝑤𝑤𝑚𝑚. This is a
measure of water material interactions as it represents the change in partial molar enthalpy of water upon mixing, when the sorption process occurs at equilibrium conditions. Enthalpy of hydration is defined as the heat produced when one mole of the condensed vapour is mixed with an infinite amount of a material (at constant values of vapour content and total pressure)38.
Measuring the water activity and the enthalpy of hydration simultaneously, using sorption calorimetry, allows for detecting phase transitions and the iso-thermal glass transition. A more common method of determination of glass transition is differential scanning calorimetry (DSC). A solid phase is defined as a glass if it is noncrystalline and exhibits what appears to be a
second-. In sorption calorimetry, it is possible to measure the enthalpy of hydration or partial molar enthalpy of mixing of water,
22
therms, enthalpies of hydration, and glass transition behaviours need to be considered in the evaluation of mucin hydration.
Sorption isotherm is usually presented in the form of water activity, 𝑎𝑎𝑤𝑤, or
RH, as a function of water content (amount of absorbed water vapour). Wa-ter activity is defined as 𝑎𝑎𝑤𝑤 = 𝑝𝑝𝑤𝑤⁄ , where 𝑝𝑝𝑝𝑝𝑤𝑤0 𝑤𝑤 is the vapour pressure of
wa-ter in the system studied and 𝑝𝑝𝑤𝑤0 is the vapour pressure of pure water. Also,
the water activity can be expressed in terms of the relative humidity (RH) of air 𝑎𝑎𝑤𝑤 = 𝑝𝑝𝑤𝑤⁄𝑝𝑝𝑤𝑤0 = 𝑅𝑅𝑅𝑅 100⁄ . The chemical potential can also be expressed in
terms of RH 𝜇𝜇𝑤𝑤= 𝜇𝜇𝑤𝑤𝑜𝑜 + 𝑅𝑅𝑅𝑅𝑅𝑅𝑅𝑅(𝑎𝑎𝑤𝑤) = 𝜇𝜇𝑤𝑤𝑜𝑜 + 𝑅𝑅𝑅𝑅𝑅𝑅𝑅𝑅(𝑝𝑝𝑤𝑤⁄ ) = 𝜇𝜇𝑝𝑝𝑤𝑤0 𝑤𝑤𝑜𝑜 + 𝑅𝑅𝑅𝑅𝑅𝑅𝑅𝑅(𝑅𝑅𝑅𝑅 100⁄ ), where 𝜇𝜇𝑤𝑤
is the chemical potential of water in the system; 𝜇𝜇𝑤𝑤𝑜𝑜 is the chemical potential
of pure water at the absolute temperature 𝑅𝑅; 𝑅𝑅 is the gas constant (8.314 J/molK). For a condensed phase, the chemical potential of water is equal to that of the vapour in equilibrium with the condensed phase.
The enthalpy 𝑅𝑅 is the measure of heat at constant pressure. The heat required for a temperature change 𝑑𝑑𝑅𝑅 at constant pressure 𝑃𝑃 is defined as heat capacity 𝐶𝐶𝑝𝑝= (𝑑𝑑𝑅𝑅 𝑑𝑑𝑅𝑅⁄ )𝑃𝑃. In sorption calorimetry, it is possible to measure the
enthal-py of hydration or partial molar enthalenthal-py of mixing of water, 𝑅𝑅𝑤𝑤𝑚𝑚. This is a
measure of water material interactions as it represents the change in partial molar enthalpy of water upon mixing, when the sorption process occurs at equilibrium conditions. Enthalpy of hydration is defined as the heat produced when one mole of the condensed vapour is mixed with an infinite amount of a material (at constant values of vapour content and total pressure)38.
Measuring the water activity and the enthalpy of hydration simultaneously, using sorption calorimetry, allows for detecting phase transitions and the iso-thermal glass transition. A more common method of determination of glass transition is differential scanning calorimetry (DSC). A solid phase is defined as a glass if it is noncrystalline and exhibits what appears to be a
second-. This is a measure of water material interactions as it represents the change in partial molar enthalpy of water upon mixing, when the sorption process occurs at equilibrium conditions. Enthalpy of hydration is defined as the heat produced when one mole of the condensed vapour is mixed with an infinite amount of a material (at constant values of vapour content and total pressure)38.
Measuring the water activity and the enthalpy of hydration simultaneously, using sorption calorimetry, allows for detecting phase transitions and the isothermal glass transition. A more common method of determination of glass transition is differential scanning calorimetry (DSC). A solid phase is defined as a glass if it is noncrystalline and exhibits what appears to be a second-order transition in heat capacity measurements. Glass transition is a change of the system from a solid-like to a liquid-like behaviour or a transition from glassy to elastic states. At this type of transition structural changes of the system do not take place, only changes of the chain mobility occur39.
Only a few reports on water sorption isotherms of mucin can be found in the literature; in particular, pedal mucus trails40, porcine mucin41, bovine and porcine
submaxillary mucins34, using gravimetric methods. In this work we present
sorption isotherms of PGM and BSM at 25, 40 and 50°C using the sorption calorimetry method, which as far as we are aware was not applied in studies of mucin systems. Since mucin is a carbohydrate polymer, it is expected that at low RH, water molecules easily and primarily interact with charged groups, and therefore the energy of interaction of water with charged polymers might be expected to be higher than with non-charged polymers. However reported data
21 on sorption energies of charged and non-charged biopolymers show that water-ion interactwater-ions do not affect hydratwater-ion enthalpies42, and that the enthalpy of
hydration values of charged and non-charged biopolymers and proteins at zero water content at 25°C are about -18 kJ/mol42-44.
A number of studies have been focused on phase behaviour of mucins using different techniques7,14,45-47 including polarized light microscopy7,46,47, small angle
neutron scattering (SANS)29 and DSC7. Some studies reported the mucin ability
to form liquid crystals. For example, Viney et al. observed formation of liquid crystalline domains in slug pedal mucin46 and partially dried giraffe saliva47 by
polarized light microscopy. Waigh et al.29 observed a polydomain nematic phase
in porcine stomach mucin using light scattering measurements, small angle neutron scattering (SANS) and rheological experiments and suggested that the mucin phase behaviour is a function of concentration.
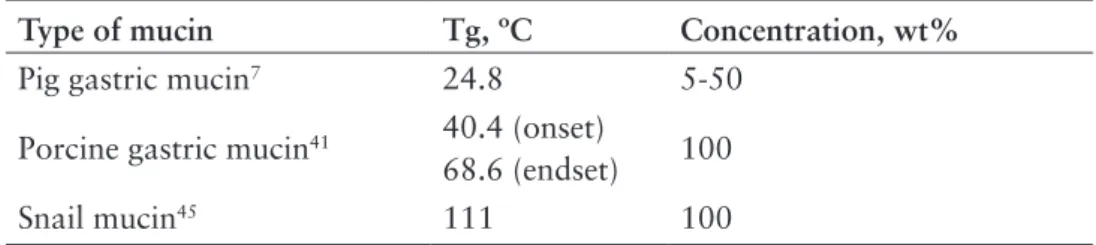
Table 1.1 Literature data of glass transition temperature (Tg) of mucins
Type of mucin Tg, ºC Concentration, wt%
Pig gastric mucin7 24.8 5-50
Porcine gastric mucin41 40.4 (onset)
68.6 (endset) 100
Snail mucin45 111 100
The glass transition temperature as a function of water content is also an important parameter for polymers since their properties undergo dramatic changes at the glass transition42. According to several DSC studies mucins can undergo glass
transitions, and the transition temperature vary for different types of mucins, and can depend on experimental conditions, in particular water content (Table 1.1). Because of variety of discrepancies in reported data on Tg, the exact phase behaviour of mucin as a function of temperature and hydration levels is not completely understood. In an effort to reconcile the literature data we undertook a study of the phase behaviour of PGM and BSM and tried to determine the glass transition temperature using different techniques.
polyelectrolyte multilayers
Formation of polyelectrolyte multilayers (PEM) has gained significant interest since Decher et al.48 for the first time introduced the construction of PEM based
on adsorption of oppositely charged polyelectrolytes, using a layer-by-layer deposition technique. PEM present a wide range of potential applications in
22
different fields such as coating for biomaterials49,50, drug delivery51,52, biosensors53
etc. The mechanism of PEM construction is based on electrostatic interactions and charge overcompensation54,55. The thickness and physico - chemical properties
of PEM films can be controlled by changing the experimental conditions of deposition such as number of adsorption cycles, pH, salt concentration, polyelectrolyte concentration, adsorption time and type of polymer used56-58. In
the latter case, both synthetic and natural polymers can be used. Although many studies focus on synthetic multilayers, in recent years the use of natural polymers, such as polysaccharides, has attracted significant attention because of their low toxicity, biocompatibility and biodegradability. For example, biodegradation in
vitro and in vivo of a chitosan/hyaluronic acid multilayer film was reported by
Picart et al. 59. Moreover, polysaccharide-based PEM is a mimics of extra-cellular
matrices from plant and animal tissues which is interesting to study as a model of native tissues60.
Mucin/chitosan multilayers
Chitosan, one of the most abundant polysaccharides in the world61, is
biodegradable, biocompatible and non-toxic to living tissues62, which makes
it suitable for mucosal delivery. Studying mucin/chitosan multilayer films can help to understand the fundamental properties of native tissues. In particular, it is interesting to study the properties of mucin-chitosan based multilayers films, such as hydration and water sorption capacity, compared to the properties of the individual biopolymers.
Hydration and swelling behaviour of PEM are often studied in liquids (high water activity), using different techniques, and the estimated water content in the multilayers is quite high, ranging from 60 to 90% for different systems60. For
example, Svensson et al.63 studied BSM/chitosan multilayers using ellipsometry
and reported a water content of more than 90% at high water activity. Hydration of PEM at different RH levels has been studied by several authors using different techniques64-67. However most of them are focused on hydration of synthetic
polymers and only a few reports present the water sorption isotherms of PEM and compare them to those of the individual polyelectrolytes64-66. For example,
swelling dynamics of the poly(sodium-4 styrene sulfonate)/poly[(allylamine) hydrochloride] multilayers was studied by Kugler et al. and reported to be slow compared to individual synthetic polymers66. All mentioned above show the
water sorption capacity of polysaccharide-based multilayers at different RH is yet to be determined.
23 In this work assembly and hydration of BSM/chitosan multilayers was studied using the QCM-D technique; water sorption isotherms of multilayers were determined and compared to those of the singular polymers BSM and chitosan.
studied systems
In the present work commercially available, partially purified PGM (Sigma, cat. no M1778) type III, containing 0.5-1.5% bound sialic acid and BSM (Sigma, cat. no M3895), type I-S, containing 9-17% bound sialic acids were used as received without further purification. PGM from the same batch was used for all experiments. However in Papers I, III, and IV, the BSM used was from different batches.
Mucus, collected from a pig’s stomach (PGMC), was used in Paper I without purification, and calculation of masses before and after drying indicated that the mucus contained 95% of water and 5% of solids.
Mucins were dried in vacuum at room temperature in contact with 3 Å molecular sieves for 24 hours directly prior to the experiments. Samples with mucin concentrations below 50 wt% were prepared by adding the appropriate amount of solvent to a weighed amount of dry PGM.
After mixing mucin with solvent, samples were left for equilibration for several days. Preparation of the samples with mucin concentrations above 50 wt% was done, using desiccators with saturated salt solutions which give different relative humidity levels68, where samples were equilibrated for 7-10 days at 25°C. Water
vapour was absorbed by dry mucin, the mucin-water mixtures were weighed to obtain the water content, and then samples were examined in experiments (Paper I and IV).
Chitosan, used in Paper III, was obtained from Fluka BioChemika (low-viscous, Prod. No. 50494) and the degree of acetylation, determined from titrimetric analysis of the amino groups69, was 19%.
The water used in all experiments was of ultrahigh quality (UHQ), purified at 25ºC by Elgastat UHQ II Model UHQ-PS-MK3 (Elga Ltd., High Wycombe, Bucks, UK).
25
chapter 2 experimental techniques
In the present work a combination of several structural and thermodynamic methods was used to characterise hydration-induced changes in mucin systems. The major measuring techniques in this thesis, sorption calorimetry and QCM-D, are described in detail. Other techniques, DSC, SAXS and AFM are explained briefly.
isothermal sorption calorimetry
The word “calorimetry” comes from “calor”, meaning “heat” and “metron” meaning “measure”. Isothermal calorimetry is a method where heat and thermal power are measured at constant temperature. All physical, chemical or biological processes are accompanied by release or absorption of heat and therefore calorimetry is a general measurement technique70.
Isothermal sorption calorimetry is a method for studying hydration of surfactant71, phospholipid72, protein43,73, and polymer42,44 systems. This method
allows simultaneous measurement of the water activity, and the partial molar enthalpy of mixing of water, ,38 providing a complete thermodynamic
characterisation of sorption process at a given temperature.
The sorption calorimetric experiments are performed in a two-chamber calorimetric cell inserted in a double-twin microcalorimeter74. In the sorption
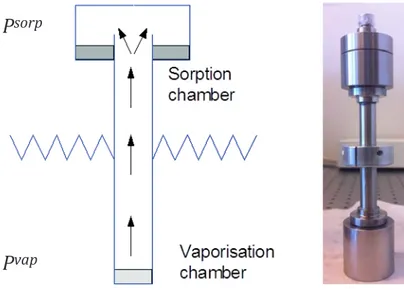
calorimetric measurements completely dry samples are required, i.e. the initial water activity and water content in the samples should be zero. Therefore, the sample drying process usually takes place in vacuum at room temperature in contact with 3 Å molecular sieves for 24–48 hours directly prior to the experiment. The initial dry mass of the sample is usually in the range of 50-150 mg. The dry sample is placed in the upper (sorption) chamber and pure water is injected in the lower (vaporisation) chamber. Evaporated water diffuses through the tube that
26
connects the upper and lower chambers of the calorimetric cell and is absorbed by the sample (Figure 2.1).
The thermal power P released or absorbed in the two chambers are calculated using calorimetric signal U and the corresponding calibration coefficient
29 The sorption calorimetric experiments are performed in a two-chamber calo-rimetric cell inserted in a double-twin microcalorimeter74. In the sorption
cal-orimetric measurements completely dry samples are required, i.e. the initial water activity and water content in the samples should be zero. Therefore, the sample drying process usually takes place in vacuum at room temperature in contact with 3Å molecular sieves for 24 – 48 hours directly prior to the ex-periment. The initial dry mass of the sample is usually in the range of 50-150 mg. The dry sample is placed in the upper (sorption) chamber and pure water is injected in the lower (vaporisation) chamber. Evaporated water diffuses through the tube that connects the upper and lower chambers of the calori-metric cell and is absorbed by the sample (Figure 2.1).
The thermal power P released or absorbed in the two chambers are calculated using calorimetric signal 𝑈𝑈 and the corresponding calibration coefficient 𝜀𝜀:
𝑃𝑃 = 𝑈𝑈𝜀𝜀 (2.1)
The calibration coefficient 𝜀𝜀 is determined by electrical calibration. Since the thermal power is changing with time, Tian’s equation is applied for calcula-tion of the thermal power75:
𝑃𝑃 = 𝜀𝜀 �𝑈𝑈 + 𝜏𝜏𝑑𝑑𝑑𝑑𝑑𝑑𝑑𝑑� (2.2) where the time constant 𝜏𝜏 is determined in calibration experiments.
Figure 2.1 A sorption calorimetric cell (figure from www.mah.se)
The activity of water is calculated from the thermal power of evaporated wa-ter regiswa-tered in vaporization chamber and a simplified equation can be pre-sented as 76:
𝑎𝑎𝑤𝑤 = 1 −𝑃𝑃𝑚𝑚𝑚𝑚𝑚𝑚𝑃𝑃 (2.3)
:
29 The sorption calorimetric experiments are performed in a two-chamber calo-rimetric cell inserted in a double-twin microcalorimeter74. In the sorption
cal-orimetric measurements completely dry samples are required, i.e. the initial water activity and water content in the samples should be zero. Therefore, the sample drying process usually takes place in vacuum at room temperature in contact with 3Å molecular sieves for 24 – 48 hours directly prior to the ex-periment. The initial dry mass of the sample is usually in the range of 50-150 mg. The dry sample is placed in the upper (sorption) chamber and pure water is injected in the lower (vaporisation) chamber. Evaporated water diffuses through the tube that connects the upper and lower chambers of the calori-metric cell and is absorbed by the sample (Figure 2.1).
The thermal power P released or absorbed in the two chambers are calculated using calorimetric signal 𝑈𝑈 and the corresponding calibration coefficient 𝜀𝜀:
𝑃𝑃 = 𝑈𝑈𝜀𝜀 (2.1)
The calibration coefficient 𝜀𝜀 is determined by electrical calibration. Since the thermal power is changing with time, Tian’s equation is applied for calcula-tion of the thermal power75:
𝑃𝑃 = 𝜀𝜀 �𝑈𝑈 + 𝜏𝜏𝑑𝑑𝑑𝑑𝑑𝑑𝑑𝑑� (2.2) where the time constant 𝜏𝜏 is determined in calibration experiments.
Figure 2.1 A sorption calorimetric cell (figure from www.mah.se)
The activity of water is calculated from the thermal power of evaporated wa-ter regiswa-tered in vaporization chamber and a simplified equation can be pre-sented as 76:
𝑎𝑎𝑤𝑤 = 1 −𝑃𝑃𝑚𝑚𝑚𝑚𝑚𝑚𝑃𝑃 (2.3)
(2.1) The calibration coefficient
29 The sorption calorimetric experiments are performed in a two-chamber calo-rimetric cell inserted in a double-twin microcalorimeter74. In the sorption
cal-orimetric measurements completely dry samples are required, i.e. the initial water activity and water content in the samples should be zero. Therefore, the sample drying process usually takes place in vacuum at room temperature in contact with 3Å molecular sieves for 24 – 48 hours directly prior to the ex-periment. The initial dry mass of the sample is usually in the range of 50-150 mg. The dry sample is placed in the upper (sorption) chamber and pure water is injected in the lower (vaporisation) chamber. Evaporated water diffuses through the tube that connects the upper and lower chambers of the calori-metric cell and is absorbed by the sample (Figure 2.1).
The thermal power P released or absorbed in the two chambers are calculated using calorimetric signal 𝑈𝑈 and the corresponding calibration coefficient 𝜀𝜀:
𝑃𝑃 = 𝑈𝑈𝜀𝜀 (2.1)
The calibration coefficient 𝜀𝜀 is determined by electrical calibration. Since the thermal power is changing with time, Tian’s equation is applied for calcula-tion of the thermal power75:
𝑃𝑃 = 𝜀𝜀 �𝑈𝑈 + 𝜏𝜏𝑑𝑑𝑑𝑑𝑑𝑑𝑑𝑑� (2.2) where the time constant 𝜏𝜏 is determined in calibration experiments.
Figure 2.1 A sorption calorimetric cell (figure from www.mah.se)
The activity of water is calculated from the thermal power of evaporated wa-ter regiswa-tered in vaporization chamber and a simplified equation can be pre-sented as 76:
𝑎𝑎𝑤𝑤= 1 −𝑃𝑃𝑚𝑚𝑚𝑚𝑚𝑚𝑃𝑃 (2.3)
is determined by electrical calibration. Since the thermal power is changing with time, Tian’s equation is applied for calculation of the thermal power75:
29 The sorption calorimetric experiments are performed in a two-chamber calo-rimetric cell inserted in a double-twin microcalorimeter74. In the sorption
cal-orimetric measurements completely dry samples are required, i.e. the initial water activity and water content in the samples should be zero. Therefore, the sample drying process usually takes place in vacuum at room temperature in contact with 3Å molecular sieves for 24 – 48 hours directly prior to the ex-periment. The initial dry mass of the sample is usually in the range of 50-150 mg. The dry sample is placed in the upper (sorption) chamber and pure water is injected in the lower (vaporisation) chamber. Evaporated water diffuses through the tube that connects the upper and lower chambers of the calori-metric cell and is absorbed by the sample (Figure 2.1).
The thermal power P released or absorbed in the two chambers are calculated using calorimetric signal 𝑈𝑈 and the corresponding calibration coefficient 𝜀𝜀:
𝑃𝑃 = 𝑈𝑈𝜀𝜀 (2.1)
The calibration coefficient 𝜀𝜀 is determined by electrical calibration. Since the thermal power is changing with time, Tian’s equation is applied for calcula-tion of the thermal power75:
𝑃𝑃 = 𝜀𝜀 �𝑈𝑈 + 𝜏𝜏𝑑𝑑𝑑𝑑𝑑𝑑𝑑𝑑� (2.2) where the time constant 𝜏𝜏 is determined in calibration experiments.
Figure 2.1 A sorption calorimetric cell (figure from www.mah.se)
The activity of water is calculated from the thermal power of evaporated wa-ter regiswa-tered in vaporization chamber and a simplified equation can be pre-sented as 76:
𝑎𝑎𝑤𝑤= 1 −𝑃𝑃𝑚𝑚𝑚𝑚𝑚𝑚𝑃𝑃 (2.3)
(2.2) where the time constant
29 The sorption calorimetric experiments are performed in a two-chamber calo-rimetric cell inserted in a double-twin microcalorimeter74. In the sorption
cal-orimetric measurements completely dry samples are required, i.e. the initial water activity and water content in the samples should be zero. Therefore, the sample drying process usually takes place in vacuum at room temperature in contact with 3Å molecular sieves for 24 – 48 hours directly prior to the ex-periment. The initial dry mass of the sample is usually in the range of 50-150 mg. The dry sample is placed in the upper (sorption) chamber and pure water is injected in the lower (vaporisation) chamber. Evaporated water diffuses through the tube that connects the upper and lower chambers of the calori-metric cell and is absorbed by the sample (Figure 2.1).
The thermal power P released or absorbed in the two chambers are calculated using calorimetric signal 𝑈𝑈 and the corresponding calibration coefficient 𝜀𝜀:
𝑃𝑃 = 𝑈𝑈𝜀𝜀 (2.1)
The calibration coefficient 𝜀𝜀 is determined by electrical calibration. Since the thermal power is changing with time, Tian’s equation is applied for calcula-tion of the thermal power75:
𝑃𝑃 = 𝜀𝜀 �𝑈𝑈 + 𝜏𝜏𝑑𝑑𝑑𝑑𝑑𝑑𝑑𝑑� (2.2) where the time constant 𝜏𝜏 is determined in calibration experiments.
Figure 2.1 A sorption calorimetric cell (figure from www.mah.se)
The activity of water is calculated from the thermal power of evaporated wa-ter regiswa-tered in vaporization chamber and a simplified equation can be pre-sented as 76:
𝑎𝑎𝑤𝑤 = 1 −𝑃𝑃𝑚𝑚𝑚𝑚𝑚𝑚𝑃𝑃 (2.3)
is determined in calibration experiments.
Figure 2.1 A sorption calorimetric cell (left figure from www.mah.se)
The activity of water is calculated from the thermal power of evaporated water registered in vaporization chamber and a simplified equation can be presented as76:
Equations for Chapter2. Capital letters are more pronounced than in template file.
max
1
P
P
a
w=
−
(2.3) vap sorp vap w vap w mix wH
H
P
P
H
=
+
(2.4) (2.3)where P is the thermal power of vaporisation and Pmax is its maximum value. In practice, a more complicated equation is used for calculations76.
The partial molar enthalpy of the mixing of water (often referred to as the enthalpy of hydration) is calculated using the following equation: