Waste flow mapping : Handbook
28
0
0
Full text
(2) Printed by AJ E-print AB ISBN: 978-91-7485-339-1 © Copyright: This book may be used and reproduced without charge if it is unchanged, copied in full, and this copyright note remains unchanged. Full rights and ownership of the material is claimed collectively by the authors and their organizations: Martin Kurdve Sasha Shahbazi Marcus Wendin Cecilia Bengtsson Magnus Wiktorsson Pernilla Amprazis Layout: Anna Sandberg and Moa Önell The picture at the front is copyrighted by Mälardalen University The editing of the book has been funded by XPRES and by Mistra foundation through the project Material efficiency management in manufacturing (MEMIMAN) in the program closing the loop. This handbook can be referenced to as: Kurdve, M., Shahbazi, S., Wendin, M., Bengtsson, C., Wiktorsson, M. & Amprazis, P. (2017). Waste Flow Mapping: Handbook (eng). ISBN 978-91-7485-339-1, Mälardalen University, Eskilstuna, Sweden..
(3) Summary INDUSTRIAL WASTE MANAGEMENT involves several actors and personnel from different organizations; this together with the fact that material waste management may be of less operational importance than producing the main product, means that even effective and environmentally aware companies usually have improvement opportunities in waste management. A major challenge is to develop methods that support participation, visualization, and integration of operational environmental management. THIS HANDBOOK presents methods for use in manufacturing industries who wants to minimize waste and improve waste management system. The methods were developed during the Mistra funded project MEMIMAN within the “Closing the Loop” program during 2012 to 2015. THE MAIN METHOD “Waste Flow Mapping” or “WFM”, is an analysis method joining several common tools. Some of these tools are then further described separately as ways to work with continous material management improvement in the industry. THE MAIN PURPOSE of the WFM method is to provide a framework for identifying and analyzing potentials for waste management and material efficiency in manufacturing industry, including residual material values of metals, combustible and inert waste, process fluids and other hazardous waste. Waste Flow Mapping combines lean and green principles and tools e.g. Value Stream Mapping (VSM), Eco-mapping and a Waste composition analysis to imply the business improvement potentials. WFM analyses the unwanted material output in order to find efficiency losses upstream, increase the value regained from residuals and ultimately reduce unnecessary input. WFM focuses on analysis of the material waste management supply chain and especially on the interface between. the waste management and the production management since this is crucial for the rest of the waste management process. AS A CONSEQUENCE, the Waste Flow Mapping (WFM) method is useful for waste management researchers and different actors operating or managing waste handling activities, e.g. waste managers, environmental coordinators, purchasers of waste services, line managers, improvement experts and waste management service suppliers. The WFM’s framework relies on existing and well proven tools and methods to analyse the current state and find improvement potentials with regards to material losses and inefficiencies in the handling of materials and waste. The experience from using the WFM method shows benefits like: • • • • •. Systematic problem solving. Performance can be analysed by easy traceable KPI:s. Supports team efforts, communication and engagement. Possible to standardise. Supports requirements in ISO14001 such as involvement of everyone and pro-activeness.. The Waste Flow Mapping Handbook 3.
(4) Content. Introduction 5 We need to utilise resources better . 6. WFM context and characteristics . 8. Why Waste Flow Mapping? . 10. How to perform the WFM in 8 steps . 11. The Waste Flow Mapping framework . 12. WFM limitation and specifics . 18. A. Waste hierarchy . 20. B. Material sorting analysis . 21. C. Eco-mapping 22 D. Material handling analysis . 23. E. Environmental value stream mapping . 24. F. Green performance map . 25. Selected bibliography 26. 4 The Waste Flow Mapping Handbook.
(5) Introduction PROFESSIONAL WORK WITH MATERIAL EFFICIENCY and waste management involves people with different point of view, particularly regarding natural resource consumption and recycling. However the waste hierarchy, is accepted broadly as a prioritization tool to handle waste. IN RECENT YEARS, a “green, lean” mindset has been established that improvement of environmental issues should be delegated from the environmental organization to the operative personnell. The updates of the environmental management system standard ISO14001 are in line with this trend. This handbook introduces Waste Flow Mapping, and a systematic collection of tools and practices that can be used by operative personnel with support from the environmental organization to improve material efficiency and waste management efficiency. THE FACTS that waste management may be of less operational importance than producing the main products, while at the same time the interface between production management and waste management is crucial for the effectivity of the waste management process and material efficiency, poses a major challenge. Another obstacle is that the waste management process involves several actors and personnel from different organizations. Even effective and environmentally aware companies often have challenges in communicating common goals and targets for material efficiency. Substantial opportunities exists in development of methods that supports participation, visualization, and integration into existing waste management practice.. TO ACHIEVE material efficiency it is important to reduce the amount of spill and unnecessary use of raw material. Still when material ends up as waste, the efficiency is improved by climbing higher on the five step waste hierarchy. The higher the level in the hierarchy, the higher is the value of the output material. Hence, the approach will include also moving the Non Productive Output material, or material waste, to higher stages in the waste hierarchy. BASED ON THIS BACKGROUND, a research project, funded by Mistra, has investigated material efficiency management within manufacturing industries. The industrial partners include Volvo Group, Stena Recycling, Dynamate/ Scania and Alfa Laval. The academic partners are Mälardalen University, Lund University, the research institute Swerea IVF and the Consultancy company Miljögiraff. The project has delivered both scientific publications and industrial methods in order to tackle environmental issues in manufacturing industries. 6 FACTS ABOUT THE WASTE FLOW MAPPING METHOD • It identifies potentials of improving waste management. • It is based on case studies at more than 20 manufacturing sites in Sweden. • Large potentials are found in cost and environment at the sites. • Industrial waste management often involves several actors and organizations. • The method integrates lean thinking and environmental management. • Visualization, ease of use and integration of current practice are the keys.. The Waste Flow Mapping Handbook 5.
(6) We need to utilise natural resources better MANUFACTURING INDUSTRIES play an important role in developing a resource-efficient and low-carbon economy. Globalisation, industrialisation, and economic development has led to increased product demand and manufacturing activities – we have seen a 35% increase of global manufacturing activities over 2001-2010 while the global GDP increased by only 26%. The increase lead to larger volumes of industrial waste and larger depletion of natural resources. Extraction and processing of virgin material is energy demanding which with combustion of fossil based waste material directly affects greenhouse gases and the climate. SUSTAINABLE DEVELOPMENT is one of the most important challenges of the future that we all have to work with to protect the future climate changing and environment. Most companies’ nowdays embrace visions in line with sustainable development. With an ever- growing consumption demand and upcoming shortages of resources, material efficiency is an important part of manufacturing companies’ operational strategies. Several companies meet this challenge by radical program of resource efficiency. For example, Toyota has established five “Sustainable Plants” and Unilever has aimed to quadruple its resource efficiency in ten years. We see the same trends in Swedish companies where the resource efficiency continuously is enhanced. The Swedish foundation for strategic environmental research, Mistra, has pointed out the importance of more circular economy for Swedish industry in the report “Closing the loop: From Waste to Resource” in December 2011.. IN THE PAST 20 YEARS, industrial waste has become a critical issue and causes concerns with regards to global sustainability and environmental effects. In 2012, the total waste generated by households and economic activities in Europe amounted to 2.4 billion tons, 11% (270 million tons) of which was contributed by the manufacturing sector. The total waste generated by households and economic activities in Sweden in 2012 amounted to 156 million tons, of which the manufacturing industry contributed 6.2 million tons, or approximately 4%1. Excluding the mining industry, only 47% of non-hazardous material was recycled in 2012. The amount of waste incineration has increased since 2010, primarily due to increased burning of mixed industrial and imported waste2. SWEDISH MANUFACTURING COMPANIES, with its 550 000 employees account for a significant share of Swedish exports and GDP – and a significant environmental impact. Several Swedish companies have worked with environmental and sustainability issues for a long time, with environmental policies certified by ISO 14001. However, more efforts are required to broaden commitment and create conditions to participate actively in environmental improvement work. This manual describes some tools to use in order to increase the pace of change and commitment regarding material efficiency.. 1 European Commission. 2015. Waste statistics. Available at http://ec.europa.eu/eurostat/statistics-explained/index. php/Waste_statistics 2 Naturvårdsverket. 2014. Waste statistics in Sweden. Available at http://www.naturvardsverket.se/ 6 The Waste Flow Mapping Handbook.
(7) 120 120 110 100 90. 60. 80 49. 70 60 50 40 30. 6. 20 10. 6. 7. 2000. 2013. 1,6. 0. 1900. Population (billion ppl). 9. 2050. Global resource consumption (billion tonnes). 14. 90. Bn US$. 80. 12. 70. 10. 60 50. 8. 40. 6. 30. Milion tonnes. Figure 1 Increase in global resource consumption (Shahbazi et al., 2016).. 4. 20. 2. 10 0. 0 2004. 2005. 2006. 2007. 2008. Economic activity in Manufacturing. 2009. 2010. 2011. 2012. Total waste in Manufacturing. Figure 2 The development of the total waste in manufacturing (Shahbazi, 2015).. The Waste Flow Mapping Handbook 7.
(8) WFM context and characteristics THIS APPROACH uses a lean production viewpoint, applied on residual material flows in manufacturing. Minimising non-value adding activities and material use at the source is a fundament in the presented WFM method. One complexity in waste management is the multitude of stakeholders and multiple steps in the waste handling process. This implies the importance of synchronising actors’ responsibilities and performance measures. In general the value of the potential improvements are worth more than ten times the cost of time spent on mapping which is in line with other analyses of potential operational improvements. LEAN PRODUCTION is by far the most successful production concept for the industry to achieve the desired productive outcome, ie to supply products with good quality of benefit to the client - and with limited (economic) resources. Lean manufacturing principles and tools have proven fruitful in engaging all employees in improvement activities and picking up new challenges. Our view is that environmental and sustainability issues in general should be a natural part of the companies’ ongoing commitment to improve their efficiency. There are opportunities to increase the pace of environmental work by taking advantage of the existing internal Lean organizations and processes. Environmental improvement work can be incorporated into the structure of planned kaizen exercises and system for daily management. A GENERAL LEAN IMPROVEMENT SYSTEM can be seen as consisting of a management system of rules and principles, improvement methods and a performance monitoring system, all operating on the socio-technical production system. The tools and methods has to be aligned with the principles and policies of the company and the performance in each area addressed need to be monitored. Tools and methods usually have two types of objectives, either to 8 The Waste Flow Mapping Handbook. analyse the current state of an operation in order to identify and set priority on challenges, or act as a framework to support implementation of a skill or a practice in order to change, in line with a certain challenge, e.g., 5S, SOP, waste sorting standards. Waste Flow Mapping is mainly a tool for analysis. IN ORDER TO MINIMISE the environmental impact from production, Green Lean is a preferred approach for realizing environmental opportunities. For environmental work in industry, methods need to be based on lean principles, harmonize with ISO 14001, support proactivity, deliver a structured work practice and enable performance measurement. In the development of other green lean tools it has been clear that ‘visualization’ and ‘comprehensibility are important characteristics but also ‘systematic’, ‘hands-on’, and ‘quick’ are identified as critical features. TO ALIGN TOOLS AND METHODS to Green Lean principles, design criteria can be formulated. The main design criteria used in the development of Waste Flow Mapping are: • • • • •. Analysis methods need to ensure a holistic (economic and ecologic) picture. “Go to gemba” – go and see, is important for root cause problem solving. The methods need to be easy to use and be time-efficient. The analysis output should be visual and enhance communication. The analysis is performed as teamwork to support collaboration.. These features or criteria on the tools are common with all green and lean tools. Waste Flow Mapping combines several green lean tools and principles in order to meet the demands..
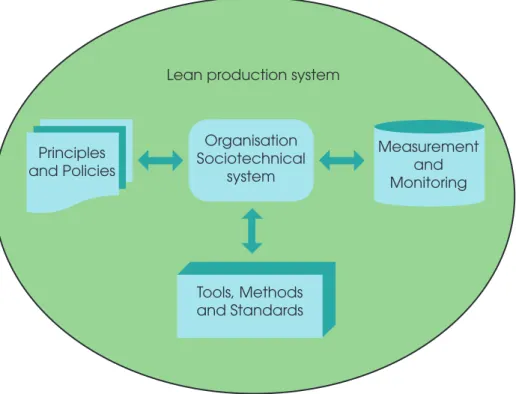
(9) Lean production system. Principles and Policies. Organisation Sociotechnical system. Measurement and Monitoring. Tools, Methods and Standards. Figure 3 A lean improvement system or company production system needs a rulebase with principles and policies, improvement methods and tools and performance monitoring. Waste flow mapping provides principles, a toolbox and measurements to improve material efficieny. (Kurdve 2014). The Waste Flow Mapping Handbook 9.
(10) Why Waste Flow Mapping? THE GOAL is to use the method in order to increase understanding of material efficiency through all involved organizations. WHEN TRYING TO MAKE the overall operation lean, focus on minimising use and handling of non-value-added (NVA) and non-productive (NPO) material. In practical improvement work, these different inefficiencies are addressed simultaneously. First analyse the overall material efficiency, then analyse waste management subprocess efficiency. IN ORDER TO WORK successfully with waste management and material efficiency, a common understanding of the economic and environmental value of the material and waste handling processes is important for all concerned parties. In order to create a common view, all concerned parties should be taken into account in an analysis of the current state. An agreement of the current state and opportunities to improve, enables the forming of a vision for the future, as well as taking improvement actions. MATERIAL AND WASTE MANAGEMENT is an issue that spans over a number of company departments and functions. Different organisational parties (such as operation, maintenance, cleaning and facility management) as well as various companies in the waste handling supply chain are all involved in material and waste management. Therefore, it is important that methods and tools are easy to use, visual, time efficient and that the analysis output is easy to understand for everyone involved. THE WASTE FLOW MAPPING FRAMEWORK is synthesised with preparation based on Environmental Management System (EMS) data and waste statistics, followed by the use of Eco-mapping and waste sorting analysis on site,. 10 The Waste Flow Mapping Handbook. with final interviews of stakeholders and analysis of inefficiencies and material losses from waste. BY USING THE WFM APPROACH, the mapping can be done in an efficient and consistent manner, revealing value losses and improvement potentials. Establishing clear fraction segment definitions is essential in order to realise cost efficiency and achieve a more sustainable footprint. Comparisons between sites show that by simple actions, substantial improvements in recycling efficiency can be made, leading to proposed performance indicators and highlighting the need for established standardized implementation solutions. The results further emphasize the importance of avoiding mixing materials with lower quality grade of the same material.. Energy. Emissions (air/noise). Value adding material. Product. Process material. Residual material. Water. Emissions (land/water). Figure 4 Green Performance Map with material focus..
(11) How to perform the WFM in 8 steps Compile a team, including all actors involved in waste management at the site in question, and commence the waste flow mapping by, ideally, the following systematic steps:. STEP 1. Collect data on volumes and costs of all fractions. These can be summarised from EMS-data and existing waste management data. Contact all relevant actors to inform of the commencement of the waste flow mapping.. STEP 2. Create a map of waste generation points and collection points on site (fractions, content in each fraction, bins, containers and equipment, type and size, cost of maintenance, rent, operator time, internal and external cost). Photograph the different types of operations and their waste fractions. Count deviations against the standard. Possibly do sorting analysis in bins/containers, to identify cause of the waste.. STEP 3. Create a map of internal logistics. Interview all involved actors on site (man-time, shifts and transportation equipment, internal and external costs).. STEP 4. Interview all actors and map the information management and improvement system.. STEP 5. Perform an analysis on the data on transportation and final treatment for each fraction. Analyse the pick-up rate and frequency for each fraction, make comparisons to the number of containers, mode of transportation and length of transportation.. STEP 6. Perform an analysis on material efficiency and sorting degrees. Create a graphic analysis of each segment in accordance with the waste hierarchy. Compare the results with the goals and responsibilities mapped out in the initial analysis of the parties and actors concerned.. STEP 7. Perform an analysis of interviews and compare the actor goals against the operative performance for each sub-process on segment level.. STEP 8. Identify gaps and best practice for segments and subprocesses. Find the root causes for any deviations.. The Waste Flow Mapping Handbook 11.
(12) The Waste Flow Mapping framework 1 2. PHASE 1: PREPARATION AND MAPPING OF WASTE GENERATION AND FRACTIONS ON-SITE Before the on-site analysis prepare by checking data on volumes, fractions and possibly costs/revenue, external services, transportation mode and final treatment collected centrally from EMS and waste management reports. Remember to keep a systems viewpoint of the material flow. Do an Eco-map for waste, and collect data in each sub-process, regarding resources, inventories, handling and movements. The internal collection points are mapped using eco-mapping or tables and layouts including the required data on number of bins (points), what fraction and what type of bin. Photograph both good examples and deviations from standard. Man-time data for maintaining bins and signs is collected together with cost of ownership or renting cost for the bins. Inefficiencies in the main operation due to waste handling can be estimated. If needed, do sorting analysis in bins/containers, analyse amount not sorted and identify what input caused the waste.. 3 4. Internal logistics, moving the waste material from all points in the operations to collection points for external waste handlers is mapped. Interview all involved on-site actors. Man-time data and data on moving equipment and costs are collected or estimated. The layouts of containers and equipment to separate or sort waste and maintenance and cost of ownership or renting cost for containers are mapped into the eco-map. The information management, improvement and collaboration between internal and external actors is collected by interviews and data records, as well as documents from the improvement process and process efficiency data. This information can be used in order to steer the main processes into minimising material losses (avoid generation and hazardousness of waste). The efficiency of the information system and improvement work is estimated based on the overall efficiency of the process itself.. 12 The Waste Flow Mapping Handbook.
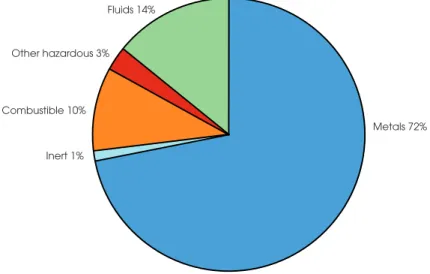
(13) Figure 5 Draw the waste-ecomap on a layout of the production (Kurdve, Romvall et al. 2011).. Fluids 14%. Other hazardous 3%. Combustible 10% Metals 72% Inert 1%. Figure 6 Waste volumes in different segments.. The Waste Flow Mapping Handbook 13.
(14) The Waste Flow Mapping framework 5. 6. PHASE 2: HORIZONTAL PERFORMANCE ANALYSIS – OVERALL MATERIAL EFFICIENCY FOR EACH SEGMENT External transportation and final treatment can be mapped off-site with waste management data or from full LCA data on final treatment, and should include analyzis of the type of and cost of transportation and treatment for each material fraction (or at least segment), what type of disposal or recycling code, cost and location of that process. Analyse material efficiency and sorting degrees. Graphically analyse each segment in accordance to the waste hierarchy. Compare results with goals and responsibilities in actor analysis. In order to understand the material flows ending up as waste and set relevant KPIs for improvements, group the waste types into segments e.g: • Metals • Fluid waste • Combustible material • Other Hazardous waste • Inert materials The number of segments may vary depending on the industrial operations and the materials used. For each segment except ‘Other Hazardous waste’, one or several of the fractions can be considered as a “mixed” fraction (with lower value and quality). In general there is higher cost/lower revenue of the waste for the mixed fractions compared to the pure ones that often regain a larger portion of the original material value. The material efficiency can be calculated by the total product weight and the total waste weight which often is a valid approximation. Material efficiency (%) = product weight/ incoming material weight ≈ product weight /(waste weight + product weight). Measurement for control of the overall waste management process has to be done. Legal and environmental management standards require monitoring of total amounts of hazadrdous and non-hazardous waste as well as the total (external) cost for handling of these. The manufacturing plants usually index these performance measures per produced unit (P). However, performance should also be monitored for each segment separately (Figure 7). In addition to the weight and cost per produced unit, the average cost (or revenue) per ton for sorted and for mixed waste as well as the sorting degree in each of the segments should be monitored to steer improvement actions.. 14 The Waste Flow Mapping Handbook.
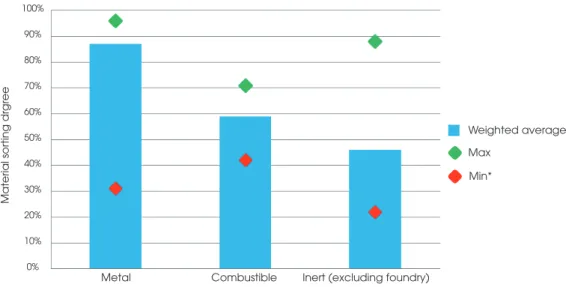
(15) Proposed segment indexes. Calculation. Sorting degree. W (sorted)/ W (segment total). (%). Weight per produced unit. W (segment total)/P. (ton/#). Cost per produced unit. C (segment total)/P. Average segment treatment cost. C (segment total)/ W (segment total). (SEK/ton). Horizontal KPIs for each of the five segments Figure 7 Proposed segment performance measurement (Kurdve, Shahbazi et al 2015).. 100% 90%. Material sorting drgree. 80% 70% 60%. Weighted average. 50%. Max. 40%. Min* 30% 20% 10% 0%. Metal. Combustible. Inert (excluding foundry). Figure 8 The figure illustrates the minimum, maximum and average sorting degree for nonhazardous waste in a case study of >10 plants, showing clearly that some plants (red) have a great improvement potential (green = best practice plants) (Kurdve, Shahbazi et al 2015).. The Waste Flow Mapping Handbook 15.
(16) The Waste Flow Mapping framework 7 8. PHASE 3: VERTICAL ANALYSIS SUB-PROCESS EFFICIENCY AND OVERALL BEST-PRACTICE ANALYSIS In order to evaluate the services supplied from each subprocess, performance measures for each of the services can be analysed against actor goals, The evaluation should reflect the effectiveness and quality of the supplied service in quantitative and /or qualitative analysis. By analysing several plants and evaluating the sorting degree and average treatment cost in each waste segment, gaps and best practice with regards to waste segments can be found. It may be important to break down costs in order to prove that costs of infrastructure and logistics are not increased instead. The performance measurements of the different plants with regards to the sorting degree and cost or revenue for the waste fraction for each segment, can be used to find potential improvements for each segment. Use historical data on sorting degree and segment cost to evaluate improvement work. For plants operating the waste management with their own staff, the service efficiency and overall effectiveness are the most useful quantitative measurements for subprocess efficiency as illustrated in Figure 8. When the service is provided from a supplier, the cost efficiency is the most relevant measure for the supplier delivery. Potential waste management process improvements on plant level can be found in all five subprocesses for example: • underused bins • poor quality of information management • lack of bins for some waste fractions • container and equipment inefficiency • lack of and poor quality of signs and instructions • inefficiencies and unnecessary costs of external transports • inefficiencies in handling and internal logistics • inefficiencies in choice of final treatment The improvement process itself should be analysed. In general the improvement work benefits from getting a better information support with performance data on production department level. Several inefficiencies related to loss of information and/or delay of information indicates insufficient interface between waste management and operation management. From environmental point of view, when proper LCA data is unavailable, the economical potentials may give an sufficient approximation. For example, the potentials of shortening transports show both economic and environmental potential benefits or the potential of sending metals as higher quality grade in general give economical as well as environmental potential improvements.. 16 The Waste Flow Mapping Handbook.
(17) Bins. Internal handling. Ext. collection points. Ext. transportation. Ext. treatment. Service efficiency. # (bins)/ W (waste in bins). Man-h/W. # (containers)/ W (waste in containers). # (trucks)/ W (waste transported). W (recycled)/ W (sum) (sum) & W (incinerated)/ W (sum). Cost efficiency. C (bins)/ W (waste in bins). C (man-)/W. C (equipment)/ W (waste in equipment). C (transports)/ W (waste transported). C (treatment)/ W (sum). Overall effectiveness. C (bins)/P. C (man-h)/P. C (equipment)/ P. C (trucks)/ W (waste transported). C (treatment)/P. Workplace: bins/signs. Internal handling. Collection points. Transport. Final treatment. Figure 9 Sub process performance measurements (Kurdve, Shahbazi et al 2015).. The Waste Flow Mapping Handbook 17.
(18) WFM limitation and specifics THE WFM APPROACH supports analysis and continuous improvement work for the waste management process. It is designed to be time-efficient, easy and understandable for the practitioners. ‘5Why’ is suggested as a simple way to catch most of the root causes of the inefficiencies found. The cost of area needed for bins is omitted; it may still be important to keep down the size of the bins for several reasons. ESTABLISHING GENERAL BEST PRACTICES requires implementation with clear and relevant goals for all actors. The best practice could also be designed into supplied services. It is important to integrate waste management with operations management and follow up performance on a regular basis. As a further development, it is suggested to develop a system for updating and monitoring of performance for each actor. However, there is also need for development of local continuous support tools for the management. Since actors have different drivers (e.g. economic, environmental, use of resources, efficiency), for different levels in the organization, a service concept could be a lean approach to handle waste management.. 18 The Waste Flow Mapping Handbook. UNDERSTANDING THE VALUES of materials and costs for waste handling and treatment, gives a clear guidance to efficient operations. Experiences prove that Waste Flow Mapping is a suitable framework, for analysing the waste management process and to efficiently identify sustainability improvement potentials. To group different waste fractions into segments and analyse these segments individually is necessary to identify Best Practice for the different segments. It is crucial to avoid mixed material with lower quality grade of that material. The proposed performance measurements support management control. WASTE FLOW MAPPING to set common grounds for all involved WFM is a method that can be used to support material management improvements in all types of companies. TO DISCUSS 1. Who is involved in waste management work at your company? 2. What are the responsibilities and functions? 3. How do you measure material efficiency performance?.
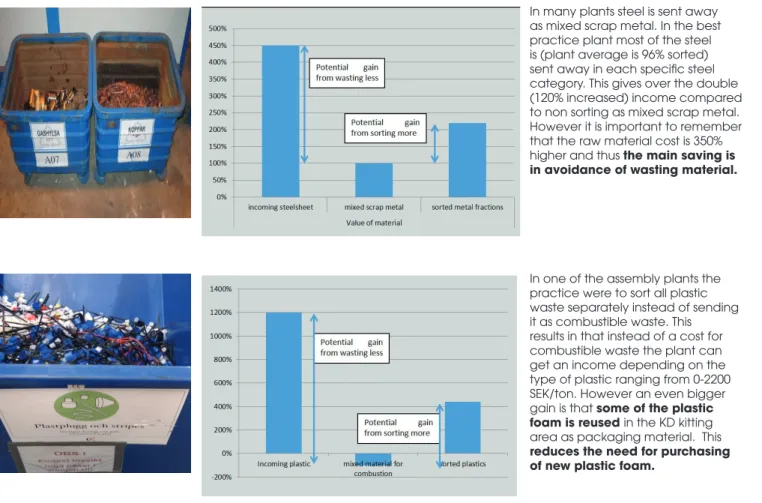
(19) In many plants steel is sent away as mixed scrap metal. In the best practice plant most of the steel is (plant average is 96% sorted) sent away in each specific steel category. This gives over the double (120% increased) income compared to non sorting as mixed scrap metal. However it is important to remember that the raw material cost is 350% higher and thus the main saving is in avoidance of wasting material.. In one of the assembly plants the practice were to sort all plastic waste separately instead of sending it as combustible waste. This results in that instead of a cost for combustible waste the plant can get an income depending on the type of plastic ranging from 0-2200 SEK/ton. However an even bigger gain is that some of the plastic foam is reused in the KD kitting area as packaging material. This reduces the need for purchasing of new plastic foam.. Figure 10 Best practice analysis examples Improved sorting and quality management of scrap metals had a large potential to increase income. Recycling of combustible waste (mainly from packaging material) is a way of turning costs into income by very simple means (Kurdve, Shahbazi et al 2015).. The Waste Flow Mapping Handbook 19.
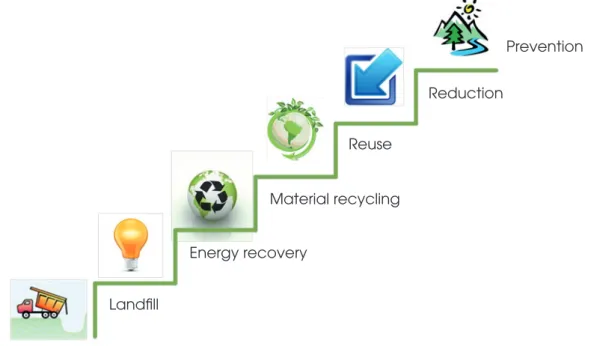
(20) A. Waste hierarchy A PRINCIPLE OF INCREASING MATERIAL and overall operational efficiency has been formulated in the waste hierarchy. The waste hierarchy conclude the prioritizing of good material management for residual material. The most desirable is, of course, to prevent the waste to occur in the first place. Reduction of material use is better than reuse of components which in turn is better than material recycling which is better than energy recovery treatment, deposition of waste in landfill and all is of course better than spreading it out in the environment. The hierarchy is generally valid from both environmental and business point of view as well as it is in line with the EU waste hierarchy.. THE HIERARCHY has sometimes been questioned by practitioners since the different treatment processes’ environmental impacts are unknown or underestimated further up in the supply chain. However the hierarchy is valid in almost all cases with exception for some special cases when the recycling and transport processes requires more material and energy than what is exploited by using virgin material.. Prevention Reduction Reuse Material recycling Energy recovery Landfill. Figure A The waste hierarchy (Kurdve et al., 2011).. 20 The Waste Flow Mapping Handbook.
(21) B. Material sorting analysis IN ORDER TO ANALYSE the content and composition of waste material, waste sorting is an important tool for assessment and system analysis of industrial waste management. Through waste sorting analysis, the homogeneous quality of industrial waste bins is measured by weighing and differentiating the wasted material. The waste contained inside each bin is weighed to calculate the proportions of different material fractions.. ONE WAY TO USE SORTING ANALYSIS on operation level is for reduction of waste generation. This is by identifying each type of wasted item and where it comes from. Then improvement strategies or guidelines are applied.. Figure B Material sorting analysis.. The Waste Flow Mapping Handbook 21.
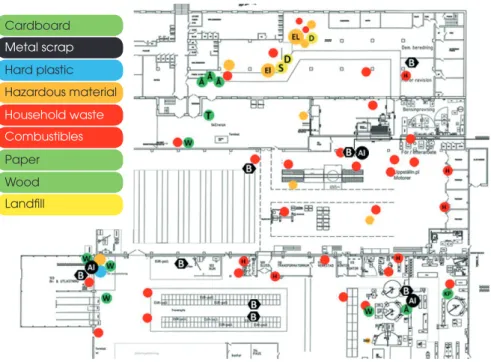
(22) C. Eco-mapping ECO-MAPPING IS A VISUAL TOOL used to point out environmental aspects on a map or layout. It was developed by INEM (The International Network for Environmental Management) as a tool for initial environmental review for small and medium sized companies. It is often used to map several types of environmental aspects but for this study the eco-mapping is limited to waste generation and material waste handling activities. It is regarded as simple to use and to understand by non-experts. It is widely used in a variety of applications to identify and visualize the geographical points where the different operations occur.. Cardboard Metal scrap Hard plastic Hazardous material Household waste Combustibles Paper Wood Landfill. Figure C Example on an eco-map of waste generation points.. 22 The Waste Flow Mapping Handbook.
(23) D. Material handling analysis IT IS IMPORTANT to include material handling; collection, storage and transportation and container handling, in the analysis of waste management. Material Handling Analysis is a visual tool for analysing and optimising internal and external logistics which in its simplest form it comes down to a spaghetti chart analysis. In lack of graphical data the waste material handling activities and their costs i.e. tools, activities and machines that helps material handling, need to be listed.. Transport. Nu. Ny. Transport from PL01 to inventory (red). 56. 0. Transport from inventory to PL02 (orange). 7.5. 0. Transport from PL02 to corner (pink). 20. 13. Transport from inventory to PL04 (purple). 47.5. 6. Transport from PL04 to corner (yellow). 2. 2. Transport from inventory to PL05 (blue). 13. 5. Transport from PL05 to corner (green). 29. 10. Total. 175. 36. Figure D Material handling analysis.. The Waste Flow Mapping Handbook 23.
(24) E. Environmental value stream mapping VALUE STREAM MAPPING (VSM) is used to find operational inefficiencies in a process. A VSM can be drawn for the whole supply chain, a process or a single sub-process. When analysing a single operation cell the VSM analysis will be similar to a Standard Operation Procedure (SOP) and inefficiencies may be analysed by drawing spaghetti charts of real movements and comparing them to the SOP.. Production Control. Forecasts Raw material supplier. The VSM can be used in a non-detailed way, to analyse processes and sub-processes to visualise improvement potentials. An extension to the regular VSM is to include environmental or resource efficiency losses schematically shown in Figure E. It can be used to map both product material and process material use for different processes.. Quarterly Forecasts. POs. Customer. Monthly PO Weekly Schedule. Cut Oil. Water. Alum. Water. Elec. Compr Air. Elec. Operation 1. Operation 2. 54. Paint. Compr Air. Elec. Elec. Elec. Operation 3. Operation 4. Inspection/ Shipping. 6. 12. 6. Used Cut Oil Alum Chips Elec. Time. Waste Water Elec. 648 sec 5 sec. Energy. Alum chips-lb/pc Cutting oil-gal/month. Air Leaks. Waste Paint. Elec 72 sec. 13 sec kWh. kWh. Consumables. Waste Water. Elec 144 sec. 8 sec kWh. Air Leaks Elec Lead Time = 13 min. 72 sec 20 sec. kWh. 3 sec. Value Addes Time = 49 sec Energy = kWh/pc. kWh. kWh. kWh. kWh. kWh. Water-gal/month. Air-ft’/month. Paint-gal/month Water-gal/month. Air-ft’/Month. Figure E Value Stream Map including environmental wastes. Redrawn from EPA (2009) “Lean and chemicals toolkit” p.22 available at: https://www.epa.gov/sites/production/files/2013-10/documents/lean-and-chemicals-toolkit.pdf. 24 The Waste Flow Mapping Handbook.
(25) F. Green performance map GREEN PERFORMANCE MAP (GPM) is an input-output visual green-lean tool developed to enhance understanding of environmental aspects in operations. This study focuses on material input and waste output. In this model the material output of a manufacturing process is divided in: Productive Output (PO) regarded as value adding and Non Productive Output (NPO) such as material residuals or material waste that is non-value adding. The input to these processes can be divided into value adding production material that constitutes the product, and process material, everything else needed for the manufacturing process.. Compressed air Steel coil. Energy. Cooling system. Phosphate Painting powder. GPM IS AN EASY-TO-USE and visualize tool to utilize even for a non-environmental experts. It is also easy to put up a pre-GPM in the A3 format paintings out in the field and in the office environment. Management and production interact to constantly develop a competitive production system. By the usual PlanDo-Check-Act cycle (PDCA) a continuous improvement is established that stimulates small and large leap in production development. Important to note is that GPM should be used as communicative tool in continous improvement work, not as a one-time effort.. Energy for dry & oven. Emissions (air/noise) Noise Beam. Product. Value adding material Process material. Blasting material. Painting powder. Lubricants. Residual material Steel tape. Hydraulic system oil. Process water. Water. Metal scrap. Combustible waste. Emissions (land/water). Figure F Green Performance Map. Background from Green Performance Map - Handbok, Mälardalens högskola ISBN-nr. 978-91-7485-080-2.. The Waste Flow Mapping Handbook 25.
(26) Selected bibliography Bellgran, M., Höckerdal, K., Kurdve, M., Wiktorsson, M., 2012. Green Performance Map - Handbook, Eskilstuna, Sweden. European Commission. 2015. Waste statistics. Available at http://ec.europa.eu/eurostat/statistics-explained/index.php/Waste_statistics Kurdve, M., 2014. Development of collaborative green lean production systems. 2014. PhD thesis in Innovation, Design and Engineering. Mälardalen University, Sweden. Kurdve, M., Romvall, K., Bellgran, M., Torstensson, E., 2011. A systematic approach for identifying lean and green improvements related to packaging material in assembly. Swedish Production Symposium (SPS11). Lund Sweden. Kurdve, M., Shahbazi, S., Wendin, M., Bengtsson, C., Wiktorsson, M., 2015. Waste flow mapping to improve sustainability of waste management: A case study approach, Journal of Cleaner Production, Volume 98, Pages 304-315. Kurdve, M., Wiktorsson, M., 2013. Green performance map: visualizing environmental KPI’s, European Operations Management Association (EurOMA). Kurdve, M., Zackrisson, M., Wiktorsson, M., Harlin, U., 2012. Lean and Green integration into production system models – Experiences from Swedish industry, Swedish Production Symposium (SPS12), Linköping, Sweden. Naturvårdsverket. 2014. Waste statistics in Sweden. Available at http://www.naturvardsverket.se/ Romvall, K., Kurdve, M., Bellgran, M., Wictorsson, J., 2011. Green Performance Map – An Industrial Tool for Enhancing Environmental Improvements within a Production System Globalized Solutions for Sustainability in Manufacturing, in: Hesselbach, J., Herrmann, C. (Eds.). Springer Berlin Heidelberg, pp. 353-358. Shahbazi, S., 2015. Material efficiency management in manufacturing, Licentiate thesis in Innovation, Design and Engineering. Mälardalen University, Sweden. Shahbazi, S. & Amprazis, P., 2017. Improve material efficiency through an assessment and mapping tool. The International Sustainable Development Research Society (ISDRS). Bogotá, Colombia. Shahbazi, S., Kurdve, M., 2014. Material efficiency in manufacturing, Swedish Production Symposium (SPS14), Gothenburg, Sweden. Shahbazi, S., Wiktorsson, M., Kurdve, M., Jönsson, C., Bjelkemyr, M., 2016. Material efficiency in manufacturing: Swedish evidence on potential, barriers and strategies, Journal of Cleaner Production, Volume 127, pages 438-450. 26 The Waste Flow Mapping Handbook.
(27)
(28) Adress: Box 883, 721 23 Västerås Adress: Box 325, 631 05 Eskilstuna Telefon: 021-10 13 00 E-post: info@mdh.se Webb: www.mdh.se.
(29)
Figure


+7


Related documents
The purposes of the paper are to analyze whether moral motives matter for: a the assessment of households' waste sorting costs; and b for the efficiency of introducing
While the Basura Cero law is focused primarily on the environmental issues of waste management in Buenos Aires, the inclusion of the cartoneros in this law might result in intended
In addition to trying to address these question by acting as a sort of “show room” for waste management processes, the station aims to intervene in processes transforming reusable
In conclusion, the research has presented an overall view on the use of visual data representation to persuade human behavior, based on the study case at Sala municipality
The system is designed for collecting three different waste fractions, organic waste, combustible waste, and newspapers and for handling waste from 2100 households
The storing of the food can be divided in three parts, make food last longer, plan the meals and shopping and keep track on the food we have.. The final result is the smart
It can be discussed if subjects who consult for chest pain have a higher risk of
I denna avhandling analyserar Martin Qvist hur detta sysselsättningspolitiska ideal kommer till uttryck i styrningen av lokala integrationsprogram inom det svenska
