2 Project
NORDUST – Nordic Road Dust Project
Report number
2019-01
Date
2019-11-01
Project manager
Karl-Idar Gjerstad, Statens vegvesen
Financial partners
Statens vegvesen, Trafikverket, Liikennevirasto, Vegagerdin
Members of the project group
Mats Gustafsson, Göran Blomqvist, Bruce Denby, Max Elmgren, Henrik Grythe, Sara Janhäll, Ida Järlskog, Christer Johansson, Sami Kulovuori, Kaarle Kupiainen, Joacim Lundberg, Aleksi Malinen, Michael Norman, Roosa Ritola, Sanna Silvergren, Ana Stojiljkovic, Ingrid Sundvor, Þröstur Þorsteinsson, Martina Stefani, Matthias Vogt
Scientific partners
VTI, Metropolia, Nordic Envicon Oy, SYKE, SLB-analys, NILU, Met Norway, University of Iceland
Report title NORDUST – Nordic Road Dust Project
Road dust is an important contributor to airborne particle pollution, especially in the Nordic countries where high road sur-face wear, due to studded tyre use as well as winter maintenance and operations including sanding and salting are important contributors. Even though the road dust problems are similar, the countries have tackled different parts of the problem with different research approaches, resulting in a complex knowledgebase in need of compilation. A former project, NORTRIP, started this work and implemented the knowledge into an emission model with a specially elaborated road dust focus. The model work has been used to identify knowledge gaps, intended to be filled within the NorDust project. Laboratory tests and controlled and uncontrolled field measurements as well as parametrisation and modelling has been used as tools to find, de-scribe and implement issues concerning road dust formation, suspension and dynamics and road operation effects on emis-sions in facilities and sites in Finland and Sweden. The NORTRIP model has been implemented and evaluated in Iceland, not previously involved in the model development, to identify input data needs. The project has resulted in an array of findings, of which some have been possible to implement in new parametrisations in the NORTRIP model. In the complex research area of road dust dynamics, the project has also resulted in a lot of practical experiences concerning experimental and meas-urement designs and evaluation possibilities that future research will be able to benefit from.
Keywords road dust, PM10, NORTRIP, emission, modelling, sweeping, dust binding, road operation, traction sand, air quality,
3
4
Content
... 1 Background ... 7 Aim ... 8 Methods ... 9 Field tests ... 9Test site descriptions ... 9
Tyre testing track ... 9
Vantaa ... 9
Stockholm ... 10
Measurement techniques and methods ... 11
Sniffer ... 11
Vectra ... 12
Stationary air quality measurements ... 13
Wet Dust Sampler ... 13
Traffic measurements at Vantaa ... 14
Tests performed at testing track ... 16
Tests performed during Vantaa campaign ... 17
Road dust suspension experiment ... 17
Air quality measurements ... 18
Crushing experiment ... 22
Cleaning experiment ... 22
Sanding experiment ... 24
Tests performed during Stockholm campaign ... 25
E18 measurements ... 25
Mobile tunnel measurements ... 26
Mobile street measurements ... 26
Cleaning evaluations with WDS ... 27
Traffic dislocation test with WDS ... 28
WDS comparison ... 28
Laboratory studies ... 29
VTI road simulator study ... 29
Statistical evaluation of road simulator data ... 31
Statistical analysis method for PM10, PM2.5 and number concentration ... 31
Main analysis (1st analysis) ... 32
Statistical analyses of tyre properties (2nd analysis) ... 32
Comparing the two ways of analysing tyre effects ... 32
Statistical analysis of background behaviour (3nd analysis) ... 32
Statistical analyses of tyre properties and environment variables (4th analysis) ... 33
Comparing analyses. ... 33
5
NORTRIP model development ... 34
Relating mobile measurement data to dust loading and emissions ... 34
Cleaning efficiencies and cleanable dust load ... 35
Sand crushing ... 35
PM2.5/PM10 ratio of surface and ambient air road dust emissions ... 36
Relating surface texture to model processes ... 36
NORTRIP implementation in Iceland ... 37
Data collection and assumptions ... 39
Traffic Data ... 39
Meteorological Data ... 42
Activity Data ... 42
Air Quality Data ... 43
Air quality data check ... 44
Results ... 47
WP1 Field tests ... 47
On-road measurements of modern winter tyres ... 47
Vantaa campaign ... 48
Road dust suspension experiment ... 48
Sanding experiment ... 57
Crushing experiment ... 59
Cleaning experiment ... 60
Stockholm campaign... 62
E18 measurements ... 62
Mobile tunnel measurements ... 68
Mobile street measurements in Stockholm city street ... 69
Stationary air quality measurements ... 72
Evaluation of cleaning Hornsgatan ... 73
Emission factors Hornsgatan ... 75
Size distributions ... 76
Tunnel measurements ... 78
E18 measurements ... 79
Sweeping test on Fleminggatan ... 80
Flushing and vacuum sweeping test on Hornsgatan ... 80
Traffic dislocation test on Hornsgatan ... 81
Comparison between dust load and Sniffer signal ... 82
WP2 Laboratory studies... 83
Studded tyre tests in road simulator ... 83
Mass and number concentrations and particle size distributions ... 83
Statistical analyses ... 85
Comparison of road simulator results with field results from Vectra tests ... 97
NORTRIP model development ... 98
Relating mobile measurement data to dust loading and emissions ... 98
Cleaning efficiencies and cleanable dust load ... 99
6
PM2.5/PM10 ratio of surface and ambient air road dust emissions ... 104
NORTRIP implementation in Iceland ... 106
The 2012 dataset ... 107
The 2016 dataset ... 115
Discussion ... 118
Conclusions ... 125
Field tests Vantaa ... 125
Field tests Stockholm ... 125
Tyre tests with Vectra and in road simulator ... 126
NORTRIP in Iceland ... 126
Future work ... 127
7
Background
Emission of wear particles and road dust is an air quality issue especially in the Nordic countries, where studded tyres and traction sand is used in winter, both being strong sources to road dust. Concentration of inhalable particles in our ambient air is negatively affecting public health (Thompson, 2018, Shaughnessy et al., 2015, Kampa and Castanas, 2008, de Kok et al., 2006, Kappos et al., 2004, Schwartz et al., 1999). Road traffic exhaust particles have strong effects, but their emissions are regulated and decreasing due to EURO standards and a strong global political ambition to move to-wards non-fossil fuels. Wear particles are, on the other hand not regulated and the emissions will grow with growing road traffic (Amato et al., 2014, Denier van der Gon et al., 2012). Electrical cars will in-crease wear of pavements and tyres due to higher weight and torque (Timmers and Achten, 2016). Studies on the coarser fractions associated with wear processes show that these are related to effects on e.g. airway diseases and acute mortality (Forsberg et al., 2005, Meister et al., 2012). While the emissions are not regulated for wear particles and road dust, the ambient concentrations of PM10 are subject to regulations through the EU air quality directive (European Council, 2008), measures must be taken to reduce the concentrations.
To reduce emissions of wear particles and road dust, national efforts have been made in the Nordic countries concerning use of studded tyres, more wear resistant pavement, traffic measures and better road operation. To support these efforts with knowledge, quite a lot of research has followed. Work has been done regarding emissions and properties of particle from studded tyres and pavement wear as well as from winter traction sand (Gustafsson et al., 2009, Gustafsson et al., 2019b, Räisänen et al., 2003, Räisänen et al., 2005, Kupiainen et al., 2016, Kupiainen and Tervahattu, 2004, Kupiainen et al., 2003, Kupiainen et al., 2005, Snilsberg, 2008, Aksnes, 2009). Health studies have been performed to investigate the toxicology of road dust (Karlsson et al., 2011, Lindbom et al., 2006, Hetland et al., 2000, Hetland et al., 2001, Karlsson et al., 2006, Schwarze et al., 2002, Øvrevik et al., 2005, Øvrevik et al., 2008) as well as studies on mitigation measures connected to road operation (Tervahattu et al., 2007, Männikkö et al., 2014, Gustafsson et al., 2019a, Gustafsson et al., 2019c).
Despite the common nature of air quality problems in the Nordic countries, only limited research col-laboration has been done. This, together with the complexity of road dust emissions and the strong need to handle these emissions in Nordic air quality modelling, initiated the NORTRIP project (Johans-son et al., 2012), starting to combine the knowledge and experiences from Nordic road dust research into a comprehensive, physically based emission model, later also called the NORTRIP model (Denby et al., 2013a, Denby et al., 2013b, Johansson et al., 2012, Norman et al., 2016). Based on the needs for improvements in physical understanding of processes in and better parametrisation of the model, identified in the NORTRIP collaboration, the NorDust project was proposed as a common Nordic re-search project to NordFoU.
8
Aim
The aims of the NorDust project are to bring together Nordic expertise in the area of road dust and to, further develop understanding and emission modelling of road dust emission processes and its impact on the concentrations of PM10 and PM2.5 in ambient air.
9
Methods
Field tests
Test site descriptions
Tyre testing track
Tyre tests are conducted in the street called Vanha Porvoontie located in the city of Vantaa in south-ern Finland (60°17′40″N 025°02′25″E, Figure 1). Vanha Porvoontie is a two-lane street with estimated average annual daily traffic of 11000 vehicles and 60 km/h speed limit. The street segment used for the measurements is divided into two sections for the data processing purpose. Approximate lengths of the sections is 700 m and 1000 m.
Figure 1. Vanha Porvoontie segment used for the on-road measurements of tyres with the Vectra vehicles Vantaa
Test site located at Koisotie in the city of Vantaa is a collection depot for snow and other debris mate-rial collected from the streets. It is used by the city of Vantaa and their road maintenance contractors. Snowmelt is collected and drained out from the field on the south end; however, small water pond ex-ists in the area year-round. The O-track and two I-tracks were defined in the field as illustrated in Fig-ure 2. The I-tracks were positioned in such a way that allowed measFig-urement vehicles to gain desired
10
speed before entering the tracks. For the data processing purpose, O-track was divided into sections (S1, S2, S3, C1 and C2).
Figure 2. Test field in Koisotie, Vantaa with illustration of the test tracks.
Stockholm
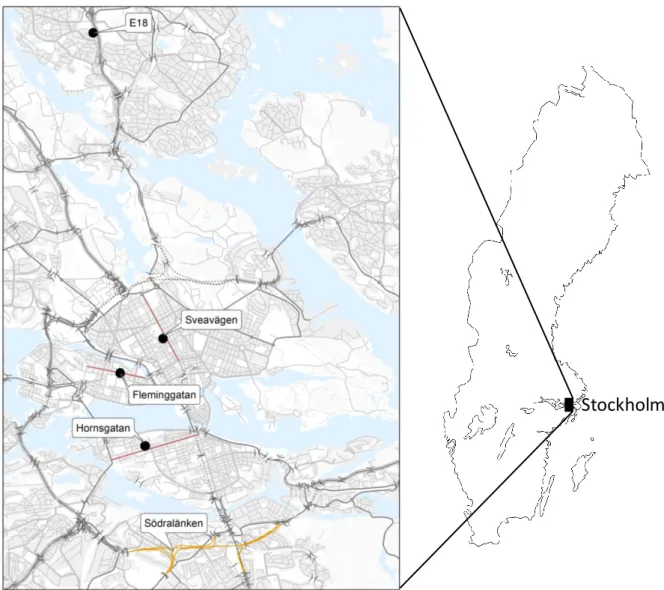
Stockholm is situated close to the Swedish Baltic coast where the lake Mälaren connects to the Baltic sea (59°19′46″N 18°4′7″E). It has a humid continental climate with distinct seasons, including cold, snowy periods in winter. The number of inhabitants is about 950 000 (Stockholms stad, 2017). In the central city, road dust and mobile suspension measurements were made on three streets with air quality monitoring stations in the Stockholm city centre (Figure 3), in the Södra länken tunnel and at an air quality site on the highway E18, north of the city centre (Figure 3).
11
Figure 3. Streets and measurement sites used for investigations in NorDust in Stockholm, Sweden.
Measurement techniques and methods
Sniffer
Sniffer vehicle (Volkswagen LT35 diesel van) is a unique high-technology research laboratory for air quality measurements. It provides measurements of traffic exhaust emissions under real driving condi-tions and measurement of non-exhaust particles (Pirjola et al., 2004; 2009; 2010). Dust sample is col-lected through a conical inlet at 5 cm distance from the left rear tyre. Background PM10 is measured above the front bumper.
The PM2.5 and PM10 mass concentration are monitored by two TEOMs, (Tapered Element Oscillat-ing Microbalance; series 1400A, Rupprecht & Patashnick and Thermo Scientific Teom 1405-D), with time resolution of 10 seconds. PM10 is also monitored from bumper and behind rear tire by two Dust-Traks (TSI, model 8530), with a resolution time of 1 second. Additionally, size distribution of dust is measured by OPS (TSI, model3330). A weather station on the roof of the van at a height of 2.9 m above the ground level provides meteorological parameters (wind speed, wind direction, temperature, relative humidity), and a global positioning system saves the van’s speed and the driving route.
12
Figure 4. Sniffer vehicle Vectra
Opel Vectra passenger car (Figure 5) is a mobile laboratory designed to measure resuspended PM10 emission from behind the tyre during operation. It is based on the TRAKER (Testing Re-entrained Aer-osol Kinetic Emissions from streets) method developed in USA (Etyemezian et al., 2003). Suspended dust is collected at 5 cm distance from the left front tyre. Background PM10 is measured in front of the front bumper. PM10 concentration is monitored by two DustTraks (TSI, model 8530), with a resolution time of 1 second. Global positioning system is used for saving the information about the car’s speed and route.
13
Stationary air quality measurements
SLB-analys is responsible for the air quality monitoring in the City of Stockholm. That includes station-ary measurement sites for PM10 monitoring in the city centre with five in street canyons and one ur-ban background site placed on a roof 24 m above street level. Three of the street sites, Hornsgatan, Folkungagatan and Fleminggatan (Figure 3) were used in this study. For PM10, automatic instruments tapered element oscillating microbalance TEOM 1400ab, (Rupprecht and Pataschnik). At Hornsgatan and Sveavägen the TEOMs were equipped with both PM10- and PM2.5-inlets and a two electrical ball-valves were used to automatically switch between the two inlets. NOx is monitored with Chemilu-minescence analysers (Environment AC32 M). In addition, Hornsgatan and the urban background sta-tion Torkel Knutssonsgatan was equipped with GRIMM EDM 180 which measures PM10, PM2.5 as well as coarse size distribution in 32-channels between 0.25 and 32 µm diameter. The measurement station at Hornsgatan is described in more detail in Gidhagen et al., (2004).
In the Södra länken road tunnel were two TEOM used for continuous PM10 monitoring.
At E18 test site in Danderyd were two sites placed on each side of the highway. The stations were equipped with GRIMM EDM 180 for PM-monitoring and Environment AC32 M for NOx monitoring.
Wet Dust Sampler
Road dust load was sampled using the VTI Wet Dust Sampler (WDS), which is a sampler using high pressurized water to clean a small circular road surface area during a specified time and compressed air to move the sample from the washing unit to a sample bottle. Each washing is referred to as a “shot”. The washing unit uses a spray nozzle with a filled cone spray pattern to thoroughly clean the surface (Figure 6). The sample is sieved at 180 µm, filtered and burned to determine the inorganic (and organic) dust load on the road surface. The data is given as DL180, meaning dust load smaller than 180 µm. Subsamples are often taken out for size distribution analyses and for filtrate analyses. The dust can also be analysed for chemical content after filtering.
14
Figure 6. The VTI Wet Dust Sampler equipment (WDS). Photo: Mats Gustafsson, VTI.
The WDS has been used in several Swedish national research projects, mainly for investigating the influence on different street and road operation measures against road dust emissions (Gustafsson et al., 2017; Gustafsson et al., 2014, 2015; Gustafsson et al., 2016; Gustafsson et al., 2012; Gustafsson et al., 2011; Janhäll et al., 2016; Järlskog et al., 2017), and is also used in Finland and Norway. Traffic measurements at Vantaa
Traffic was created by five personal cars plus an instrumented car, Vectra (described above), running counter-clockwise from north to south. At the first round and during the meandering test, the Vectra car was used as the only car. Before entering the WDS sampling sections a coaxial cable-based traffic registration installation was mounted on the road surface. The equipment samples a range of data making it possible to identify each car and its speed, lateral position, length and width (Figure 7).
15
Figure 7. Coaxial cable-based traffic measurement installation on O-track. Photo: Mats Gustafsson, VTI. During the test days, a total of 1816 passages were made during 8 periods between WDS-sampling (see Figure 8). The most important parameters for suspension are speed and lateral position. These are plotted for all rounds in Figure 8. Normally, the drivers focused on keeping a consistent wheel track, but during Round 5, an experiment with meandering of the traffic was conducted, why there are a higher number of outliers in this data.
Figure 8. Speed and lateral position box plots for all traffic rounds (number off passages in the boxes). Box plots show median, first and third quartile and wiskers 10th and 90th percentiles.
16 Tests performed at testing track
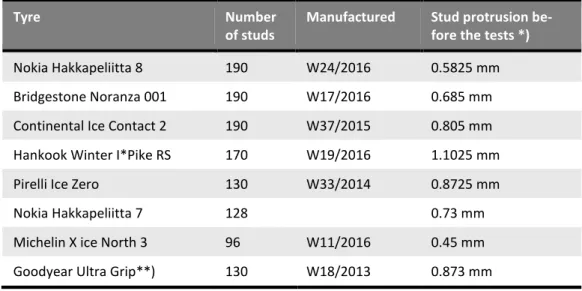
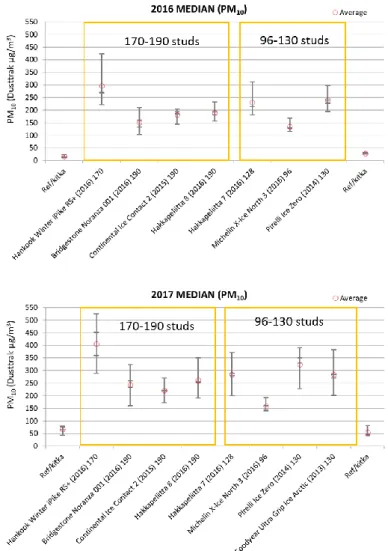
On-road measurements of winter tyres using the Vectra instrumented car are performed at the testing track. Eight studded winter tyres with different number of studs and stud protrusion were tested (Table 1). All tested tyres were driven from 200 to 250km before the test.
Measurements were performed in the low “summertime” suspension emission level to ensure that emission caused by studs will be detected. Previous studies (EU LIFE+, 2014) demonstrated that un-der high suspension conditions no significant difference is detected between tyres. Reference, non-studded winter tyre was used to indicate suspension level and changes in the surface conditions dur-ing the test days. Reference tyre was measured before and after the winter tyre set. Target speed of the measurement vehicle during the tests was 50 km/h. On-road measurements were conducted in 2016 and 2017.
Table 1 Tested tyres in on-road measurements at the test truck.
Tyre Number
of studs
Manufactured Stud protrusion be-fore the tests *)
Nokia Hakkapeliitta 8 190 W24/2016 0.5825 mm
Bridgestone Noranza 001 190 W17/2016 0.685 mm
Continental Ice Contact 2 190 W37/2015 0.805 mm
Hankook Winter I*Pike RS 170 W19/2016 1.1025 mm
Pirelli Ice Zero 130 W33/2014 0.8725 mm
Nokia Hakkapeliitta 7 128 0.73 mm
Michelin X ice North 3 96 W11/2016 0.45 mm
Goodyear Ultra Grip**) 130 W18/2013 0.873 mm
*) average of 20 studs **) tested only in 2017
17 Tests performed during Vantaa campaign
Road dust suspension experiment
On the O-track, along the western part, three WDS sampling sections (A, B, C) where defined on the track. The A section was not disturbed and dusty, sections B and C were brushed both by machine and by hand to even out the dust load. Section C was visually dustier than section B. Cones were placed three meters apart to steer the traffic in a similar way to create obvious wheel tracks (Figure 9).
Figure 9. Dust suspension test area. Photo: Mats Gustafsson, VTI.
WDS was used to sample the road dust load in transects across the sections every 20 cm. The turbid-ity of each sample was measured as an indicative measure for dust content. Six samples were identi-fied to be sampled in the left and right wheel tracks. These were combined into one sample for dust load in wheel track analyses by filtering. Six samples in between wheel tracks were combined to form a sample representing that area.
Figure 10. WDS samples in profiles across the ”driving lane”.
A total of nine measurements were performed, with three profiles each (section A, B and C). Table 2shows how traffic and WDS-measurements where performed.
18
The suspension tests were performed by the instrumented Vectra car, which were one of the vehicles used during the traffic rounds. At the first round and during the meandering test, it was used as the only car.
Table 2. Traffic and WDS-sampling during the Vantaa campaign.
Date Traffic
round
Traffic
(pas-sages) Mean speed (km/h) WDS-measurement Note
2016-09-26 A1, B1, C1 Before any traffic
1 10 38 only Vectra A2, B2, C2 2 50 39 All cars 2016-09-27 A3, B3, C3 3 200 39 All cars A4, B4, C4 4 20 41 only Vectra 4 240 40 All cars A5, B5, C5
5 5 42 only Vectra, before
meandering test
5 15 41 only Vectra,
mean-dering test
5 200 45 All cars
5 280 48 All cars
2016-09-28 A6, B6, C6
6 10 31
6 60 43 All cars, light drizzle
6 120 39 All cars
A7, B7, C7
2016-09-29 Wet surface
7 200 44 All cars
A8, B8, C8
2016-09-30 8 200 49 All cars, wet surface
8 206 60 All cars
A9, B9, C9
Air quality measurements
The purpose of the measurements was to collect more data of road dust (PM10) generated from road, breaks and tire wear, to be able to better simulate PM10 air pollution concentrations in model calcula-tions using for example the NORTRIP model. Measurements were performed using Lighthouse uring devices (Lighthouse Handheld 3016-IAQ), which are hand-held airborne particle counters meas-uring the number of particles in different size channels (0.3 micron to 10 micron) of
simultane-ous counting (Figure 11). They display cumulative and differential particle count data (PM0.5 to PM10
and TPM) that can be downloaded to a computer for further data processing. In the Vantaa campaign only PM10 was used for the analysis since this is the dominant size fraction of particles generated from road, breaks and tire wear. The Lighthouse devices also measure temperature and relative
19
humidity. The particle density was manually set to represent the density of road dust. All PM10 values presented in the Result part are corrected from parallel measurements with TEOM in Stockholm. The time resolution of measurement was 2 seconds. Four Lighthouse devices were used (called L1, L2, L3 and L4) measuring PM10 concentrations during the Vantaa campaign period. A meteorology station was mounted to keep track on wind, temperature and humidity. For practical reasons, the placement had to be done in a placement with slightly different wind conditions than the measurement place (Fig-ure 11).
Figure 11. The Lighthouse instruments used for measuring PM10 during the Vantaa campaign (left) and meteorology station (right).
Three different places were used for the air measurements during the campaign trying to get the most favourable dependent on wind direction. For best results the wind should be perpendicular to the road-way for upwind and downwind measurements. Trying to find the most favourable position for this the measurement setup was moved between three different places. It was also a question of cooperation with the other measurements performed during the campaign.
Two posts were placed on each side of the roadway. On the upwind side one Lighthouse device was fixed on the post 1.8 meters above ground level. On the downwind side three Lighthouse devices were fixed on three different heights of the post, illustrated in Figure 12. The heights of the Lighthouse de-vices were held constant both upwind and downwind moving between the three different measure-ment sites. The distance between the posts and the roadway was 2.85 meters on both sides. The road width between the orange cones was 3.2 meters.
Measurements were performed at different heights downwind to be able to determine the spread of the air pollution plume caused by the vehicles passing. The theory behind this measuring setup is that as long as the wind is coming from the upwind side the contribution of PM10 caused by passing vehi-cles will only give rise to higher concentrations on the downwind side. In the same way, the upwind side measurement will only show the background concentration. The difference in PM10 concentration between upwind and downwind measurements will represent the air pollution contribution caused by the passing vehicle (i.e. the emissions of PM10 from that particular vehicle). Using this setup, the emission factor per vehicle pass could be calculated. By subtract the PM10 levels measured on the upwind side from the levels on the downwind side the concentration of PM10 generated by each pass-ing vehicle can be determined. This procedure with an upwind/downwind technique has previously been used by other investigators (e.g. Gillies et al., 1999; Cowherd, 1999; Etyemezian et. al., 2002).
20
Unfortunately, the wind was never perpendicular to the measurement setup so the intended method described above could never be used. As presented later in the Result part the passing vehicles gave rise to increased concentrations at both upwind and downwind side, sometimes even higher peaks were measured on the upwind side than the downwind side. This in discussed more in the Result part.
Figure 12. Heights for upwind and downwind placement of the Lighthouse devices.
Simulations of running traffic was performed by driving cars on an oval track (O-track) summing up be-tween 20 and 100 passages per set. At site 1 and 3 (different places on the O-track) the vehicles were passing the measurement setup either on a straight or a curved place of the road (Figure 13). At site 2 (the I-track) all vehicles drove on a 100-meter straight road passing the measurement setup (Figure 14). Each vehicle passing by the measurement setup generated an air pollution plume and road dust (PM10) in that plume was measured by the four Lighthouse devices. The cars drove either in the wheel tracks or off the wheel tracks. All passages and the position on the road (in or off wheel tracks) were documented.
21
Figure 13. Measurement setup at site 1, driving O-track, passing the measurement setup where the road was straight.
Figure 14. Measurement setup at site 2 driving I-track.
Figure 15. Measurement setup at site 3, driving O-track, passing the measurement setup where the road was curved. At this site the Sniffer, measuring PM10 with a TEOM, was standing at the same place as the measurement setup
22
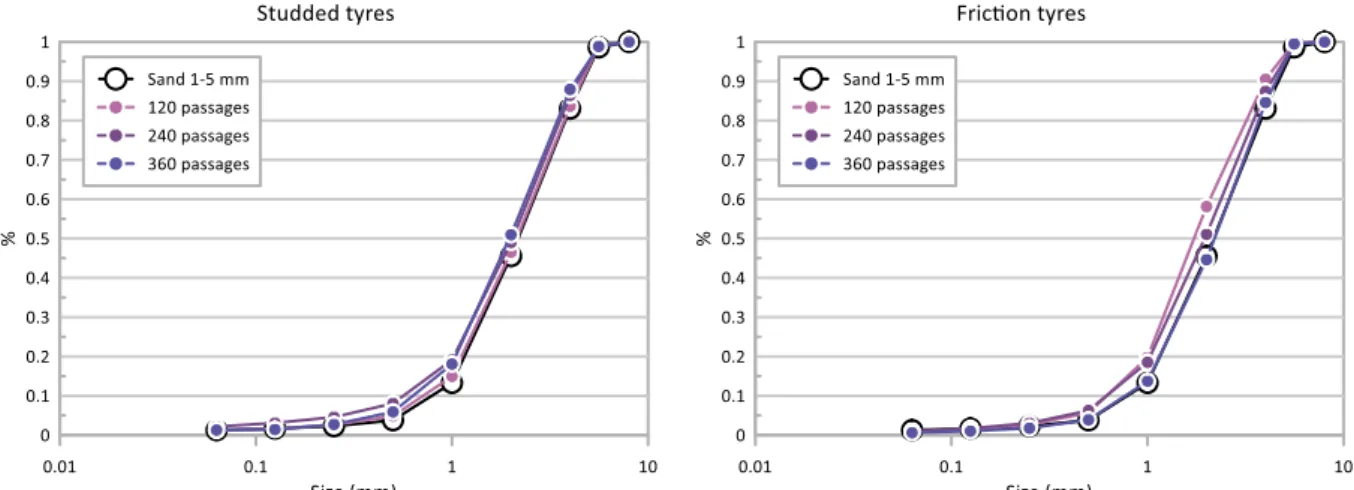
Crushing experiment
To investigate how the size distribution of sand used for traction control is affected by the passage of unstudded and studded winter tyres a known amount of traction sand was evenly distributed over a defined surface area on an asphalt surface. The area was enclosed by bricks on three sides to pre-vent the sand from leaving the area. Two tests were performed (with unstudded and studded tyres) in which one car were used to crush the sand by repeated slow overrunning (Figure 16). The size distri-bution of the original material was determined. After 120, 240 and 360 passages, samples were brushed from a square in the wheel track and the underlying surface sampled using WDS. Amounts and size distributions of the material was determined using both sieving and laser granulometer (Mas-tersizer 2000).
Figure 16. Brick-enclosed area for crushing test. Cleaning experiment
The aim of the cleaning experiment was to evaluate the efficiency of street cleaning in reducing PM10 emission. The experiment was conducted on the I-tracks. Two machines were tested side-by-side: PIMU (Scrubber with Captive Hydrology) and CityCat 5006 (compact sweeper). The instrumented Vectra car was used to monitor change in suspension emission. Initial emission level was measured one day before the treatment. The post-treatment emission levels were measurements within the cleaned area of the I-tracks and outside of the cleaned area (Figure 17 and Figure 18). Table 3 shows timing of the measurement rounds and number of Vectra passages. Target speed for the measure-ments was 40 km/h. Cleaning effect was also evaluated using WDS measuremeasure-ments. Two profiles on separate parts of the tracks were sampled before and after cleaning.
23
Figure 17. Street cleaning machines used for the cleaning experiment and illustration of the cleaned areas on the I-tracks 1 and the I-I-tracks 2. Grey arrows indicate approximate positioning of the front left tyre of the Vectra car during
the measurements in cleaned and outside the cleaned area.
Table 3. The timeline for the cleaning experiment
Action Timing Number of passages Purpose
1st measurement 26.9. at 17h 10 Pre-treatment level
Cleaning 27.9. at 12h
2nd measurement 27.9. at 14h 5 (cleaned area)
5 (outside cleaned area)
1st after treatment level on the same day
3rd measurement 27.9. at 16h 5 (cleaned area)
5 (outside cleaned area)
2st after treatment level on the same day
4rt measurement 28.9. at 16h 5 (cleaned area)
5 (outside cleaned area)
3rd after treatment level on the next day
24
Figure 18. Wet marks on I-tracks after the cleaning. Sanding experiment
The sanding experiment was conducted on I-track1 one day after the cleaning experiment. The aim was to demonstrate impact of sanding on the PM10 emissions. Crushed stone aggregate sieved into grain size fraction of 1-5mm was applied on the south half of the I-track. Mass of applied sand was 150g/m2.
Figure 19. Sand application on the I-track1.
The initial PM10 emission level was measured by Vectra one hour before the treatment with 5 pas-sages. Two follow-up measurements were done on the same day. During the 1st and 2nd follow-up
measurement five cars, including Vectra, made 20 and 10 passages, respectively. Mean traffic speed was 30 km/h during the first measurement after the treatment, and 40 km/h during the second. The mean PM10 concertation measured by Vectra was calculated for the treated and non-treated part of the I-track1.
25 Tests performed during Stockholm campaign
E18 measurements
Mobile measurements of the PM10 emission were done by Sniffer and Vectra vehicles. Measurements took place on the morning following the WDS sampling at E18. The measurements were done with three different target speeds (50, 60 and 70km/h) on the bus lane towards south and right lane to-wards north. Southbound right and middle lane and northbound middle and left lane were driven with 70km/h speed. For the data processing purpose, measured segment of the E18 was divided into three sections of equal length (Figure 20).
Figure 20. Division of lanes on E18.
WDS-measurements were made in a transect across all three lanes in the northward direction of the road (Figure 21). Samples were taken every 20 cm in a 13,8 m long profile, in which turbidity was measured. Six-shot combined samples were also taken in the three left wheel tracks and the three be-tween wheel tracks surfaces for filtration and DL180 calculation.
26
Mobile tunnel measurements
Mobile tunnel measurements were conducted at Södra länken (Figure 22) with Sniffer. The aim was to investigate how tunnel is affecting to road dust emission and dust variation along the road surface on a highway. Green sections are inside a tunnel and blue sections are outside the tunnel. Sniffer made total of 4 rounds. Because there was maintenance work in the tunnel during night time, only one measurement was performed at Södra länken.
Figure 22. Södra länken measurement route
Mobile street measurements
Measurements with the Sniffer vehicle were conducted on specifically designed urban route to include four streets with air quality monitoring: Fleminggatan, Folkungagatan, Hornsgatan and Sveavägen. An overview of mobile street measurements is given in Table 3.
In each of the test streets Sniffer made from 2 to 6 passages during the measurement rounds. In order to investigate lateral variation of the suspension emission, passages were made on different lanes.
27
Table 3. Overview of the mobile street measurements
Date Time Street Passages
4.4. 12:00 Fleminggatan 3 Folkungagatan 2 Hornsgatan 4 22:00 Fleminggatan 4 5.4. 2:00 Sveavägen 2 Fleminggatan 4 12:00 Fleminggatan 2 Folkungagatan 4 Hornsgatan 5 Sveavägen 1 22:00 Fleminggatan 2 Hornsgatan 4 Sveavägen 6 6.4. Fleminggatan 4 Hornsgatan 4
Cleaning evaluations with WDS
Evaluation of the street cleaning was conducted on Fleminggatan and on Hornsgatan. The cleaning on Fleminggatan was conducted with a DisaClean vacuum sweeper and took place after midnight on April 5th, 2017. The mobile measurements of the PM10 emission using the Sniffer vehicle were done
two times before the treatment and four times during the two days after the treatment. WDS measure-ments were made before and after street sweeping. Measuremeasure-ments were performed in profiles from the kerb over the cycle path and the first driving lane every 20th centimetre.
On Hornsgatan a combination of high-pressure water flushing and DisaClean vacuum sweeper was used at around 10-11 o’clock on 6th of April 2017 (Figure 23). Two flushing machines drove before and
the vacuum sweeper followed behind. A similar method has previously shown good results on dust load in studies in Trondheim (Järlskog et al., 2017).
28
Figure 23. Flushing machine followed by a vacuum sweeper on Hornsgatan, 6th of April 2017. Traffic dislocation test with WDS
To investigate if and how traffic reduces a known dust load, traffic on Hornsgatan was forced to move half a meter to the right by using movable traffic signs (Figure 24).
Figure 24. Traffic dislocation test, where road signs were used to push traffic slightly to the left in driving direction. WDS comparison
During the project time, Nordic Envicon Oy acquired a WDS equipment (WDS III). During the cam-paign in Stockholm, measurements were made to compare the WDS II (VTI) to WDS III. Since no fil-tering laboratory resources were available at the time, focus was on comparing turbidity in profile sam-ples. Comparisons were made on Fleminggatan. In first test, on 2017-04-05, samples were taken in one single profile every 25 cm, alternating between WDS II and III. In the second test, on 2017-04-07,
29
six profiles were with 25 cm between samples in profiles and 20 cm between profiles along the street. All samples were analysed using the same type of turbidity meter (HI88713 ISO Turbidity Meter from Hanna Instruments) at VTI and Nordic Envicon Oy.
Laboratory studies
VTI road simulator study
The road simulator (Figure 25) consists of four wheels that run along a circular track with a diameter of 5.3 m. A separate motor is driving each wheel and the speed can be varied up to 70 km/h. The wheel axles have different lengths, positioning the wheels in different distances from the centre, and an ex-centric movement of the central vertical axis is used to slowly side shift the tyres over the full width of the track. Wheels on axles 1 and 3 are at the track edges, while wheels on axles 2 and 4 are running closer to the middle of the track. Any type of pavement can be applied to the simulator track and any type of tyre can be mounted on the axles. An internal air-cooling system in the hall is able to temperate the simulator hall to below 0°C.
Figure 25. The VTI road simulator. Photo: Mats Gustafsson, VTI.
A pavement ring, used for a previous wear test, including 14 different asphalt pavements of types stone mastic asphalt with different maximum aggregate sizes, SMA6, SMA8 and SMA11 with granodiorite rock, tested for texture development was used for the tests. The SMA pavement construction is wear resistant and commonly used in Nordic countries. The current rock quality and the smaller aggregate sizes (6 and 8 mm) are meant for use in Denmark, where no studded tyres are used. Smaller aggregate size makes the SMA less noisy than coarser aggregates.
30
Six studded tyre models were tested. The choices where made from the tyres tested using the instru-mented test car Vectra on the testing track (see above), with varying number if studs. All tyres had the dimensions 205/55 R16.
Table 4. Tested tyres in the road simulator study
No Tyre Number of studs per tyre
1 Nokian Hakkapeliitta 8 189
2 Hankook Winter Pike 169
3 Bridgestone Noranza 190
4 Continental Conti ice 2 189
5 Michelin X ice North 3 96
6 Pirelli Ice Zero 130
For all analyses, a 15-minutes mean value of PM2.5, PM10 and number concentration at the end of each simulator run was used.
Regarding concentration of PM2.5and PM10, two different techniques were used. • Tapered Element Oscillating Microbalance (TEOM)
The instrument is based on gravimetric technique using a microbalance. A value of mass con-centration PM10 is given every 5 minutes. The method is certified for air quality standard mon-itoring within the EU.
• DustTrak (DT)
Two of these optical instruments were used during the measurements; one measured mass concentration PM2.5and the other PM10. The time resolution of the sampling was 3 s for both instruments.
Particle size distributions describe how airborne particles are distributed in size according to mass and number (volume and surface area is also a possibility, but not of interest in this study). The size distri-butions were measured using an APS (Aerodynamic Particle Sizer) model 3321 (TSI, USA) measuring mass distribution and an SMPS-system (Scanning Mobility Particle Sizer) model 3934 (TSI, USA) meas-uring number distribution. The SMPS-system was setup to measure and count particles from 7.37 nm to 311 nm. The APS was equipped with a PM10 inlet and hence, measured particles with aerodynamic diameter from 0.523 μm to 10 µm. Size distributions of particles measured with the SMPS system are presented as number size distributions and particles measured with the APS are presented as mass size distributions. This is because the fine fraction below 1 µm makes up very little of the mass but contain most of the particles while the coarser particles are very few but dominate the mass concentra-tion.
When presenting data from APS and SMPS it is common to normalize the measured particle mass distribution. The normalization means that measured mass for a specific particle size range (=dM) is divided by the logarithm of the measured particles size interval = d log(dp) (often written as dlogDp). This means that mass distributions measured using instrument with different particle size intervals could easily be compared.
The conditions in the road simulator hall are drifting during a test day, due to frictional heat warming the pavement, tyres and air. To handle this, a test sequence where the same tyre set is run first and last on each test day was used. For five test days, with five test runs a day, a suggested sequence is shown in Table 5.
31
Table 5. Used test sequence in road simulator.
Run1 Run2 Run3 Run4
Day 1 1 5 4 1
Day 2 2 6 4 2
Day 3 3 1 6 3
Day 4 4 6 1 4
Day 5 5 3 2 5
The test sequence is performed as follows:
1. Tyres are mounted (always the same tyres on the same rim and axle) 2. Cooler is turned off
3. Simulator is started and accelerated to 50 km/h. 4. After 1 hour, simulator is stopped.
5. Cooler and a large air filtering fan are started to reduce deposition and lower the PM10 con-centration to initial level
6. Tyres are switched to next tyre set
7. When PM10 concentration reaches initial level (TEOM PM10), cooler and air filtering fan are turned off and simulator started for next test.
Tyre inflation pressure is checked between each test.
Statistical evaluation of road simulator data
Six studded winter tyres were compared regarding different measures of particle emissions. Some tyre properties are shown in Table 6.
Table 6. Properties of the tyres used in the study.
Tyre no.
Number of studs per tyre
Mean stud protrution (mm)
Mean stud force (N)
Mean stud mass (g) 1 189 1.31 177 0.80 2 169 1.59 202 0.85 3 190 1.29 190 0.86 4 189 1.51 191 0.73 5 96 1.41 209 0.88 6 130 1.19 245 0.95
Statistical analysis method for PM10, PM2.5 and number concentration
The choice of an experimental design depends on the details of the analysis and vice versa and need to be decided upon simultaneously. Here, we start by describing the statistical analysis procedure. For each suggested analysis, emission data are assumed to consist of tyre effects, background behav-iour and a random component. The main focus of this study is to compare tyres. Four analyses were used, where the difference between analyses is which of two approaches that should be used for tyre effects and which of two approaches that should be used for background behaviour. The background behaviour part of the model is needed because conditions in the road simulator hall that may have an influence on particle emissions are drifting during a test day. Though changes in the environment may not be of main importance when comparing tyres, they may coincide with the experimental design of the
32
tyres and be falsely interpreted as tyre effects. By modelling the possibly uninteresting general behav-iour, it is eliminated from the comparisons between tyres.
Main analysis (1st analysis)
In the main analysis, the tyre effects are modelled as constants that do not change between or within days and that sum to zero. The general behaviour is modelled as straight-line background behaviour during the days, one line for each day. General behaviour and tyre effects were analysed simultaneously with multiple linear regression and general linear models. Depending on the coding scheme for tyres, the tyre effects can be chosen to express differences between each of the tyres and an average of all tested tyres or differences between pairs of tyres. Both these coding schemes have been used in various parts of the following text.
Statistical analyses of tyre properties (2nd analysis)
In this second analysis, tyre effects are modelled as functions of tyre properties that are supposed to be able to explain the particle emissions such as number of studs and stud protrusion while the background is still modelled as one straight line for each day. Multiple linear regression was used for this analysis. Comparing the two ways of analysing tyre effects
The first and second analysis use two different approaches to model tyre effects. In the main analysis, the tyre effects are simply a set of constants without any lower level structure. This may be the best approach when comparing tyres "as is". To understand what the tyre effects really consist of it is advan-tageous to, if possible, explain the differences between tyres as a function of important tyre properties. Practically, with the types of analyses performed in the current study the following questions can be addressed:
• First analysis–are there any differences between tyres if we are not looking for an explanation to such differences?
• Second analysis–are there any differences between tyres that can be explained by number of studs, stud protrusion etc?
It is not generally possible to combine the two approaches. Tyre effects cannot be explained both as constants and as function of tyre properties in the same analysis.
The second approach is preferred if the model fits good to the data. It does not only tell if there is a difference between tyres but also how that difference can be explained. The model is also smaller in the sense that fewer parameters are estimated. On the other hand, the model that fits best to the data is preferred. For any analysis, there should not exist important explanatory variables that are not in the model. It is simply a difficult task to choose between models if there is not one that is smallest, has best fit and have coefficients that make sense without any conflict with prior knowledge or assumptions. Statistical analysis of background behaviour (3nd analysis)
In the main analysis, the general behaviour (or background behaviour) is modelled only as straight lines without any lower level structure. There may of course be situation where the effect of changes in tem-perature etc. is the main focus. In this third analysis, the background behaviour is modelled as a function of variables in the experimental environment that are supposed to be able to explain the particle emis-sions (humidity, road temperature etc.) that are also recorded during the experiment. That is the same change in approach for the experimental environment part of the model as was discussed above for the
33
tyre part. Multiple linear regression is used for this analysis. If the aim was to really find out how varying humidity, road temperature and tyre temperature can explain variation in particle emissions, the third analysis could be used but one should force these variables to vary during the experiment.
Statistical analyses of tyre properties and environment variables (4th analysis)
Though it is not generally possible to combine the two approaches, it is possible to choose one approach for the tyres part and one for the environment part of the model separately. The change in approach from first to second analysis and the change in approach from first to third can be used separately, as they have been discussed above, or combined. The 4th analysis is the last combination where both tyre effects and background is modelled as functions of their properties.
Comparing analyses.
The four models need to be compared in the same sense as was discussed in section NNN. Model comparisons are discussed further in section NNN.
Design of experiment
The six tyres were tested during five days with four runs per day. The design was planned to be optimal for pairwise comparisons of tyres in the main analysis. The differences between two tyres is expressed as a regression coefficient. For one design, there are 15 such comparisons. With these numbers, the design cannot be symmetric resulting in that all comparisons do not have the same standard error. We assume that the best plan is the one that has minimum value of the maximum standard error among all pairwise comparisons in the main analysis. The solution was to search for the most efficient design by scanning through a huge set of randomly generated possible designs. Preliminary results indicate that it is efficient to use the same tyre on the first and last run each day and the search algorithm was tuned to only scan through such designs. The procedure does not guarantee that we found the best design, but it has a high probability that the chosen design is the best or at least close to being the best (Table 7).
Table 7. . Chosen design for analyses.
Run 1 Run 2 Run 3 Run 4
Day 1 1 5 4 1
Day 2 2 6 4 2
Day 3 3 1 6 3
Day 4 4 6 1 4
Day 5 5 3 2 5
The experiment is not designed to find the best estimates of the effects of changes in the environment variables (the 3d/4th analysis). In fact, the environment is controlled to keep air temperature close to constant which causes estimates of temperature effects to have low precision.
34
NORTRIP model development
One of the aims of the measurement campaigns was to provide improved data for describing a num-ber of parameterisations in the NORTRIP road dust emission model. Several experiments were aimed at addressing the following processes:
1. Relating mobile measurement data to dust loading and emissions 2. Determining cleaning efficiencies and cleanable dust load
3. Sand crushing and lateral migration of sand
4. Size distribution of surface and ambient air road dust emissions 5. Relating surface texture to model processes
In addition, relevant data from earlier experiments, MORS2, were used to describe: 6. Wet removal of water and salt
Not all these experiments were successful in providing new parameterisations for NORTRIP.
Relating mobile measurement data to dust loading and emissions
Simultaneous measurements of dust loading and mobile PM concentrations are needed to determine the relationship between mobile suspension measurements (µg/m3) using Sniffer/Vectra with surface
dust loading (g/m2) and eventually to the actual emissions (g/veh/km). This could be derived from the
Vantaa campaign or other measurement campaigns, e.g. Stockholm, where both parameters are measured near simultaneously. A conversion factor can then be determined. Complications involve the fact that the mobile measurements only sample suspendible dust. This may be addressed by esti-mating the non-suspendible dust load, e.g. on streets this could be 10- 20 g/m2 or at Vantaa this can
be the apparent limit in the wheel tracks by the end of the experiment.
We make the conceptual model that the amount of suspendible dust DLsus under traffic conditions is the difference between the ’between’ wheel track (BWT) and the ’in’ wheel track (WT) dust loading. In other words, all the suspendible dust in the wheel tracks has already been suspended.
DLsus = DLBWT – DLWT (1)
This may be a good estimate for heavily trafficked roads but for the Vantaa campaign there was not enough traffic to totally remove all the suspendible dust in the wheel tracks.
Due to meandering a vehicle will spend a certain fraction of it’s time on the edge or between the wheel tracks fBWT. So the suspension from the passage of one wheel (Ssus) in g/m can be written as:
Ssus = fsus fBWT DLsus Wtyre (2)
where fsus is the fraction of suspendible dust that is suspended by the passage of one tyre and Wtyre is the width of the tyre. If the sniffer signal is directly and linearly related to the suspension Ssus then we can write
35
Where ksniffer is the proportionality constant in the relationship Csniffer=ksniffer Ssus. From previous experi-ments, and also from the Vantaa campaign, the factor fsus is of the order of 0.01 – 0.001 veh-1. For Vantaa the e-folding vehicle number is around 200 veh, 400 tyres in each wheel track, giving an fsus =0.0025 tyre-1. This is typically the suspension rate for loose available dust in the wheel tracks. The time spent in the suspendible dust region fBWT is not known but can be estimated from meandering in-formation from real traffic situations and may be of the order of 0.1 to 0.01. The factor ksniffer is not known but we can try to derive this from the available data where road dust loading and Sniffer meas-urements have been performed simultaneously.
Cleaning efficiencies and cleanable dust load
An important question to be answered is the efficiency of cleaning methods since this is one of the few measures that can be implemented to reduce road dust loading. Frequent cleaning has been seen to have little impact on ambient air concentrations (Gustafsson et al., 2011)). It is also not known if clean-ing efficiencies are different for different particle sizes. In the NORTRIP model a parameterisation is used to describe the size dependent cleaning efficiency but information is generally not available to quantify this. The aim then is to improve the cleaning efficiency parameters in the model for different particle sizes and different cleaning methods
Road dust load measurements in Stockholm show ambiguous results when it comes to cleaning (Gustafsson et al., 2019c). There appears to be a redistribution of dust but no clear reduction. How-ever, other measurements in Trondheim (Janhäll et al., 2016, Snilsberg and Gryteselv, 2017), Finland (Kulovuori et al., 2019) and in controlled experiments (Gustafsson et al., 2011)have shown significant reductions of road dust after cleaning. One hypothesis is that when the road is very dusty then clean-ing works (a lot of material is available for cleanclean-ing) but when it has recently been cleaned then the road dust is no longer available for cleaning anymore (Gustafsson et al., 2019b). Is there a minimum threshold before cleaning becomes effective? Is there a relationship between this and surface texture? Can cleaning efficiency be quantified as fractional removal or should it be an absolute value?
To quantify the cleaning efficiency as a function of size distribution then two measurements can be used. Road dust sampling with size distribution before and after cleaning and measurements of road dust collected in the cleaning trucks (total dust collected after a number of kilometres and size distribu-tion). If measurements in trucks and on road are available at the same time, which they are not, then the difference in size distribution can provide a relative efficiency for size dependent cleaning effi-ciency. We will make use of before and after measurements using the WDS to provide information on cleaning efficiency and particle size dependence.
Sand crushing
Within NORTRIP an algorithm exists that simulates the crushing of sand (or other materials) by trans-ferring a fraction of one particle size mass bin down to the next particle size mass bin. This algorithm requires the parameters that describe the mass transfer as a fraction of the larger size bin transferred per vehicle passage. Dependence on speed and vehicle type is also possible. At the moment this pa-rameter is unknown so crushing experiments were carried out at Vantaa to provide a first estimate of these parameters. This experiment involved driving a vehicle backwards and forwards over a short but contained track covered with sand. The sand was sampled three times after 120 passes each using sweeping and the WDS. These samples were analysed for their size distribution and the difference between the samples was assessed.
36
PM2.5/PM10 ratio of surface and ambient air road dust emissions
Currently the NORTRIP model uses a fixed ratio of DL2.5/DL10=5% and DL10/DL180=28% for road dust wear. DL2.5/DL10 was based mainly on ambient air measurements after removal of the esti-mated exhaust contribution and DL10/DL180 was based on laboratory measurements in the road sim-ulator (Snilsberg, 2008). However, previous measurements of in-situ road dust indicate this ratio to be higher for DL2.5/DL10 15-25% and for DL10/DL180 to be slightly lower on average but with a greater range of 5% – 40 %.
A range of measurements have been made in NORDUST including, Sniffer, Vectra, ambient air, road simulator ambient air and surface sampling allowing an assessment of the fractions PM2.5/PM10, DL2.5/DL10 and DL10/DL180. Samples taken before and after cleaning are also available on a variety of surfaces. We can analyse these results to see if it is possible to update the size ratios used in NORTRIP in a consistent manner.
Relating surface texture to model processes
Surface texture may be an important parameter for a number of processes. Prior to the campaigns the following questions were posed regarding surface texture: From all the measurements available, where surface texture has been measured, can we deduce anything that will relate surface texture to the processes of suspension, dust loading or wet removal? Do we have any measurements of dust loading that can relate surface texture to the non-suspendible portion of the road dust? Do we have sniffer measurements and dust loading measurements together with surface texture measurements? Do any of the road simulator results help?
Measurements of surface texture have been made during the campaigns, but these did not vary suffi-ciently in order to derive meaningful relationships. So, no usable data was found to determine these relationships. This then remains an open question for further analysis and has not been further ad-dressed here.
37
NORTRIP implementation in Iceland
The NORTRIP model was applied for two different time periods, 2012 and 2016. During the data col-lection all necessary input data was either retrieved from the competent authorities or inferred or mod-elled starting from real measurements. The Icelandic authorities responsible for collecting the different data are listed in Table 8.
Table 8. Type of data collected at different Icelandic institutions.
Type of data Institution Website
Traffic data Activity data
Vegagerdin - The Icelandic Road Admin-istration
road.is
Studded tyres count
City of Reykjavik
Air quality data Umhverfisstofnun -
The Environmental Agency of Iceland (UST)
https://www.ust.is/einstak-lingar/loftgaedi/maelingar/
Weather data Vedurstofan - The Icelandic Meteorologi-cal Office (IMO)
en.vedur.is
The chosen road is at the intersection between Miklabraut and Grensasvegur. Miklabraut is one of the main streets leading into the town centre and the traffic volume is high, especially during the rush hours in the morning and late afternoon. Reykjavik lays on a peninsula, with the town centre towards the central part of it. The structure of the town is characterized by a strong suburban development and a division from residential and commercial areas leading to important daily traffic flows into the centre in the morning and out of the centre in the late afternoon. In addition to the suburban areas of Reykja-vik itself, the traffic arises also from other municipalities such as Kopavogur, Mosfellsbaer, Gardabaer and Hafnarfjördur. According to the Reykjavik Municipal Plan 2010-2030 the use of private cars was 75% in 2011, public transportation is used by 4% of the population and 19% are pedestrians and cy-clists (Hjaltason, 2014).
Figure 26 shows the road map of the Icelandic Road Administration and the location of the test area. It should be mentioned that within the City of Reykjavik, the communal roads are administered by the city itself, while the roads shown in Figure 26 are under the administration of the Icelandic Road Ad-ministration.
The road stretch is open and there are three lanes plus a dedicated bus lane in direction downtown (W) as well as one lane to turn left into Grensasvegur and one to turn right into Grensasvegur. Into the other direction, out of downtown (E), there is the same road configuration.
In addition of being one of the main roads towards the city centre and out, at the crossing between Mi-klabraut and Grensasvegur there is one air quality monitoring station run by the Environmental Agency. This is the most complete available air quality station close to traffic within the city of Reykja-vik, there are several other mobile monitoring stations which change location according to the need of monitoring, run both from the city of Reykjavik and the Environmental Agency. Figure 27 shows an or-thophoto of the test area and the location of the air quality station Grensasvegur (GRE).
38
Figure 26. Road stretches (black) leading into Reykjavik and administered by the Icelandic Road Administration Selt-jarnarnes, Kopavogur, Gardabaer, Hafnarfjördur and Mosfellsbaer are the surrounding municipalities. The red circle shows the location of the investigated road stretch at the crossing Miklabraut/ Grensasvegur. (modified from
http://ve-gasja.vegagerdin.is/eng/).
Figure 27 The ortophoto shows the details of the surroundings of the investigated road stretch. Miklabraut has the number 49 according to the system of the Road Administration. In red the air quality measurement station GRE -
Grensasvegur (modified from http://vegasja.vegagerdin.is/eng/).
The input data for the NORTRIP model are time series, hourly data regarding traffic, meteorology, ac-tivity in terms of salting, ploughing and cleaning and air quality. Table 9 to Table 13 give an overview of the available datasets and available input parameters which will be discussed in detail in the follow-ing subchapters.
39
Table 9. Traffic data input.
Traffic Volume Speed
2012 Modelled according to ADT, SDT, WDT and NOX*WS values for weekends/weekdays
Inferred from speed limits
2016 Modelled according to monthly daily averages and NOX*WS values for weekends/weekdays
Inferred from speed limits
ADT- average daily traffic; SDT - summer daily traffic; WDT- winter daily traffic; WS- wind speed Table 10. Meteorology data input.
Meteorology Radiation Temperature Humidity Precipitation Cloud
Cover
2012 GRE* GRE* GRE* IMO station Nr. 1475 none
2016 GRE* GRE* GRE* IMO station Nr. 1475 none
*roof of measurement station
Table 11. Activity data input.
Activity Salting Ploughing Cleaning
2012 Modelled from measurements Modelled from measurements measured
2012 Modelled from measurements not available not available
Table 12. Road surface conditions.
Surface conditions Road temperature Road moisture
2012 none none
2016 none none
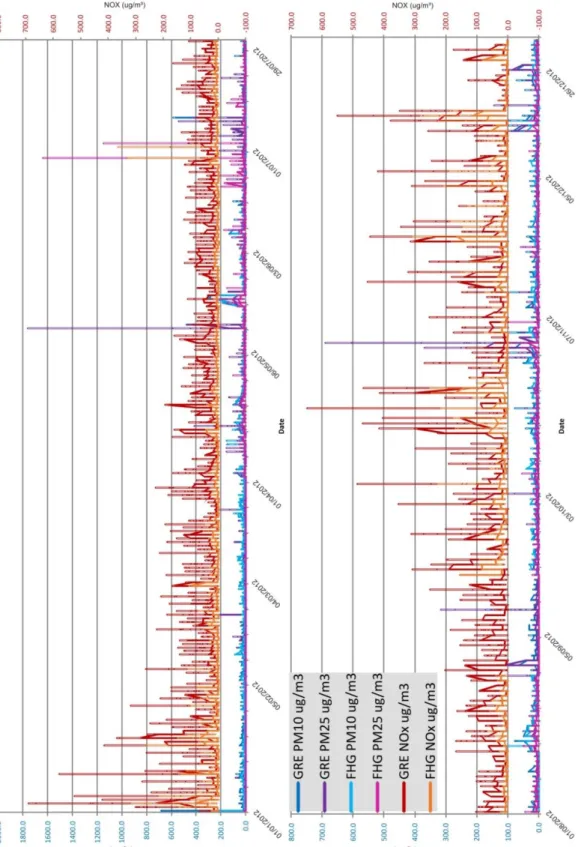
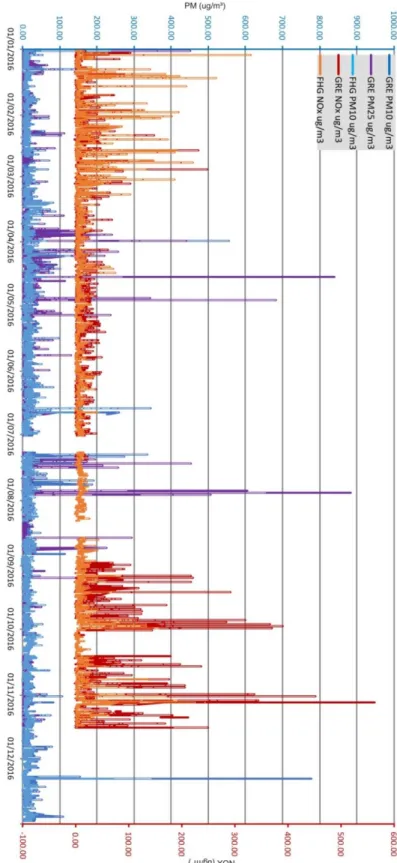
Table 13. Air quality data input. Air quality PM10 traffic PM10 Back-ground PM2.5 Traffic PM2.5 Back-ground NOx traffic NOx Back-ground Emissions (Ex/NOx)
2012 GRE FHG, HVAL GRE FHG, HVAL GRE FHG, HVAL Yes
2016 GRE, FHG, KOP GRE FHG, KOP GRE, FHG, KOP Yes
*GRE: roadside, FHG: town park; KOP: roadside, suburb; HVAL: road side, suburb
Data collection and assumptions
Not all the needed data needed for NORTRIP are available or measured in Iceland. Therefore, starting from the available datasets, some of the input data have been modelled or inferred. The following sub-chapters explain how hourly data have been retrieved or modelled.
Traffic Data
The needed traffic data are total traffic volume per hour, light duty vehicles per hour, heave duty vehi-cles, vehicle with summer tyres, winter tyres and studded tyres for each vehicle category (light and heavy) and vehicle speed.
There is no hourly traffic count available at the investigated road stretch, but there are averages and traffic counts available for the different time periods.
For 2012, the Road Administration has published the average daily traffic (ADT), the summer daily traffic (SDT) and the winter daily traffic (WDT) (http://www.vegagerdin.is/upplysingar-og-utgafa/umfer-din/umfthjodvegum) for the road nr. 49 - stretch 03. The road nr. 49 according to the nomenclature of the Road Administration corresponds to Miklabraut and the road stretch 03 is the closest one with a
40
traffic counter to the investigated road stretch (Figure 27). The average daily traffic (ADT) was used for the months of October, November, April and May; the summer daily traffic (SDT) for the months of June, July, August and September and the winter daily traffic (WDT) for the months of January, Febru-ary, March and December.
These daily averages were used, together with the NOx multiplied with wind speed (WS), to calculate the traffic variations during the day and the differences between weekdays and weekends. Differences due to holidays were not considered. Figure 28 shows the winter daily traffic (WDT) for the year 2012. These traffic counts are used for the months January, February, March and December 2012 and the difference of traffic between weekdays and weekends is clearly visible. The main morning weekdays traffic peak hours are between 8.30 and 10.30 and the main afternoon weekday traffic occurs between 16.30 and 18.30. During the weekends, Saturday and Sunday, the total amount of cars per hour is lower and there are no rush hours.
For the year 2016, monthly averages are available from the Road Administration and the same calcu-lation with NOx*WS was applied to obtain the hourly and weekdays variations for each month. Accord-ing to a written communication from the Road Administration durAccord-ing both years 97% of the traffic flow on Miklabraut was light traffic and 3% heavy traffic.
Figure 28. Winter daily traffic (WDT) average multiplied with NOx*WS to obtain the hourly traffic variation as well as the differences in between weekdays for winter months (January, February, March, December) of 2012. The difference
be-tween weekdays and weekends is clearly shown by the amount of traffic during morning and afternoon peak hours.
Every year the City of Reykjavik carries out a count of the number of studded tyres. This count is car-ried out by the Engineering firm EFLA and from the documentation the ratios of studded tyres during the wintertime were modelled. The tables are provided by the City of Reykjavik, Department of Plan-ning and Environment.
0 500 1000 1500 2000 2500 3000 3500 4000 4500 5000 1 2 3 4 5 6 7 8 9 10 11 12 13 14 15 16 17 18 19 20 21 22 23 24 N um be r of c a rs
Hour of the day
41
Studded tyres are allowed within the city borders between 31 October and 15 April of each year, tak-ing into consideration the meteorological variability of Icelandic winters. The percentages of the stud-ded tyres were used to model the winter tyres, and presumably with or without studs. It was assumed that heavy traffic (3% of the total traffic volume) is less likely to use studs in town and therefore the percentages in Figure 29 are not used for the heavy traffic. It is also unclear, if all cars are equipped with winter tyres during the winter period. There is no rule stating the mandatory use of winter tyres, but that the car must be equipped reflecting the weather conditions. Very often all year tyres are used, which are not accounted for in the NORTRIP model.
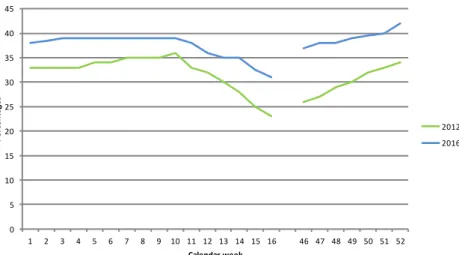
The use of studded tyres has increased over the years, and the Figure 30 shows a clear difference be-tween 2012 and 2016.
The speed of the traffic is not measured at the road stretch. Therefore, the maximum speed is used, even though there is a traffic light at the crossing Miklabraut and Grensasvegur and there are speed variations.
Figure 29. Use of studded tyres in Reykjavik, from 2000-2001 to 2016-2017: (extract from EFLA, data given by the City of Reykjavik, Department for Planning and Environment).
42
Figure 30 Studded tyres count of 2012 and 2016. The percentages show that the use of studded tyres has increased over the years. (Data from EFLA, given by the City of Reykjavik, Department for Planning and Environment).
Meteorological Data
The meteorological data are mostly taken directly from the air quality station at Grensasvegur, as it is a complete measurement station. These include the air temperature at 2 m (T2m, °C), the wind speed (FF, m/s) and wind direction, the humidity (RH, %) the global radiation and pressure. The rain data (mm/hr) are taken from the weather station Nr. 1475 which is located 1.5 km in direction SW from the air quality station. Snow data are not considered, as the weather station measures snow as melted water in mm.
Activity Data
The activity data is subdivided in salting, sanding, ploughing, cleaning and road wetting. Sanding is not used in Reykjavik for roads, only salt is applied. Ploughing and salting happens mostly at the same time as the salt, only in the form of Na, is applied when ploughing. The roads are cleaned on average once a year, at the end of the winter between April and May, which varies according to the weather conditions from year to year.
For the year 2012, the Icelandic Road Administration made available upon request the following data: • 24-hour average of salting amount in g/m² is given for the blue area shown in Figure 31 • data about every salting passage (hourly) and dosage;
• hourly passage of ploughing.
As hourly data are needed, the 24-hour average is divided by hours in which one or more vehicles were passing along that road stretch. For example, on 1 January 2012, the salting device passed the road stretch between 13-14, 14-15 and 15-16 and the 24-hr dosage was 16 g/m². Dividing 16 by the 3 hours a dosage of 5.3 for the relative hours of passing is obtained while during all the other hours of the day the dosage is 0. The same principle was used for the passage of the ploughing device, in this case a passing at a certain hour gives a 1 and a non-passing a 0.
0 5 10 15 20 25 30 35 40 45 1 2 3 4 5 6 7 8 9 10 11 12 13 14 15 16 46 47 48 49 50 51 52 P e rc e nt ag e s Calendar week 2012 2016