Mälardalen University Press Licentiate Theses No. 241
WIRELESS WEARABLE MEASUREMENT SYSTEM BASED
ON PEDOBAROGRAPHY FOR MONITORING OF HEALTH
Per Anders Rickard Hellström
2016
School of Innovation, Design and Engineering
Mälardalen University Press Licentiate Theses
No. 241
WIRELESS WEARABLE MEASUREMENT SYSTEM BASED
ON PEDOBAROGRAPHY FOR MONITORING OF HEALTH
Per Anders Rickard Hellström
2016
Copyright © Per Anders Rickard Hellström, 2016 ISBN 978-91-7485-276-9
ISSN 1651-9256
M¨alardalen University Press Licentiate Theses No. 241
WIRELESS WEARABLE MEASUREMENT SYSTEM
BASED ON PEDOBAROGRAPHY FOR MONITORING
OF HEALTH
Per Anders Rickard Hellstr¨om
Akademisk avhandling
som f¨or avl¨aggande av teknologie licentiatexamen i elektronik vid akademin f¨or innovation, design och teknik kommer att offentligen
f¨orsvaras fredagen den 30 september 2016, klockan 9.15 i Delta, M¨alardalens h¨ogskola, V¨aster˚as.
Fakultetsopponent: professor Amy Loutfi, ¨Orebro universitet.
Akademin f¨or innovation, design och teknik (IDT) Avdelningen f¨or intelligenta framtida teknologier (IFT) Forskningsprofilen Inbyggda sensorsystem f¨or h¨alsa (ESS-H)
Copyright © Per Anders Rickard Hellstr¨om, 2016 ISBN 978-91-7485-276-9
ISSN 1651-9256
Abstract
Health care costs have increased over the last decades due to an ageing population. Therefore, research in personal health monitoring (PHM) has increased in response to this. PHM has advantages such as mobility (monitoring of health at work or at home), early detection of health problems enabling preventive health measures and a reduction of health care cost. Human motion analysis, using for example inertial measure-ment units and pedobarography, is an important subcategory of PHM. Pedobarography (PBG) is the study of pressure fields acting between the plantar surface of the foot and a supporting surface. Gait and posture analysis, prosthetics evaluation and monitoring of recovery from injury or disease are examples of PBG applications. Portable PBG can be performed using force sensing resistors built into the insole inside the shoe.
In accordance with this, the research aim for this licentiate thesis is to design, build and evaluate a wireless wearable measurement system based on pedobarography for monitoring of health. In order to fulfil the objectives of the research, literature studies were done and problems with existing in-shoe system solutions were identified. Thus, it was found that further opportunities existed for new designs of PBG systems which take these problems into account. Cross-sectional test case studies were used for validation. The research area is multidisciplinary and encompasses biomedical measurements, electronics and computer science.
The main research contributions include design and implementation of a PBG measurement system consisting of commercial off the shelf components, a novel method for selecting measurement samples for weight estimation of carried load during walk, and a novel method for analysing walking intensity using force-time integrals at the toe-off phase of the step. The research results suggest that the new PBG system, in combination with the two novel analysing methods, are suitable for use in wearable systems for monitoring of health. Personal health measurements are done to help decision making related to health. Thus, the future work will strive towards designing different decision support systems.
Sammandrag
Kostnaderna f¨or v˚ar h¨alsov˚ard har ¨okat de senaste ˚artiondena p˚a grund av att vi lever allt l¨angre. Till f¨oljd av detta har forskning inom personlig h¨alsomonitorering (PHM) ¨okat. PHM medf¨or f¨ordelar s˚asom r¨orlighet (h¨also¨overvakning p˚a jobbet och i hemmet), tidig uppt¨ackt av h¨alsoprob-lem medf¨or m¨ojlighet till ˚atg¨ard i ett tidigt skede, samt en minskning av kostnaderna f¨or h¨alsov˚ard. Analys av m¨anniskors r¨orelser, med hj¨alp av till exempel tr¨oghetsm¨atare och pedobarografi, ¨ar en viktig underkategori inom PHM. Pedobarografi (PBG) ¨ar studien av tryckf¨alt som uppst˚ar p˚a grund av krafter som verkar mellan fotens undersida och en uppb¨arande yta. Analys av g˚angstil och kroppsh˚allning, utv¨ardering av proteser, samt monitorering av ˚aterh¨amtning fr˚an skada eller sjukdom ¨ar exempel p˚a till¨ampningar av PBG. Portabel PBG kan exempelvis utf¨oras med hj¨alp av resistiva kraftsensorer implementerade i skors inl¨aggssulor.
I ¨overrensst¨ammelse med detta ¨ar syftet med forskningen i den h¨ar licen-tiatavhandlingen att designa, bygga och utv¨ardera ett tr˚adl¨ost b¨arbart m¨atsystem baserat p˚a pedobarografi f¨or ¨overvakning av h¨alsa. F¨or att uppfylla forskningsm˚alet utf¨ordes litteraturstudier och problem med ex-isterande skobaserade system identifierades. Tv¨arsnittsstudier anv¨andes vid valideringen. Forskningsomr˚adet ¨ar tv¨arvetenskapligt och omfattar biomedicinska m¨atningar, elektronik och datavetenskap.
De fr¨amsta vetenskapliga bidragen inkluderar design och implementer-ing av ett pedobarografiskt m¨atsystem best˚aende av ¨oppet tillg¨ang-liga komponenter, en ny metod f¨or att v¨alja ut uppm¨atta v¨arden f¨or uppskattning av vikt av buren last under g˚ang, samt en ny analysmetod f¨or g˚angintensitet med hj¨alp av kraft-tidsintegraler i stegets avstampsfas. Forskningsresultaten implicerar att det nya pedobarografisystemet, i kombination med de tv˚a nya analysmetoderna, ¨ar l¨ampliga att anv¨andas i b¨arbara system f¨or ¨overvakning av h¨alsa. M¨atningar vid personlig h¨alsomonitorering utf¨ors f¨or att hj¨alpa till vid beslutsfattande som r¨or h¨alsa. F¨oljaktligen str¨avar framtida forskning mot design av olika be-slutsst¨odsystem.
Abbreviations
COP centre of pressure
EE energy expenditure
EVA ethylene-vinyl acetate
FSR force sensing resistor
IMU inertial measurement unit
MTH metatarsal head
PBG pedobarography
PHM personal health monitoring
RA research activity
RQ research question
Acknowledgements
The research presented in this licentiate thesis was conducted at the School of Innovation, Design and Technology, M¨alardalen University, V¨aster˚as, Sweden, with financial support from the Swedish Knowledge Foundation (KKS). I am very grateful for their funding.
First and foremost I would like to express my deepest gratitude to my main supervisor Ass. Prof. Mia Folke and assistant supervisors Dr. Martin Ekstr¨om and Ass. Prof. Ning Xiong. They have given me large portions of their valuable time and taught me a lot, not only about the academic world and how to conduct research.
I also owe much to my co-authors Anna ˚Akerberg, Lennie Carl´en Eriksson and Jonatan Scharff Willners. My writing skills have improved thanks to the thorough and thoughtful feedback I have received, especially from Anna.
I would also love to thank all my wonderful current and past roommates, Sara Abbaspour, Dr. Arash Ghareh Baghi, Jimmie Hagblad, Vincent Hommersen, Gregory Koshmak, Elena Lisova, Kin Yun Lum, Branko Miloradovic, Mujtaba Aljumah, Mattias Olausson and Dr. Nikola Petrovic. It is a pleasure to share office with you.
I thank Prof. Maria Lind´en, the research leader for Embedded Sensor Systems for Health, for giving me this opportunity by hiring me and Prof. Em. Bertil H¨ok for making me take the leap to apply for a doctoral student position in the first place.
I also thank the rest of the ESS-H research group, Dr. Mobyen Uddin Ahmed, Shaibal Barua, Ass. Prof. Shahina Begum, Prof. Mats Bj¨orkman, Dr. Aida Causevic, Jiaying Du, Ass. Prof. Mikael Ekstr¨om, Dr. Hossein Fotouhi, Prof. Peter Funk, visiting Prof. Hamid GholamHosseini, Melika Hozhabri, Jonas Ljungblad, visiting Prof. Jos´e Fern´an Mart´ınez Ortega, Hamidur Rahman, Ass. Prof. Elisabeth Uhlemann, Dr. Maryam Vahabi,
Acknowledgements
Dr. Magnus Otterskog, Dr. Ivan Tomasic, visiting Prof. Miguel Angel Valero Duboy, Dr. Johan ˚Akerberg and Dr. Elaine ˚Astrand, for creating a very open and welcoming working environment.
LaTeX is an invaluable tool and I would like to thank Dr. Saad Mubeen, Ayhan Mehmed, Dr. Lars Hellstr¨om and Marina Guti´errez Lopez for inspiration about academic writing in LaTeX.
I belong to the Intelligent Future Technology division and I would like to thank Carl Ahlberg, Prof. Em. Lars Asplund, Dr. Baran C¸¨ur¨ukl¨u, Fredrik Ekstrand, H˚akan Forsberg, Henrik Johansson, Miguel Leon Ortiz, Dr. Farid Monsefi, Peter Ravenhold and Mirko Senkovski for wonderful discussions. Arash, Sara and Farid have really opened my eyes for the Iranian culture.
I would also like to thank Dr. Moris Behnam, Dr. Svetlana Girs, Prof. Hans Hansson, Ass. Prof. Damir Isovic, Ass. Prof. Rikard Lindell, Prof. Anatoliy Malyarenko, Prof. Thomas Nolte and Dr. Guillermo Rodriguez Navas, and anyone else I may have forgotten to list here, for almost always having time for a conversation. Guillermo taught me about plantar fasciitis and how to alleviate the pain and it was very helpful.
Our terrific administrators deserve a special thank you for their tireless work, especially Annika Havbrandt, Therese Jagestig Bjurquist, Carola Ryttersson, Susanne Fronn˚a, Malin ˚Ashuvud and Moa ¨Onell have been very helpful to me.
I am deeply grateful to all the esteemed volunteers who participated in my walk experiments. Besides other participants, that I have have already thanked above, I would also like to sincereley thank Sara Afshar, Mohammad Ashjaei, Lars Bark, Alessio Bucaioni, Simin Cai, Mirgita Frasheri, Pablo Guti´errez Pe´on, Leo Hatvani, Dr. Daniel Hedin, Linus K¨allberg, Ashalatha Kunnappilly, Prof. Bj¨orn Lisper, Filip Markovic, Dag Nystr¨om, Francisco Manuel Pozo P´erez, Apala Ray, Prof. Andreas Ryve, Dr. Antti Salonen, Irfan Sljivo, Dr. Jing Yue and Jiale Zhou, for taking their time to participate in my research experiments. Without your kindness I would not have been able to perform my research. Last, but not least, I owe a lot of gratitude to my dear family for all their support and love. My eminent wife Noelia Gutierrez Rodriguez and Anders, Ingrid, Julia, Joel and Aileen Hellstr¨om. This journey would never have been possible without you!
Per Anders Rickard Hellstr¨om V¨aster˚as, August, 2016
List of Publications
The following is a list of publications that
form the basis of this licentiate thesis
1Paper A
Intelligent Wireless Body Area Network System for Human Motion Analysis
Per Hellstrom, Lennie Carl´en Eriksson,
Jonatan Scharff Willners, Mia Folke, Martin Ekstr¨om
The First International Conference on Smart Portable, Wearable, Implantable and Disability-oriented Devices and Systems,
SPWID 2015, June 21-26, pages 37-40, 2015
Paper B
Wearable Weight Estimation System Per Hellstrom, Mia Folke, Martin Ekstr¨om
The Fourth International Conference on Health and Social Care Information Systems and Technologies, HCIST 2015, October 7-9, Procedia Computer Science, volume 64, pages 146-152, 2015
List of Publications Paper C
Walking Intensity Estimation with a Portable Pedobarography System
Per Anders Rickard Hellstrom, Anna ˚Akerberg, Martin Ekstr¨om and Mia Folke
The Thirteenth International Conference on Wearable Micro and Nano Technologies for Personalized Health, pHealth 2016, May 29-31, Studies in health technology and informatics, volume 224, pages 27-32, 2016
Paper D
Gait Velocity and Intensity Estimation Using the Impulse at Toe-Off
Per Anders Rickard Hellstrom, Anna ˚Akerberg, Martin Ekstr¨om and Mia Folke
Submitted to the Gait and Posture journal in August 2016
Contents
I Thesis
1
1 Introduction 3
1.1 Aim of the Research . . . 4
1.1.1 Research Questions . . . 4
1.2 General Research Methodology . . . 5
1.2.1 Mapping Research Questions to Research Activities . . . 6
1.3 Research Contributions . . . 6
1.3.1 Contributions of the Included Papers . . . 6
1.3.2 Research Contributions Mapped to Research Questions . . . 8
1.4 Thesis Structure . . . 9
2 Related Work 11 2.1 Background . . . 11
2.2 Commercial Systems Used in Research . . . 12
2.3 Systems Built by Researchers . . . 13
2.3.1 Sensor Types . . . 13 2.3.2 Sensor Integration . . . 14 2.3.3 Measured Quantities . . . 14 2.4 Summary . . . 15 3 System Design 17 3.1 System Requirements . . . 17
3.2 Choosing Force Sensor Type . . . 18
3.3 Insole Integration . . . 19
Contents
3.5 Summary of the System Design . . . 22
4 System Validation 23 4.1 Measurement System Analysis . . . 23
4.2 Experiments for Validation of the System . . . 26
4.2.1 Ethical Experiment Reflections . . . 27
4.3 Summary . . . 28
5 Discussion and Conclusion 29 5.1 Discussion . . . 29 5.2 Conclusion . . . 31 5.2.1 Future Work . . . 32 Bibliography 33
II
Included Papers
39
6 Paper A: Intelligent Wireless Body Area Network System for Human Motion Analysis 41 6.1 Introduction . . . 43 6.2 System Description . . . 44 6.2.1 Hardware . . . 44 6.2.2 Data Communication . . . 49 6.2.3 Analysis . . . 51 6.2.4 Initial Measurements . . . 51 6.3 Discussion . . . 51 References . . . 52 7 Paper B: Wearable Weight Estimation System 55 7.1 Introduction . . . 577.2 Methods . . . 58
7.2.1 The Measurement System . . . 58
7.2.2 Experiment . . . 59 7.2.3 Analysis . . . 61 7.3 Results . . . 61 7.4 Discussion . . . 64 7.5 Conclusion . . . 65 xiv
Contents
References . . . 65
8 Paper C: Walking Intensity Estimation with a Portable Pedobarography System 69 8.1 Introduction . . . 71 8.2 Methods . . . 72 8.2.1 Hardware . . . 72 8.2.2 Experiment Setup . . . 72 8.2.3 Data Analysis . . . 73 8.3 Results . . . 74 8.4 Discussion . . . 75 8.5 Conclusion . . . 78 References . . . 79 9 Paper D: Gait Velocity and Intensity Estimation Using the Impulse at Toe-Off 83 9.1 Introduction . . . 85 9.2 Study Description . . . 86 9.2.1 Experiment . . . 86 9.2.2 Hardware . . . 87 9.2.3 Analysis . . . 90 9.3 Results . . . 91 9.4 Discussion . . . 93 9.5 Conclusion . . . 94 References . . . 94
List of Tables
1.1 Relationship between research questions and activities. . 6 6.1 Comparison between the proposed system and similar
systems. . . 45 7.1 Test subject information. . . 60 7.2 Actual weight and estimated weight of each test subject,
with and without carried load, and the error. . . 62 8.1 Uncorrected impulse data (U) and corrected (C) impulse
data. Subject (S), walking speed (v), number of integ-rals (n), mean (m), standard deviation (SD), slope (k) and interception (i) for linear regression equation and R2are
List of Figures
3.1 From force sensor to data analysis. A block diagram for the current pedobarography system design, used in paper D. 21 4.1 Root cause and effect diagram for the measurement of
forces between foot and shoe. . . 25 4.2 Impulse data and corrected impulse data for subject 1
(84 integrals). Error bars represent 95% confidence interval (from paper C). . . 27 6.1 Sensor node prototype under construction. . . 46 6.2 Sensor node block diagram. . . 47 6.3 A is heel, B and C are on metatarsal pad and D is big toe
pad. . . 48 6.4 Body area network with 7 sensor nodes and a data sink. . 50 7.1 Central part of the measurement system. A and B connects
to the force sensors, C is adapter cards with amplifiers, D is IOIO-OTG for data acquisition, E is Bluetooth dongle, F is battery and G is the system case. The weight is 0.4 kg. 59 7.2 The left insole. The big toe pad sensor and temperature
sensor under the foot valve were not used in this study. . 60 7.3 Estimated weight [kg] on y-axis and actual weight [kg]
on x-axis. The dotted line is the ideal case. Least mean square resulted in the dashed line. . . 63 7.4 Estimation error [kg] on y-axis and actual weight [kg] on
x-axis. The mean absolute error is 15.9 kg, based on 361 equipoise samples. . . 64
List of Figures
8.1 Showing the selection of the integral limits for toe-off. The upper curve is the sum of the data from the big toe pad and the two metatarsal pad sensors. The filled area shows the force-time integral. It has the quantity impulse and the unit [Ns]. . . 73 8.2 A) Walking speed vs uncorrected impulse data for ten
subjects and three different speeds each. B) Walking speed vs corrected impulse data, by multiplication with the step frequency, for ten subjects and three different speeds each. 74 8.3 Impulse data and corrected impulse data for subject 1
(84 integrals). Error bars represent 95% confidence interval. 75 9.1 The four assembly stages of the insole. A) An EVA insole
is milled to remove pressure on the boundary of the active sensor area. B) The four force sensors are adhered to the EVA using double sided tape. C) A cork and leather layer improves the comfort for the user and protects the sensors. D) Insole inside shoe. . . 89 9.2 Showing the selection of the integral limits for the toe-off
impulse. The curve is the sum of the data from the big toe pad and the two metatarsal pad sensors. The black area is the analysed part of the force-time integral. It has the quantity impulse and the unit [Ns]. . . 90 9.3 The impulse data (with different corrections) vs the gait
velocity is only linear on an individual level. A) The integral impulse data corrected by multiplication with the step frequency vs gait velocity for 40 participants and five gait velocities. B) An additional correction for the body weight of the participants by multiplication of the data in A) with the ratio between an average body weight, set to 80 kg, and the body weight of the participant. . . 91 9.4 The individual R2values for the 40 participants are shown,
with the lowest being over 0.93. There is a linear relation-ship between the impulse at toe-off and the gait velocity on an individual level. . . 92 9.5 Corrected impulse data vs gait velocity for five gait
ve-locities for participant 1 is shown as an example. The relationships are linear on an individual level. . . 92
I
1
Introduction
Monitoring of personal health, at home or at work, is increasingly import-ant because we live longer and the cost for health care increases. There are of course lots of other potential advantages such as an improved quality of life, not having to be in the hospital or in a laboratory, and have the chance of early detection of health problems to enable preventive health measures.
The study of pressure fields acting between the plantar surface of the foot and a supporting surface, pedobarography (PBG), can be used in many applications. Examples are gait [1] and posture [2] analysis, footwear design [3], prosthesis evaluation [4], humanoid robotics [5] and sports biomechanics [6]. The Latin word pedes refers to foot while the Greek word baros refers to weight or pressure. Plantar direction means the surface below the ankle (e.g. the sole of the foot) that is directed towards the ground. PBG has in recent years also been used for providing feedback to correct movement asymmetry in stroke patients [7] and measuring gait symmetry in children with cerebral palsy [8].
The basic operation of foot pressure measurements is the translation of a mechanical vertical force by a sensor into an analogue electrical signal which is sampled to digital data for analysis. Pressure, in PBG, is the force acting perpendicular to the sensor surface divided by the active sensing area. The insole is the replaceable interior bottom of the shoe. Health is defined, by the World Health Organization (WHO), as a state of complete physical, mental and social well-being and not merely the absence of disease or infirmity. The main motivation to the research is
1. Introduction
that personal health monitoring (PHM), at least the physical part, can be done using a lot of different sensors to give an idea of risks related to health. An important subcategory within PHM is human motion analysis, which PBG is a part of. Force sensors built into shoes, to monitor the forces between the feet and insoles, can be used for many things related to health. PBG started back in the late 19th century but the field is not perfected yet and there are many scientific challenges left to solve.
1.1 Aim of the Research
The aim of the research in this licentiate thesis is:
”To design, build and evaluate a wireless wearable measurement system based on pedobarography for monitoring of health”.
This general aim can be broken down by defining research questions.
1.1.1 Research Questions
The first three RQs are on a higher level and helps forming a specification. RQ4 and RQ5 concern the practical implementation such as component choices.
RQ1 What parameters are interesting to measure and what level of performance and uncertainty is acceptable?
The most important is peak pressure but there are many others such as how long time the foot is in contact with the ground, time duration for different phases of the step and how the sum of all forces acting between the foot and insole moves during a step.
RQ2 What kind of test cases should be used to validate the system? PBG have been used for many things including clinical studies of posture, recovery after stroke and how cerebral palsy affects movement. Test case studies will instead involve volunteers from the university staff.
1.2 General Research Methodology RQ3 What kind of feedback or analysis is relevant to enable decision
making?
Measurements are not an end of themselves and should be used to make better decisions. Research after the licentiate thesis defence will be towards decision support systems. New analysis methods related to PHM are the first steps.
RQ4 What sensors and how many should be chosen to match the most important sensor properties?
Pressure can be measured with using many different types of sensors, e.g. resistive, capacitive, optoelectronic and piezo-electric. They all have different properties when it comes to physical size, energy consumption, sensitivity for change in temperature, dynamic response, non-linearity, durability and electrical stability.
RQ5 Where and how should the sensors and the wireless commu-nication be integrated?
There are many types of wireless communication including Bluetooth, ZigBee and WiFi.
1.2 General Research Methodology
The first step in the research method was literature studies to study related work. These studies enabled formulation of unsolved problems and to be able to formulate research questions. The literature studies were hopefully thorough enough to avoid repeating work that has already been done by others. As the research questions became more and more refined, there were additional literature studies done in more narrow fields. The research area is multidisciplinary and encompasses biomedical measurements, electronics and computer science.
Challenges appeared when battling the identified research questions and the work on solving these challenges yielded research results. The design of the measurement system became more and more detailed and the implementation changed over time. After a good enough solution to the general research problem had been found the solution had to be validated. For the validation of the answers to the research questions a deductive
1. Introduction
1.2.1 Mapping Research Questions
to Research Activities
This section shows the relationship between the research question (RQ) and the research activity (RA), see Table 1.1.
RA1 Read literature and write a State of the Art.
RA2 Find open problems and formulate research questions. RA3 Identify test case studies for system validation.
RA4 Interview end users of similar systems and identify important measurement parameters.
RA5 Visit conferences to network with researchers and companies. Discuss different component choices.
RA6 Design and build the first version of the system. RA7 Do measurements with selected test cases.
RA8 Evaluate and improve the system design, especially regarding sensor types and sensor locations.
RA1 RA2 RA3 RA4 RA5 RA6 RA7 RA8
RQ1 X X X
RQ2 X X X X
RQ3 X X
RQ4 X X X X X
RQ5 X X X
Table 1.1: Relationship between research questions and activities.
1.3 Research Contributions
This section is divided into two parts. The first part summarizes the research work in the included papers and which contributions the main au-thor, Per Hellstr¨om, has made. The second part maps these contributions with the research aim formulated in section 1.1.
1.3.1 Contributions of the Included Papers
This section presents the results of the included papers in this thesis and the contributions made by the main author, Per Hellstr¨om.
1.3 Research Contributions
Paper A
Wireless body area network system with nodes including IMUs and pos-sibility to connect external sensors.
Contribution by Per Hellstr¨om for paper A
Per have been responsible for the writing of the article and contributed to the part of the electronics related to the add-on card for external force sensors. He presented the article at the 1st International Conference on Smart Portable, Wearable, Implantable and Disability-oriented Devices and Systems (SPWID 2015).
Paper B
Design and implementation of a PBG measurement system based on commercial off the shelf components. Novel method for selecting meas-urement samples for weight estimation of carried load during walk. Contribution by Per Hellstr¨om for paper B
Per have been the main contributor and first author. He made part of the planning and was responsible for the measurements and analysis. Per designed and assembled the system. He presented the article at the 4th International Conference on Health and Social Care Information Systems and Technologies (HCIST 2015).
Paper C
The same system as in Paper B was used. This paper is a pilot study for Paper D. A novel method for relating the impulse at the toe-off phase of the step with the attained walking speed. The toe-off phase is the last phase after the heel strike and roll over phases of a step. This study included 10 participants and three walking speeds. The vital correction of the data by multiplying with the step frequency was introduced by the main advisor, Mia Folke.
Contribution by Per Hellstr¨om for paper C
Per was the main contributor and first author. He planned and was responsible for the measurements and the data analysis. Per presented the article at the 13th International Conference on Wearable Micro and Nano Technologies for Personalized Health (pHealth 2016).
1. Introduction Paper D
This study included 40 participants and five walking speeds to improve the certainty of the results in paper C. A new reference system for walking speed was used and a more comfortable version of insoles were designed. Milling away material around the active sensor area removed the possibil-ity for putting pressure on the boundary of the sensor area. This resulted in better durability of the sensors and removed the chance of exaggerated values. The data acquisition system changed from Android to Windows which improved the data transmission by being able to receive the data better.
Contribution by Per Hellstr¨om for paper D
Per was the main contributor and first author. He planned and was responsible for the measurements and analysis. He designed and as-sembled the new insoles and reference system. Per did smaller parts of the work regarding conversion of the software from Android to Win-dows and the automation of the calculations of the impulse integrals. The paper was submitted to the journal Gait and Posture in August 2016.
1.3.2 Research Contributions Mapped to
Research Questions
Paper A relates to RQ1 (interesting parameters to measure) and RQ5 (how the wireless data transfer will be done from the sensors). In Paper B the research challenges were associated with RQ2 (estimating carried weight during walk chosen as test case), RQ3 (analysing with novel method called equipoise), RQ4 (chose force sensing resistors and their placement) and RQ5 (wireless communication test). Paper C relates to RQ1 (toe-off impulse analysed in a novel way), RQ2 (the test case is estimating walking intensity) and RQ3 (a novel analyse method). In Paper D the research challenges were associated with RQ3 (a more automated version of the analysis, in Paper C the calculations of the integrals were done manually), RQ4 (the new insoles has the inner and outer sensors located wider apart to make the system better at handling users walking on the inside or outside of the foot) and RQ5 (a new way of implementing the sensors).
1.4 Thesis Structure
1.4 Thesis Structure
This section explains the structure of the rest of the thesis. Chapter 2
The next chapter presents related work. Commercial systems used in research are compared, followed by systems built by researchers divided into three themes. The three themes are sensor types, sensor integration and measured quantities. The chapter ends with a summary of the existing PBG systems.
Chapter 3
Chapter 3 motivates the choices that has been made regarding system design. Requirements are listed and choices of the force sensor type, the way of integrating sensors into shoe insoles and the type of wireless communication for the measurement data transfer are motivated. A summary of the current system design, used in paper D, is presented last. Chapter 4
This chapter shows the measurement system analysis and validation of the designed PBG system. The validation was done by using cross-sectional test case studies to validate that the system is capable of being used for monitoring of health. Reflections on ethical experiments is followed by a summary.
Chapter 5
The last chapter in the first part of this thesis presents the discussion, conclusion and future work. It discusses the research work that has been done and compares experiment results with other related research work. A conclusion of the research is made and the main research contributions are reiterated. The first part of this thesis ends in a look into different possibilities for future research within this research area.
Part two of the thesis consists of the four included publications that form the basis of this licentiate thesis.
2
Related Work
This chapter presents a background on PBG measurements, commer-cial PBG systems that are used in research, three topics on systems built by researchers followed by a summary with discussion on limitations in existing systems. The topics are sensor types, sensor integration and measured quantities. The discussed limitations are from the point of view of using the system for PHM.
2.1 Background
Transducers are devices that convert one form of energy into another, often between a physical quantity (e.g. pressure) and an electrical signal. Sensors can be seen as a subgroup within transducers. A sensor detects (senses) a change in its environment and provides a corresponding output. The SI unit for pressure is pascal (Pa) and a range up to around (0.8-1.0) MPa is often deemed to be enough in PBG research. A notable exception is design of footwear for diabetes patients where measured pressures of up to 3 MPa has been reported [3].
When placement of force sensors under the foot is discussed a metatarsal head (MTH) and pad are often mentioned. The metatarsal bones are the five bones in the foot that are closest to the bones in the toes. They are numbered with the first being closest to the big toe. The first MTH is at the end of the metatarsal bone closest to the big toe. Metatarsal pad is the plantar pad applying pressure to a MTHs. Gait, for humans, is defined as referring to the pattern of movement of the limbs that form
2. Related Work
the manner of walking. Three sub-phases of human gait are the heel strike, roll-over and toe-off phases. They are part of the stand phase while the movement in the air is called the swing phase. A commonly investigated parameter in PBG is centre of pressure (COP), which is the point of application of the vector that represents the sum of all forces acting between the foot and the insole.
An inertial measurement unit (IMU) is a device that is a collection of sensors where one of the more basic kinds is a 6-DOF IMU that has a 3-axis accelerometer and a 3-axis gyroscope. DOF stands for degrees of freedom. A 9-DOF IMU has an additional 3-axis magnetometer while a 10-DOF also includes a barometer.
2.2 Commercial Systems Used in Research
The two most used wearable PBG measurement systems, that offers wireless versions, are Novel’s Pedar™ (Novel GmbH, Munich, Germany) with capacitive sensors and Tekscan’s F-Scan™ (Tekscan Inc., Boston, MA, USA) with resistive sensors. These systems have been used in clinical trials, for example a study with Pedar™ about older people with metatarsalgia [9] and a study with F-Scan™ about evaluation of different kinds of prosthetic feet [10]. They are both matrix insole systems, i.e. they have in the order of hundreds of sensors placed in grids. These systems cost over 130.000 SEK for the wireless versions but an advantage is that the whole underside of the foot is covered by the sensors. The F-scan™ system measures up to 0.86 MPa and is 0.15 mm thick. Pedar™ measures up to 1.2 MPa and is 1.9 mm thick. Pedar had better performance than F-Scan in a validation and repeatability study [11]. The most popular wearable optoelectronic system in research is paromed’s paroTec™ (paromed GmbH & Co. KG, Heft, Germany). The system has up to 24 sensors in each insole and has the advantage of measuring propulsion and shear forces. This system is also in the price range of Pedar™ and F-Scan™ but saves the data locally since it lacks a wireless version. ParoTec™ has a smaller pressure range, up to 0.63 MPa, and its insoles are 3.5 mm thick [12]. Since sensors measures the average pressure on the sensor area, the highest pressures can be found with optical sensors on stationary devices where the resolution is decided by rays of light. Then the highest measured pressure has been measured to around 3 MPa on a person with foot problems related to diabetes [3].2.3 Systems Built by Researchers
2.3 Systems Built by Researchers
This section will be on the topic of design choices of PBG systems made by researchers. Consumers have increased access to monitoring of their physical activities with the help of products like step counters and activity bracelets with built in accelerometers [13]. PBG combined with accelerometers can approximate energy expenditure (EE) [14] and if the measurement system becomes cheap enough and has a friendly user interface it might become a successful commercial product. Commercially available systems for measuring the sizes of the forces are expensive and geared towards the research and orthopaedic markets.
2.3.1 Sensor Types
The four most common types of sensors, used for in-shoe measurements of force between the foot and the insole, are capacitive [15], piezoelectric [16], resistive [14, 16–22], and optoelectronic [23, 24]. A sensor converts the vertical mechanical force into another energy format, often to an electric analogue voltage which in turn is sampled into a digital signal and ana-lysed. The environment inside a shoe is fairly harsh as there will be a lot of mechanical stress, temperature changes and moisture. The sensors can be discrete or be used in an array [20] to cover a bigger surface. Important sensor properties are
• Low sensor height - a thick sensor can be uncomfortable and affect the measurement.
• Low sensitivity for temperature change - high temperature sensitivity requires thermal compensation.
• Lowhysteresis - high hysteresis gives different output at the same applied force depending on if it is during loading or unloading. • High linearity - low linearity requires more advanced calibration. • Good electrical stability - bad electrical stability means the signal
can be disturbed by interference.
• Gooddurability - bad durability gives the sensor a short operating life.
2. Related Work
2.3.2 Sensor Integration
Here the design choices are the amount of sensors, the location of the sensors and the choice of wireless communication such as Bluetooth, ZigBee or WiFi. More sensors means a bigger part of the foot is covered. The downside is increased cost, not only for the sensors but also for the increase in electronic circuitry and a higher power consumption. The location of the sensors are often dictated by the foot bones [2,4,14,17,25]. Sazonova et al. found an indication that only one shoe needs to be equipped with sensors for measurements such as classification of postures and activities [14]. Sazonov et al. showed that recognition of posture and activities could be performed using only one acceleration and one pressure sensor [2]. The heel, the MTH and big toe are often chosen as locations for the sensors because the highest peak forces are registered there due to the foot’s bone structure.
2.3.3 Measured Quantities
The sensors measure forces normal to the surface which means it is approximately the vertical ground reaction force (GRF). The GRF is the force exerted by the ground (insole) on a body (foot) in contact with it. Mean plantar pressure [17, 26], peak pressure [26], COP [4, 26] and shift speed of COP [26] can be analysed. Walking requires a pressure range up to around 1 MPa while more extreme pressures reach up to around 3 MPa [3]. Ground contact duration, contact area, force-time integral (FTI) [27] and the arch index of the foot are also of interest for researchers.
The EE can be approximated if the travelled distance is known and the step length can be estimated using accelerometers but the inherent drift in the accelerometer makes it hard to get a good estimation of step length [28].
Classification of different forms of physical activities is also possible, with the help of accelerometers and PBG, for the following cases: standing [14, 20], sitting [14,20], walking [14,20,29], cycling [14], ascending stairs [29], descending stairs [29] and jogging [29]. The classification is made by using support vector machines (SVM) or other machine learning techniques.
2.4 Summary
2.4 Summary
The application of the measurement system decides which sensor prop-erties that are most important and by looking at the different types of available sensors a design choice can be made. The most commonly used types in research today are in descending order: resistive, capacitive, optoelectronic and piezoelectric. The bones in the foot dictates where the biggest forces will be between foot and insole, at least for healthy feet. The most commonly chosen locations are heel, MTHs {1, 5}, {3} and {2, 4} (1 and 5 are most common, counted from the side of the big toe as number one) and the pad of the big toe. The most important parameter to measure is peak force (peak pressure multiplied by the sensor area).
3
System Design
This chapter deals with the choices regarding the PBG system design after listing the requirements. Motivations are made for the choices of force sensor type, insole integration method and type of wireless communication. Weaknesses that are discovered in the system during verification and validation lead to design changes iteratively.
3.1 System Requirements
An iterative approach to the design of the system was made because it is not trivial to list all the requirements or give a very detailed specification of the system when a broad range of applications can be imagined. Putting the user of the system first is a good first step. The insoles should be comfortable and this means the insoles should feel similar to normal insoles. Perspiration of the foot should not increase and the insole thickness should be around 5 mm thick to leave normal space left for the foot. The force measurement range should be big enough to not peak during moderate physical activity, such as jogging. The sampling rate of the data from the force sensors was chosen to be 200 Hz, which is higher than the average sampling rate in wireless PBG systems used by researchers. Other general requirements are high reliability (especially the durability of the force sensors), ease of use, a battery life time of at least around one day. All at an affordable price point to make the design a valid choice for PHM. A basic risk analysis was made were it was found that the advantages (early warning/notice about health issues, flexible
3. System Design
monitoring of the user out of the hospital or orthopaedic laboratory) were greater than the potential disadvantages (a feeling of being under surveillance, privacy and data storage). In the end design choices need to be made and sometimes it could have gone either way, like when choosing between Bluetooth and ZigBee for the wireless communication.
3.2 Choosing Force Sensor Type
Different types of discrete force sensor types all have advantages and disadvantages. The most common are resistive, capacitive, optoelectronic and piezoelectric. The selection of a force sensor often means a trade off between factors like range, sensitivity, sensor area and power consumption [30]. The sensor thickness is crucial when it comes to integrating the sensor in a insole that is comfortable for the user. A design choice was to have four discrete sensors integrated in the insole since it is the least amount that is still favoured in PBG research. A thin sensor makes it easier to keep the insole reasonable thick.
Optoelectronic force sensors have many advantages such as not being affected by changes in temperature or electromagnetic interference. How-ever, there are no commercially available discrete optical sensors that are good enough for use in insoles since even customized ones are over 5 mm thick and have a very limited pressure range.
Piezoelectric sensors are not very common nowadays in PBG. When comparing the two remaining types, capacitive and resistive, it shows that capacitive sensors are thicker and are more sensitive to electrical disturbance but are better at measuring static forces.
The thinnest available sensor type is the force sensing resistor and it is also the most cost effective choice. The force sensing resistor was chosen since it has an attractive mix of properties without any major disadvantages. After comparing sensor models from different companies the FlexiForce series, models ESS301 and A401, from Tekscan was chosen because of slightly better linearity, durability and dynamic response. They even offer a version that tolerates up to 95% humidity, which is a welcome bonus. Feet are well known to perspire a lot, especially during physical activity. The sensors are 0.2 mm thick and have circular sensor areas. ESS301 has an active sensor area diameter of 9.5 mm while A401’s is 25.4 mm. The calibration should be redone if the application is changed [31] and a dynamic calibration load should be used if the application is related to
3.3 Insole Integration movement [32], at least for the force sensing resistor (FSR). The reason is a static force makes the output of the sensor drift over time.
3.3 Insole Integration
Force sensing resistors needs a firm foundation but it should also be a bit flexible to be able to move with the deformation of the shoe. Polyurethane was chosen for the first version of the insoles. The material is light, durable and water resistant and is a common choice for insoles. An ergonomic shape with support for the foot valve was chosen and purchased in an orthopaedic store. The sensors were adhered on top of the insole with double sided tape and the cables were hidden away from the sole of the foot to make it more comfortable but also protect the cables from mechanical stress. The design turned out to have some drawbacks. The polyurethane increased perspiration form the foot and the foot valve support made them uncomfortable for people with tendency to having a low foot arch. The system output also had a tendency to peak to maximum value and several sensors had to be exchanged after the experiments in paper B and paper C.
A second version of the insoles was used in paper D. Ethylene-vinyl acetate (EVA) was chosen as the base material since it is good at absorbing physical shock and is easier to mill in than polyurethane. It is a commonly used insole material and it is also water proof. A cork and leather layer, model 6949 (BNS Bergal, Nico & Solitaire, Vertriebs GmbH, Mainz, Germany) was put between the sensors and the feet. The layer improved the comfort for the user by reducing the perspiration and also protects the sensors better from being damaged. Calibration of the sensors were made after the cork and leather layer was added. The integration of the sensors was also improved by only putting pressure on the sensing area. This was done by milling around the sensing area in the PVA to simply remove the possibility to put pressure on the boundary of the sensor. The boundary of the sensor can be short-circuited otherwise and besides resulting in much too high data readings it can also damage the sensors and reduce them to only show zero or maximum force readings.
3. System Design
3.4 Wireless Communication
Another of the design considerations is if it is best to put the wireless communication inside the insole or not [33]. An advantage with putting it inside the insole is improved usability but a drawback is that the line of sight for the wireless transmission is broken which means a harsher environment for the data communication. Bluetooth, ZigBee and WiFi were considered for the wireless data transmission. WiFi was not chosen because it uses more energy and it is desirable to have a long operating time before changing or charging battery. It has to be mentioned that WiFi has better bandwidth and operating range. Frequency hopping makes is hard to eavesdrop on Bluetooth traffic and Bluetooth data is time stamped. An advantage with ZigBee is that it is much easier to connect more than eight nodes together in a body area network. Bluetooth was chosen, partly because of the potential for longer battery life time with Bluetooth low energy (BLE), which has microampere usage in deep sleep mode.
The body area network system presented in paper A had a bit of per-formance issue when a sampling rate over 30 Hz was used. IOIO-OTG (SparkFun Electronics Inc., Niwot, CO, USA) was chosen as a temporary solution for data acquisition and wireless data transmission. It is a small data acquisition system based on a PIC microcontroller and sends the data to an Android tablet using a LogiLink Bluetooth 4.0 dongle with chipset CSR BC8510 (CSR plc, Cambridge, UK). The Android applic-ation IOIO Meter Voltage Measurement version 1.1.0 (Johannes Rieke, available from Google Play) recorded the data.
Downsides with this temporary solution is that the Bluetooth protocol is not fully implemented and the device is not optimized for energy efficiency. The Android tablet turned out to be a bit slow in receiving data when using the full available bandwidth and to improve the situation a Windows version of the Android application was modified. This made it possible to use a powerful Microsoft Surface Pro 2 instead which improved the data throughput, see paper D for more details. An overview of the measurement system used in paper D is shown in Figure 3.1. Previous version of the system used model ESS301 instead of A401, an Android tablet instead of Windows, and data analysis in Graph instead of R script.
3.4 Wireless Communication
Figure 3.1: From force sensor to data analysis. A block diagram for the current pedobarography system design, used in paper D.
3. System Design
3.5 Summary of the System Design
The improved system design, that was used in paper D, is as follows. A shoe insole with a base foundation, made out of ethylene-vinyl acetate (EVA), was chosen to have a firm yet flexible surface for the force sensors. Force sensing resistors from the FlexiForce series, models ESS301 and A401, (Tekscan Inc., Boston, MA, USA) were used. A layer of cork and leather protects the sensors and also makes the insoles more comfortable to use. An IOIO-OTG (SparkFun Electronics Inc., Niwot, CO, USA) sampled the data after an amplifying stage and then sent it via a Bluetooth dongle. The IOIO-OTG is based on a PIC microcontroller.
4
System Validation
This chapter presents an analysis of the measurement system and the three studies (two different test cases) that were used for validating that the system actually can be used for monitoring of health. Two types of cases were performed to valditate that the system can be used for monitoring related to health. The first case (study in paper B) was monitoring of carried weight and the second case (studies in paper C and D) was monitoring of the physical intensity level during walk.
4.1 Measurement System Analysis
Verification of the system showed that pressure up to 1.2 MPa was possible to measure when the system calibration was optimized for high range measurements. The mean relative error was around ±5% with ±20% limits at 95% confidence interval. The amplification of the signal and the calibration have to take the actual system usage into account. Lower amplification increases the maximum possible pressure to be measured but the current through the sensor increases and should not be higher than 2.5 mA to avoid heating and damaging the sensor. Walking experiments were chosen (dynamic gait) and the amplification was chosen as high as possible but to not saturate the system when a 120 kg subject walked in 2.0 m/s. The calibration method should imitate the way the sensor is used in and thus a dynamic load was used for calibration since dynamic gait was studied. A load cell (up to 5 kg) and an electronic scale (up to 70 kg) were used for calibration of the system. The load cell and
4. System Validation
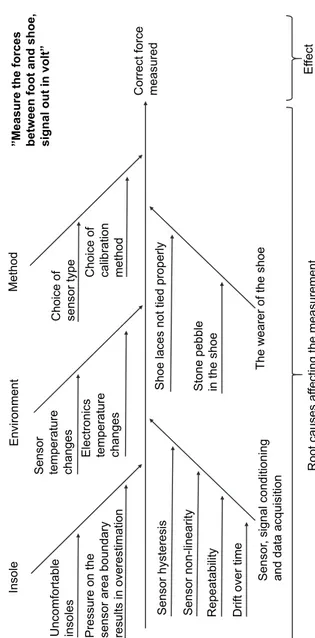
electronic floor scale were calibrated against weights which in turn were calibrated against a scale with traceability to the Swedish standard for weight measurements. Finding the largest sources of uncertainty in the measurement system and then reducing them until the system works good enough is an efficient approach. A root cause and effect diagram is shown in Figure 4.1. In this case the weakest link is the sensor itself. The hysteresis and linearity are the largest errors and can be partially accounted for with calibration but the usage must give clear information of if the sensor is in the loading or unloading phase. Another major influence is if the wearer of the shoe ties the shoe laces without tightening enough to keep the foot from moving around inside the shoe.
4.1 Measurement System Analysis Correct force measured R oo tc au se s af fe ct in g th e m ea su re m en t Insole
Sensor temperature changes
Method
Sensor
, signal conditioning
and data acqui
sit ion Ef fect Environment Th e w ea re ro ft he s ho e Sensor non-line ari ty Repeatability
Sensor hysteresis Drift over time Electronics temperature changes
”Measure the forces between foot and shoe, si gn al o ut in v ol t” Shoe laces not tied properly Pressure on the se ns or a re a bo un da ry results in overestimation
Stone pebble in the shoe Choice of sensor type
Choice of calibration method
Uncomfortable insoles
Figure 4.1: Root cause and effect diagram for the measurement of forces between foot and shoe.
4. System Validation
4.2 Experiments for Validation
of the System
Two use cases were chosen to validate the measurement system. Walking conditions are very suitable since there is an inherent drift in sensor output when static force is applied on force sensing resistors.
The first experiment, with ten volunteers from the university staff carrying two different weights, was done in paper B and used a novel analysis method (by Per Hellstr¨om) for measuring carried weight while walking. The analysis method is based on selecting samples for estimating the weight by looking at the ratio between the pressure on the heel sensor compared to the two MTH sensors. During every step the ratio passes 0.5 only once. An equipoise value of 0.5 means there is an equal pressure distribution between the forward and rear of the foot. The values for each step in the range of 0.4 to 0.6 were used for estimating the weight and then an average over ten steps was used.
The system can detect carried loads but has a tendency to overestimate them. Two possible reasons are the previously mentioned force on the boundary of the sensor area and also an analysis made very sensitive by using peak value samples instead of averaging around the peak. A better approach would probably be to use force-time integrals, like in paper C and D.
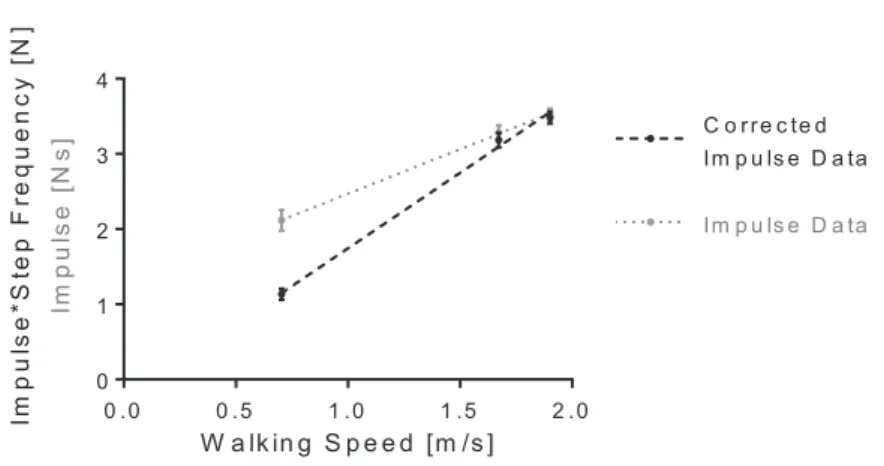
The second use case was monitoring the physical intensity in walk. The novel analysis of the physical intensity used force-time integrals at the toe-off phase. The right side of the integral is at the time the peak from the big toe sensor is measured. The left side of the integral is 50 ms before this maximum. The integral represents the impulse, unit Ns, but a correction by multiplication with the step frequency is needed to get a linear relationship between the system output and the gait velocity, see Figure 4.2. This velocity can then be categorized into different walking intensities [34].
4.2 Experiments for Validation of the System 0 .0 0 .5 1 .0 1 .5 2 .0 0 1 2 3 4 W a lk in g S p e e d [m /s ] Im p ul se* S tep F re qu enc y [N ] Im p u ls e [N s] Im p u ls e D a ta C o rre c te d Im p u ls e D a ta
Figure 4.2: Impulse data and corrected impulse data for subject 1 (84 in-tegrals). Error bars represent 95% confidence interval (from paper C).
Paper C is a pilot study for paper D. Experiments in paper C were done with 10 participants and in three different walking speeds. In the study in paper D the number of participants was increased to 40 and five different walking speeds.
4.2.1 Ethical Experiment Reflections
Local regulation at Swedish universities entails that a regulatory authority does not need to approve of the research as long as it is done on voluntary employees of the university. The data has to be stored for 10 years and the data has to be erased if a participant wants to have it removed. Assessments were made regarding if the experiments would affect the volunteers physically and/or mentally. There was no risk for getting hurt mentally since we only analyse the performance of the system, and not the performance of the individuals. Walking and carrying light weights were also considered safe. Every effort was made to conduct the experiments in a safe way. Great care was taken to protect the spine from the up to 10 kg heavy weight in the backpack, when carried weights were studied.
4. System Validation
4.3 Summary
Two types of cross-sectional case studies were used for validation of the system. The first was estimation of carried weight and the study showed that the system can be used to estimate carried weight but there is a tendency to overestimate the loads. The second validation case investigated correlation between the impulse at the toe-off phase of the step with the walking speed and included a pilot study. The pilot study enlisted 10 volunteers, walking in three different speeds, from the university staff. The last study expanded to 40 participants and they walked in five different speeds. Both studies found a linear relationship between the output of the system and walking intensity expressed as walking speed on an individual level.
The results of the studies shows that the designed PBG system is moving in the right direction towards aim of the research.
5
Discussion and
Conclusion
The last chapter includes a discussion comparing results in this thesis with other related work, a conclusion of the main contributions of this thesis and a look at possible directions for future research.
5.1 Discussion
The work in this thesis presents the first complete information on how to build a wireless PBG system that can be built using only commercial off the shelf products.
The sensor integration in paper D is novel as it imitates the spacer (disc) calibration technique recommended by the manufacturer. The spacer function in the insole (paper D) is hidden under the sensor instead of on top to make the insole comfortable. This was made by milling in the insole material to avoid putting pressure on the boundary of the sensor area. No other researcher has reported to consider this feature when designing their insoles. Pressure on the boundary of a force sensing resistor results both in a shorter lifetime for the sensor and a dramatically increased output.
Two test cases, solving scientific problems, were chosen to validate the system. The first test case estimates carried weight while walking and the second case estimates physical intensity during walk.
5. Discussion and Conclusion
Heavy working conditions is a risk factor for health and thus warrants a way to monitor carried weight (the first test case). Sazonova et al. has reported an average root mean square error of 10.5 kg when measuring body weight [33]. A novel method for estimating carried weight, presented in paper B, resulted in an average overestimation of 16.7 kg. Both systems included force sensing resistors. This kind of sensor has a drift of the sensor output over time when a static force is applied and two different approaches were used to work around this. Sazonova et al. chose to use measured data collected directly after coming to a standstill after walking, while the approach in paper B used the equipoise method. An equipoise value of 0.5 means there is a balance between the force on the heel sensor compared to the sum of the two MTH sensors. An advantage with the equipoise method is that measurement can be done while moving and not just when standing still. A drawback with the equipoise system is that it needs to be calibrated with the body weight before carried weight can be estimated.
Physical activity reduces the risk of several diseases [35]. The intensity of the physical activity can be categorized into different walking intens-ities [34]. The physical activity level increases if a weight is carried but there is a lack of measurement systems that can account for this increase. Peak pressures in the heel, medial forefoot and toes have been found to show a relationship with walking speed by Warren et al. [36]. Estimation of physical activity intensity (the second test case), expressed as walking speed, was treated in paper C (pilot study) and paper D. The main idea was to calculate the impulse at toe-off, in the last phase of the step, and relate it to the walking speed. A novel correction of the data, by multiplication of the impulse with the step frequency was introduced in paper C. Paper C showed that the relationship between the system output and walking speed was linear on an individual level. R2
values were over 0.98 for the 10 participants for three different walking speeds. Paper D had three R2 values under 0.96, but all over 0.93, for
40 participants and five different walking speeds. The lower R2values
were not so surprising because of the extended experiment compared to paper C. The calculations of the impulse was not possible for all steps but was improved from 83.1% in paper C up to 96.6% in paper D. The improvement in performance was partly done by changing from a more weakly performing Android tablet to a Windows tablet with better performance. The software was ported from an Android application to a Java program for Windows and the data buffering performance was
5.2 Conclusion improved by rewriting the monitoring preview graph in a more efficient way. One hope, that was foiled, was to be able to have a more general model for the linearity for all individuals together. Correction for more factors, other than step frequency, was tried to have the individually linear equations line up with the same slope. Body weight, height, total leg length, lower leg length, upper leg length and foot size were examined, but the improvement was marginal at best, see paper D. Comparing the work made by Warren et al. with the results in paper C and D is hard because of differences in study design and presentation of the results. Warren et al. looked at the full surface between foot and shoe and showed that some regions had positive differences in peak pressure between slow and fast walking speeds.
Ferrari et al. used IMUs to measure the stride velocity with a mean error of -0.41 cm/s and with an lower standard deviation limit of -11.49 cm/s and an upper standard deviation limit of 10.67 cm/s [37]. Paper D used PBG and resulted in an estimated mean error of -3.4 cm/s for the gait velocity and a standard deviation of 13.8 cm/s. Averaging for five steps resulted in a SD of 9.9 cm/s. The two different approaches shows similar results. A drawback with the PBG system is that it needs to be calibrated, for example by using a slow and a fast gait velocity, to determine the relationship between gait velocity and the system output.
5.2 Conclusion
A pedobarography system has been built which has shown to be able to estimate the carried weight and physical intensity level expressed as walking speed. These are the key contributions:
1) Design and implementation of a pedobarography measurement system based on commercial off the shelf components. Relates to the design of the pedobarography system.
2) A solution for implementing force sensing resistors in insoles while protecting the boundary of the sensor area. Relates to the design of the pedobarography system.
3) Novel method for selecting data for weight estimation of carried load during walk. Novel method related to health monitoring.
5. Discussion and Conclusion
4) A novel method describing the relationship between the impulse at the toe-off phase of the step with the walking speed. Novel method related to health monitoring.
The research results suggest that the new pedobarography system, in combination with the two novel analysing methods, are suitable for use in wearable systems for monitoring of health.
The information on how to build a PBG measurement system, by using commercial off the shelf components, is now available. The sensor area boundary should be considered carefully when designing insoles to improve the durability of the sensor and to perform correct measurements. The new methods for monitoring carried weight and the level of intensity in walk adds two new pieces to the scientific puzzle. There is a possibility for a product for consumers who want to monitor their physical activity.
5.2.1 Future Work
Measurements in PHM are done to help making a decision and not only for the sake of monitoring in itself. Future work will thus strive towards designing different decision support systems. Three interesting future research directions are
(1) Monitoring of posture to give decision support about the ergonomic situation. This could help prevent health problems because of having a bad posture.
(2) Early detection of balance problems to trigger physical training to counter fall risk.
(3) Combine pedobarography with IMUs, to be able to better categorize physical activities, using machine learning (e.g. using a support vector machine (SVM)).
There is also potential for developing a consumer product for monitoring of physical activity.
Bibliography
[1] S. Crea, M. Donati, S. M. M. De Rossi, C. M. Oddo, and N. Vitiello, “A wireless flexible sensorized insole for gait analysis,” Sensors, vol. 14,
no. 1, pp. 1073–1093, 2014.
[2] E. Sazonov, G. Fulk, J. Hill, Y. Schutz, and R. Browning, “Monitor-ing of posture allocations and activities by a shoe-based wearable sensor,” Biomedical Engineering, IEEE Transactions on, vol. 58, no. 4, pp. 983–990, 2011.
[3] A. J. Boulton, C. I. Franks, R. P. Betts, T. Duckworth, and J. D. Ward, “Reduction of abnormal foot pressures in diabetic neuropathy using a new polymer insole material,” Diabetes Care, vol. 7, no. 1, pp. 42–46, 1984.
[4] T. Lawrence and R. Schmidt, “Wireless in-shoe force system [for motor prosthesis],” in Engineering in Medicine and Biology Society,
1997. Proceedings of the 19th Annual International Conference of the IEEE, vol. 5, 1997, pp. 2238–2241.
[5] A. Konno, N. Kato, S. Shirata, T. Furuta, and M. Uchiyama, “De-velopment of a light-weight biped humanoid robot,” in IEEE
Inter-national Conference on Intelligent Robots and Systems, vol. 3, 2000,
pp. 1565–1570.
[6] E. Eils, M. Streyl, S. Linnenbecker, L. Thorwesten, K. V¨olker, and D. Rosenbaum, “Characteristic plantar pressure distribution patterns during soccer-specific movements,” American Journal of
Bibliography
[7] I. H. Khoo, P. Marayong, V. Krishnan, M. N. Balagtas, and O. Rojas, “Design of a biofeedback device for gait rehabilitation in post-stroke patients,” 2015 IEEE 58th International Midwest Symposium on
Circuits and Systems (MWSCAS), pp. 1–4, 2015.
[8] T. Zhang, J. Lu, G. Uswatte, E. Taub, and E. S. Sazonov, “Measuring gait symmetry in children with cerebral palsy using the smartshoe,”
2014 Health Innovations and Point-of-Care Technologies Conference Seattle, Washington USA, October 8-10, 2014, pp. 48–51, 2014.
[9] B. C. Chang, D. H. Liu, J. L. Chang, S. H. Lee, and J. Y. Wang, “Plantar pressure analysis of accommodative insole in older people with metatarsalgia,” Gait Posture, vol. 39, no. 1, pp. 449–54, 2014. [10] V. Agrawal, R. S. Gailey, I. A. Gaunaurd, C. O’Toole, A. Finnieston, and R. Tolchin, “Comparison of four different categories of prosthetic feet during ramp ambulation in unilateral transtibial amputees,”
Prosthet Orthot Int, vol. 39, no. 5, pp. 380–9, 2015.
[11] C. Price, D. Parker, and C. Nester, “Validity and repeatability of three in-shoe pressure measurement systems,” Gait Posture, vol. 46, pp. 69–74, 2016.
[12] K. J. Chesnin, L. Selby-Silverstein, and M. P. Besser, “Comparison of an in-shoe pressure measurement device to a force plate: concurrent validity of center of pressure measurements,” Gait Posture, vol. 12, no. 2, pp. 128–33, 2000.
[13] B. H. Dobkin and A. Dorsch, “The promise of mhealth: Daily activity monitoring and outcome assessments by wearable sensors,”
Neurorehabilitation and Neural Repair, vol. 25, no. 9, pp. 788–798,
2011.
[14] N. Sazonova, R. C. Browning, and E. Sazonov, “Accurate prediction of energy expenditure using a shoe-based activity monitor,” Medicine
and Science in Sports and Exercise, vol. 43, no. 7, pp. 1312–1321,
Jul 2011.
[15] O. Mazumder, A. Kundu, and S. Bhaumik, “Development of wireless insole foot pressure data acquisition device,” in Communications,
Devices and Intelligent Systems (CODIS), 2012 International Con-ference on, 2012, pp. 302–305.
Bibliography [16] S. Morris and J. Paradiso, “Shoe-integrated sensor system for wireless gait analysis and real-time feedback,” in Engineering in Medicine and
Biology, 2002. 24th Annual Conference and the Annual Fall Meeting of the Biomedical Engineering Society EMBS/BMES Conference, 2002. Proceedings of the Second Joint, vol. 3, 2002, pp. 2468–2469.
[17] M. Chen, B. Huang, K. K. Lee, and Y. Xu, “An intelligent shoe-integrated system for plantar pressure measurement,” in Robotics
and Biomimetics, 2006. ROBIO ’06. IEEE International Conference on, 2006, pp. 416–421.
[18] S. Corbellini, C. Ramella, C. Fallauto, M. Pirola, S. Stassi, and G. Canavese, “Low-cost wearable measurement system for continuous real-time pedobarography,” in 2015 IEEE International Symposium
on Medical Measurements and Applications (MeMeA) Proceedings.
Ieee, May 2015, pp. 639–644.
[19] Y. Wahab, A. Zayegh, R. Veljanovski, and R. Begg, “Micro-sensor for foot pressure measurement,” in TENCON 2008 - 2008 IEEE
Region 10 Conference, 2008, pp. 1–5.
[20] R. Adelsberger and G. Troster, “Pimu: A wireless pressure-sensing imu,” in Intelligent Sensors, Sensor Networks and Information
Pro-cessing, 2013 IEEE Eighth International Conference on, 2013, pp.
271–276.
[21] R. Lvping, L. Deyu, L. Chengrui, Y. Yang, Q. Yajun, Y. Songyan, P. Fang, and N. Haijun, “Design of in-shoe plantar pressure monitor-ing system for daily activity exercise stress assessment,” in
Biomed-ical Engineering and Informatics (BMEI), 2011 4th International Conference on, vol. 3, 2011, pp. 1367–1370.
[22] R. Karkokli and K. McConville, “Design and development of a cost effective plantar pressure distribution analysis system for the dynamically moving feet,” in Engineering in Medicine and Biology
Society, 2006. EMBS ’06. 28th Annual International Conference of the IEEE, 2006, pp. 6008–6011.
[23] M. Donati, N. Vitiello, S. M. De Rossi, T. Lenzi, S. Crea, A. Per-sichetti, F. Giovacchini, B. Koopman, J. Podobnik, M. Munih, and M. C. Carrozza, “A flexible sensor technology for the distributed