1
Technical and economic
assessments of CO
2
capture
processes in power plants
2
Acknowledgment
This work has been developed during spring semester of the academic year 2007/2008 at Mälardalens University (Västerås – SW). I would like to thank my examiner at Mälardalens University, Professor Jinyue Yan for his suggestions, patience and encouragements during this period. A special thanks to my examiner at University of Perugia, Professor Umberto Desideri, to have given to me the opportunity to study abroad. All of my gratitude is for my family to have supported me in these years.
3
Thesis Outline
The aim of this work is to make a techno – economic evaluation of pulverized coal fired power plant whit different CCS (carbon capture and storage) techniques. The comparison has been performed since the traditional PC power plant, to oxyfuel CO2 capture system and post-combustion CO2 removal system (MEA scrubbing). The net electricity efficiency comparison, as expected, gives lower value for CCS power plant than reference power plant. To do the costs comparison is following three steps: the first is a simple comparison between the CoE (Cost of Electricity) in this way has been possible to evaluate the CO2 avoidance cost; the second step has been to introduce the ETS (emission trading scheme) and its benefits in the financial – economic context, the third as been to introduce also the external costs to reach an open view about the total costs. The thesis is divided in chapter, the background talks about CCS technologies and it gives an overview about different opportunities, since capture methods to storage techniques and costs; the followed section (Chapter 2 and 3) talks about Oxyfuel Combustion CO2 capture system and MEA scrubbing CO2 capture system and their respective key elements and technical opportunities to reach the maximum integration level. In the followed chapters are shown the different case studies:
Chapter 4: 360 MWel lignite fired power plant (Greek), whit and without oxyfuel carbon dioxide capture.
Chapter 5: 865 x 2 MWel pulverized coal PP, also in this case the CCS technology deployed is oxyfuel combustion.
Chapter 6: the power plant examined is a 740 MWel gross power output, advanced supercritical pulverized fuel air fired and oxy-combustion with CO2 capture
Chapter 7: a 550 MWel coal fired power plant is investigated, as traditional supercritical power plant, whit oxyfuel combustion CO2 capture system and with Ecoamine scrubbing CO2 removal system.
Chapter 8 talks about emission trading schemes and in particular regarding EU-ETS (European Union – Emission Trading Scheme). A general overview about this administrative tool is given, as well as an analysis of the results from the first period of the allowances market and its implementation in the near future. In the Chapter 9 is introduced the external cost concept, its implementation in greenhouse gas emissions and also carbon dioxide geological storage. As result, this two chapters have given a potential economic data about emissions avoided and captured (stored). Chapter 10 talks of technical assessments, showing energy performances and emissions reductions. In the Chapter 11 the cost analysis is made, introducing the EU-ETS effects and the internalization of external costs in the different scenarios hypothesized, a final evaluation of percentage differences of CoE in the different scenarios gives the opportunity to compare different power plant with data from different year. The final Conclusions give some advices and potential solutions for further studies.
4
Objective and Methodology
It has been followed three steps to give a large view about the price and the environmental implications about power generations and the actually available way to reduce the greenhouse gas emissions. To achieve the aim of this work the first request has been to collect the data about power plant in which are also deployed the CO2 removal systems. For each couple (reference PP – CCS PP) of power plants are shown the principal technical data and the emission values, a first technical and emission comparison between each plant of the couple is made. After collecting data, it has proceed to make a first pure economic evaluation only between relatives CoE (Cost of Electricity) and it has been shown the trend of it, tied to the efficiency of power plant and the size of it. The percentage differences between CoE from the same couple of plants are calculated.
The second step has been to introduce the European Union Emission Trading Scheme (EU-ETS), as a concept through which is possible to control the greenhouse gas emissions by providing economic incentives. In this case the price of the carbon dioxide not emitted could play a significant role to achieve the European goals ordered from Kyoto Protocol. The price of emissions avoided (therefore became quota available to sell) combined with the value of specific emission avoided can give a potential decrease of the CoE for the power plant with CCS.
In the third analysis has been introduced the approach based to the external costs referred to the emissions avoided and also the part about the geological storage, that played a negative role respect the economy of emissions avoided, but its contribute is very low. After the introduction of the effects of emission trading scheme, the potential introduction of some tools (e.g. carbon tax, etc.) to internalize the external costs of greenhouse gas emissions can give a new contribute to decrease the CoE for power plants with CCS.
The cost studies has been performed taking under investigation one case study at a time, following this way has been avoided the problem related the value of money in different time. Therefore for each case, as time reference has been taken the year when the study about power plant was performed; the other economic values (EU –ETS allowance price and external cost esteem) have been updated to the reference year. Surely this way can not give an exact result, but can show the opportunities related to a rational way to continue to use fossil fuel. It has been chosen to update the economic data (EU allowances and external costs) to the respective years when the reference study was performed, because updating the CoE to other years the error made is surely higher, since the CoE is strongly connected to the fuel price that is too uncertain.
The discussion about the results given by the technical and economic-financial analysis, combining all of the three tools shown above is possible to reach a large overview about a new Cost of Electricity generated from power plant with CCS systems.
5
Table of Contents
Acknowledgment ... 2
Thesis Outline ... 3
Objective and Methodology ... 4
1. Background... 7
1.1 Co2 Capture Technologies ... 8
1.1.1 Post Combustion Capture ... 8
1.1.2 Pre Combustion Capture ... 8
1.1.3 Oxyfuel Combustion ... 8
1.2 CO2 Transport ... 9
1.3 CO2 Storage ... 9
1.3.1 Geological Storage ... 9
1.3.2 Ocean Storage ... 11
1.3.3 Mineral Carbonation and industrial uses of CO2 ... 12
1.4 CCS cost and economic potential ... 12
2. Oxy-fuel Combustion Capture System... 13
2.1 Oxy-fuel indirect heating – steam cycle ... 13
2.2 Oxy-fuel direct heating – gas turbine cycle ... 14
2.3 Oxy-fuel direct heating – steam turbine cycle ... 15
3. MEA scrubbing CO2 Capture system... 16
4. Greek lignite-fired power plant (360 MWel) ... 19
4.1 Simulation data of Reference Power Plant ... 19
4.2 Simulation data of Greenfield Oxyfuel Power Plant ... 21
4.3 Technical performances ... 24
4.4 Economic Data from both cases ... 26
5. Lipperndorf lignite fired oxyfuel power plant (865 MWel) ... 27
5.1 Reference Power Plant ... 27
5.2 Oxyfuel Power Plant ... 28
5.3 Plants efficiency ... 30
5.4 Emissions Analysis ... 31
5.5 Cost Analysis ... 33
6. Advanced supercritical (ASC) pulverized fuel power plant (740 MWel)... 34
6.1 Reference Power Plant (performances and emissions) ... 34
6.2 Oxy-combustion power plant (performances and emissions) ... 35
6
7. US-DOE NETL Supercritical Coal Fired Power Plant (550 MWel) ... 40
7.1 Reference Power Plant ... 40
7.1.1 Emission Control Systems and Environmental performances ... 41
7.2 Power plant with MEA scrubbing CO2 Capture system ... 42
7.2.1 Emission Control Systems and Environmental performances ... 43
7.3 Oxyfuel Combustion Super-critical Power Plant ... 44
7.3.1 Emission Control Systems and Environmental performances ... 45
7.4 Technical performances comparison ... 45
7.5 Cost Analysis ... 47
8. European Union Emission Trading System (EU ETS) ... 48
9. External Costs Concept and Global Warming Impacts ... 51
9.1 External costs for Carbon Dioxide Emissions... 51
9.2 External costs for Geological Carbon Dioxide Storage ... 52
10. Technical Assessments ... 53
11. Cost analysis and Economic Assessments... 56
11.1 Costs of Electricity ... 56
11.2 CCS and EU ETS effects ... 58
11.3 Internalization of External Costs ... 60
11.4 Avoidance Costs ... 66
12. Conclusions ... 68
List of References ... 69
List of Figures ... 70
7
1. Background
Global warming is one of the largest environmental challenges of our time. Increased carbon dioxide level in the atmosphere is the dominating contributor to increased global warming. About half of the current emissions are being absorbed by the ocean and by land ecosystems, but this absorption is sensitive to climate as well as to atmospheric carbon dioxide concentrations, creating a feedback loop. General circulation models have generally excluded the feedback between climate and the biosphere, using static vegetation distributions and CO2 concentrations from simple carbon-cycle models that do not include climate change [1] Carbon dioxide is emitted to the atmosphere through combustion of fossil fuels in power plants, automotive engines, for industrial use and for heating purposes. The world is currently depending on the use of fossil fuels for its energy supply, and will continue to be so for a long time yet to come, due to the abundant sources of in particular bituminous coal and lignite. Small-scale renewable electricity production is available on the market today, but the cost of avoiding CO2 emissions through renewable (e.g. wind power) is at present very high. In the very long term, large-scale heat and power production technologies based on sustainable energy sources will have to be developed. These technologies are not commercially available, and the opportunity to find time for their commercialization will be given through near-term development of technology for emission-free fossil-fuel utilization. Departing from this, the need to develop technologies that allow continuing to burn fossil fuel in a global warming scenario is day for day more important. The main way to achieve this, is CO2 capture and storage (CCS) technologies (Figure 1); the mean of carbon dioxide capture and storage technologies is to separate the CO2 from flue gases or from fossil fuel, and then must be transported to a storage site where it will be stored away from the atmosphere for a very long time. In order to have a significant effect on atmospheric concentrations of CO2, storage reservoirs would have to be large relative to annual emissions.
8
1.1 Co2 Capture Technologies
The concepts for power generation with CO2 capture are usually divided into three different groups, post combustion capture, pre-combustion capture and oxyfuel combustion capture, as shown in Figure 2 and as widely explained in the literature.
1.1.1 Post Combustion Capture
The aim of this technology is to capture CO2 from flue gases produced by combustion of fossil fuels and biomass in air; the flue gases are treated before of being discharged directly in atmosphere, to separate most of the CO2. The most advanced technique is a chemical sorbent process that is normally used for CO2 separation, other techniques are available only a research stage of development.
1.1.2 Pre Combustion Capture
The means of this is to obtain a synthesis gas (fuel gas) from fossil fuel, this last reacts with oxygen or air, and/or steam to give a mixture composed of carbon monoxide and hydrogen; the carbon monoxide is reacted with steam in a catalyct reactor to give CO2 and more hydrogen. To capture the CO2 usually is used either a physical or a chemical absorption process, and then the result is a hydrogen rich fuel which can be used in many applications.
1.1.3 Oxyfuel Combustion
In oxy-fuel combustion, nearly pure oxygen is used for combustion instead of air, resulting in a flue gas that is mainly CO2 and H2O. If fuel is burnt in pure oxygen, the flame temperature is excessively high, but CO2 and/or H2O-rich flue gas can be recycled to the combustor to moderate this. Oxygen is usually produced by low temperature (cryogenic) air separation and novel techniques to supply oxygen to the fuel, such as membranes and chemical looping cycles are being developed.
9
1.2 CO2 Transport
CO2 is transported in three states: gas, liquid and solid. Commercial-scale transport uses tanks, pipelines and ships for gaseous and liquid carbon dioxide. Gas transported at close to atmospheric pressure occupies such a large volume that very large facilities are needed. Gas occupies less volume if it is compressed, and compressed gas is transported by pipeline. Volume can be further reduced by liquefaction, solidification or hydration. This existing technology and experience can be transferred to liquid CO2 transport. Solidification needs much more energy compared with other options, and is inferior from a cost and energy viewpoint. Each of the commercially viable technologies is currently used to transport carbon dioxide. The CO2 is transported by pipeline as a dense supercritical phase; inert gases must be reduced to a low concentration to avoid two phase flow conditions developing in the pipeline. The carbon dioxide must also be dried to prevent water condensation and corrosion in pipelines and allow use of conventional carbon steel materials.
1.3 CO2 Storage
Carbon storage [1] is defined as the placement of CO2 into a repository in such a way that it will remain stored (or sequestered) permanently. It includes two distinct sub-areas: geologic sequestration and ocean sequestration.
1.3.1 Geological Storage
The storage of CO2 in a geologic formation is the injection of CO2 into an underground formation that has the capability to contain it securely over a long period of time (Figure 3). The geological storage has attract the oil company interest to enhanced oil recovery (EOR) and for enhanced coal bed methane recovery (ECBM); either to increase the performance of near depleted oil field, or to obtain fuel gases from unminable coal bed.
10
Information and experience gained from the injection and/or storage of CO2 from a large number of existing enhanced oil recovery (EOR) and acid gas projects, as well as from the Sleipner, Weyburn and In Salah projects, indicate that it is feasible to store CO2 in geological formations as a CO2 mitigation option. Depleted oil and gas reservoirs, possibly coal formations and particularly saline formations (deep underground porous reservoir rocks saturated with brackish water or brine); can be used for storage of CO2. At depths below about 800–1000 m, supercritical CO2 has a liquid-like density that provides the potential for efficient utilization of underground storage space in the pores of sedimentary rocks. Carbon dioxide can remain trapped underground by virtue of a number of mechanisms.
From geological point of view, five types of formations, each with different challenges and opportunities for CO2 storage are:
Oil and Gas Bearing Formations.
Saline Formations Basalts
Deep Coal Seams
Oil or Gas Rich Shale.
Figure 3: Options for storing CO2 in deep underground geological formations (after Cook,
11
1.3.2 Ocean Storage
The purpose of R&D in ocean sequestration is to gain a better understanding of ecosystem dynamics at elevated CO2 concentrations. Ocean sequestration is not deemed a viable option at this time. Ocean sequestration is the injection of CO2 into the deep oceans for long-term storage. Key concerns about such an approach include the cost of delivering CO2 500 meters or deeper below the ocean surface; the permanence of injected CO2, and possible negative effects on the deep ocean ecosystem. The advantage of this approach is the enormous potential storage capacity of the deep oceans. Various technologies have been envisioned to enable and increase ocean CO2 storage (Figure 4).
One class of options involves storing a relatively pure stream of carbon dioxide that has been captured and compressed. This CO2 can be placed on a ship, injected directly into the ocean, or deposited on the sea floor. CO2 loaded on ships could either be dispersed from a towed pipe or transported to fixed platforms feeding a CO2 lake on the sea floor. Such CO2 lakes must be deeper than 3 km where CO2 is denser than sea water. Any of these approaches could in principle be used in conjunction with neutralization with carbonate minerals. Research, development and analysis of ocean CO2 storage concepts has progressed to consider key questions and issues that could affect the prospects of ocean storage as a response option to climate change. Accumulated understanding of the ocean carbon cycle is being used to estimate how long CO2 released into the oceans will remain isolated from the atmosphere. Such estimates are used to assess the effectiveness of ocean storage concepts.
12
1.3.3 Mineral Carbonation and industrial uses of CO2
There are also other two different options for carbon dioxide storage: the fixation of CO2 in the form of inorganic carbonates, also known as ‘mineral carbonation’ or ‘mineral sequestration’, and the industrial utilization of CO2 as a technical fluid or as feedstock for carbon containing chemicals. In the case of mineral carbonation, captured CO2 is reacted with metal-oxide bearing materials, thus forming the corresponding carbonates and a solid by-product, silica for example. The resulting carbonated solids must be stored at an environmentally suitable location. The technology is still in the development stage and is not yet ready for implementation. The industrial use of CO2 as a gas or a liquid or as feedstock for the production of chemicals could contribute to keeping captured CO2 out of the atmosphere by storing it in anthropogenic carbon products. Industrial uses provide a carbon sink, as long as the pool size keeps growing and the lifetime of the compounds produced is long. Neither prerequisite is fulfilled in practice, since the scale of CO2 utilization is small compared to anthropogenic CO2 emissions, nor is the lifetime of the chemicals produced too short with respect to the scale of interest in CO2 storage. Therefore, the contribution of industrial uses of captured CO2 to the mitigation of climate change is expected to be small.
1.4 CCS cost and economic potential
The cost analysis includes all of three aspects of CCS (capture, transport and storage); the literature reports a fairly wide range of cost for employing the systems with fossil fired power plant or industrial processes. The results for an estimation of the future performances of the components of the capture, transport, storage, measurement and monitoring systems are uncertain. The costs to deploy a full CCS system for a fossil – fired power plant are dominated by the cost of capture. The costs for transport and storage could be also negative, if the CO2 captured is used in EOR (enhanced oil recovery) or ECBM (enhanced coal bed methane) projects. In the non-power applications, the cost of capture is lower than for capture from fossil fired power plants, but the concentrations and partial pressures of CO2 in the flue gases from these sources vary widely, as do the costs. The CCS technologies can be applied to biomass fed energy systems to create useful energy, in this case the total CO2 balance is negative, but solely whit biomass. Energy and economics models are used to study the future scenarios for CCS deployment and costs. The literature and current industrial applications indicate that in the absence of measures to limit CO2 emissions, there are only small, niche opportunities for the deployment of CCS technologies. Many assessments indicate that CCS systems, with greenhouse gas emission limits, will be competitive with other long term, large-scale mitigation options, such as nuclear, H2 production from biomass and fossil fuels and renewable technologies. The potential of CCS span a wide range, from very small contributions to thousands of gigatonnes of CO2; this can be explained by uncertainty of long-term, socio-economic, demographic and technological change, the main drivers of future CO2 emission.
13
2. Oxy-fuel Combustion Capture System
The aim of oxyfuel combustion [1] is to burn hydrocarbon or carbonaceous fuel (also biomass) in either pure oxygen or a mixture of pure oxygen and CO2 rich recycled flue gas; in this way it is possible to eliminate nitrogen from the flue gas. In the oxyfuel combustion the temperature can arrive about 3500 °C which is far too high for typical power plant materials; for this reason the temperature is limited about 1300°-1400 °C in a typical gas turbine cycle and to about 1900 °C in an oxyfuel coal fired boiler using current technology. The combustion temperature is controlled by the proportion of flue gas and gaseous or liquid water recycled back to the combustion chamber. The flue gas are composed mainly of carbon dioxide and water vapour together with excess oxygen required to ensure complete combustion of the fuel and other impurities from the fuel used or from the oxygen feed or air leakage into the system. Contains of CO2 in the net flue gas after cooling to condense water vapour, is about 89-98%. This concentrate CO2 stream can be compressed, dried and further purified before delivery for storage; the CO2 capture efficiency is very close to 100%. Although elements of oxyfuel combustion technology are in use in other industrial fields, for the CO2 capture, the oxyfuel technology have yet to be deployed on a commercial scale. The main oxyfuel combustion systems can be classified according to how the heat of combustion is supplied and whether the flue gas is used as a working fluid.
2.1 Oxy-fuel indirect heating – steam cycle
Whit this system it is possible to use any hydrocarbon or carbon containing fuel. The oxy-fuel system provides to heat a separate fluid by heat transfer trough a surface. Some small-scale demonstrations of oxy-firing have been done, and some pilot scale plants are planned; the fuel mainly used is coal (PC – pulverized coal) but oxy-fired coal power plants have not otherwise been deployed at a large scale. In a typical oxy-fired PC design, the plant is very similar to a conventional PC power plant. The feed system, boiler, steam system are essentially the same, but a portion of the flue gas is recycled to control flame temperature and stability and to ensure proper heat flux in the boiler, and a cryogenic air separation unit (ASU) is used to provide 95% pure oxygen to the boiler. A several results are coming from the pilot-scale power plants; the main results are about feed gas used in oxy-fuel combustion that it plays a main role to control the flame temperature and heat capacity of flue gases. One of this has reported that if the feed gas has a composition of approximately 35% by volume O2 and 65% by volume of dry recycled CO2 it is possible to have the same situation if the fuel burning in air. With this feed gas composition, the excess O2 levels in the flue gas stream as low as 1-3% by volume O2, and the flue gas stream of 95-98% by volume dry of CO2 (the rest being excess O2, NOX, SOX and Argon) whit zero leakage of ambient air into the system. The fly ash formation behaviour and SO2 emissions are comparable to the conventional air firing conditions. The NOX thermal emission are reduced near to zero and with partial recycling of NOX also reducing the formation and net emissions originating from the fuel bound nitrogen. The nitrogen free combustion process would benefit from higher heat transfer rates, also if the utility boilers are built with higher temperature tolerant materials, are able to operate at higher oxygen concentration and lower flue gas recycle flows; both of which will considerably reduce overall volume flows and size of the boiler. This size reduction is translated in benefit of reducing both capital and operating costs of equipment deployed for combustion, heat transfer and final gas purification. In this way it has been developed an advanced zero emission power plant (AZEP) that is an indirect gas turbine cycle
14
that incorporate a high temperature oxygen transport membrane. In this case is used a standard air based gas turbine in a combined cycle arrangement. Three process steps take place in a reactor system that replaces the combustion chamber of a standard gas turbine. The first is a separation of oxygen from hot air using the membrane and transport to the combustion section, then the combustion and finally a heat exchange from the combustion products to the compressed air. The efficiency is around 50% including even CO2 compression process. More details about this kind of power plant are shown in the further chapter, where different Oxycombustion coal-fired power plants are analysed.
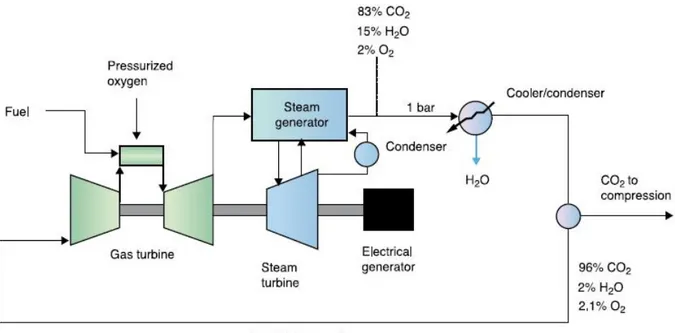
2.2 Oxy-fuel direct heating – gas turbine cycle
It is possible use as fuel only natural gas, light hydrocarbons and syngas (CO+H2) which could be derived from coal. In a modified gas turbine, the oxyfuel combustion takes place in a pressurized CO2 riches recirculating stream; then the hot gas is expanded in the turbine producing power. The flue gas, after expansion, is cooled to provide heat for a steam cycle and water vapour is condensed by further cooling. The net CO2 rich combustion product is removed and the remaining gas is recycled to the compressor and then used in the combustion chamber to control the temperature entering the turbine. (Figure 5)
There are also two typical variant of this configuration; they are called Matiant and Graz. The first use CO2 as working fluid, and consists of features like intercooled compressor and turbine reheats. The exhaust gases preheat the recycled CO2 in a heat exchanger. The CO2 generated in combustion is extracted from the cycle behind the compressor. The efficiency of Matiant cycle can increase above 50% in a combined cycle configuration similar to that shown in figure 5. The Graz cycle consist of an integrated gas turbine and steam cycle, with efficiency above 50%. The use of CO2 as the working fluid in the turbine will necessitate a complete redesign of the gas turbine.
15
The main difference is the different molecular weight of the gases in the compressor and turbine, because in a traditional gas turbine these values are close to that of air (28.8), instead in case of oxyfuel combustion with CO2 recycle the compressor fluid molecular weight is 43 and about 40 in the turbine. This different property molecular weight results in a number of changes in properties that are of importance for the design of the compressor, combustor and turbine. The speed of sound is 80 % of air, the gas density is 50% higher than air and the specific heat ratio is lower than air resulting in a lower temperature change on adiabatic compression or expansion. These changes in the fundamental properties of the working fluid force to redesign completely compressor, combustor and hot gas path.
2.3 Oxy-fuel direct heating – steam turbine cycle
In an oxy-fuel steam turbine cycle, water is pressurized as a liquid and then is evaporated, heated by the direct injection and combustion of a fuel with pure oxygen and expanded in a turbine. Most of the water in the low pressure turbine exhaust gas is cooled and condensed, prior to pumping back to a high pressure while the CO2 produced from combustion is removed and compressed for pipeline transport.
A recent development by Clean Energy Systems (Figure 6) incorporating these concepts where a mixture of 90 % by volume superheated steam and 10 % CO2 is produced at high temperature and pressure to power conventional or advanced steam turbine. The steam is condensed in a low pressure condenser and recycled, while CO2 is extracted from the condenser, purified and compressed. This kind of power plants requires a clean gaseous or liquid fuel; the power plant is very compact and the control system is very precise, all of this helps to have very low time of start-up (some seconds).
Figure 6: Principle of Clean Energy systems cycle. The combustion of the fuel and oxygen is cooled by
16
3. MEA scrubbing CO
2Capture system
One of the most suitable techniques to reach the post – combustion CO2 capture is the use of a solvent to separate carbon dioxide from the products of combustion. In this process the flue gas is scrubbed whit MEA (monoethanolamine), an amine – based solvent in an absorption column; amines in the water solution react with CO2 forming chemical compounds that separate CO2 from the gas mixtures at a higher rate than the natural CO2 absorption in pure water. The MEA solvent is then regenerated in a distillation column thereby releasing a high purity CO2 product.
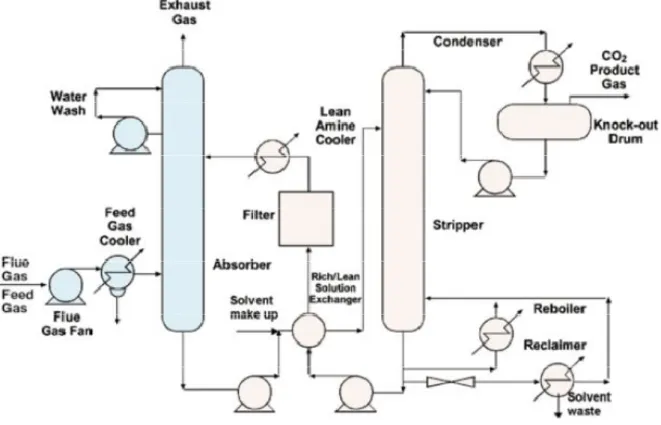
In figure 7 is shown the process flow sheet concern the MEA capturing process; in the first the flue gas flow coming from the boiler, that is above 100 °C, has to be cooled to reach a temperature between 40 °C and 60 °C, that is the optimal temperature range to which is bound the chemical solvent in the absorber, where the flue gas contacts an aqueous solution of MEA (30% by weight) a weak acid, to form a water soluble salt. The limit of 30% by wt of MEA in water was set to avoid corrosion, which can be present with richer amine solutions. The “rich” MEA stream exits the absorber at the bottom of the column. It is then preheated in a “rich/lean solution exchanger” by the lean MEA stream leaving the stripper, and enters the stripper where, with a further addition of heat (heat is supplied by reboiler), the reaction is reversed; the temperature is between 100 °C and 140 °C and the pressure is not very much higher than atmospheric value. The CO2, having been liberated from the MEA, leaves through the top of the stripper column. The lean MEA is then recycled back to the absorber.
17
The main reactions that take place in aqueous systems of amine and CO2 are [2]:
2 O ↔ + + 2 ↔ + + ↔ + 2 + ↔ + + ↔ + + ↔ +
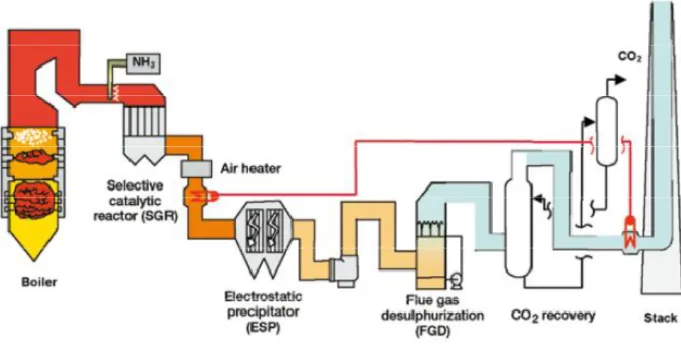
The impurities in the fuel are very important for the design and costing of the complete plant. Flue gas coming from coal combustion does not contains only CO2, N2, and H2O, but also air pollutants such as SOx, NOx, particulates, HCl, HF, mercury, other metals and other trace organic and inorganic contaminants. The presence of NOx and SOx must be avoided because they react whit amines, preventing regeneration and raising the MEA make – up to cover additional losses; an other assumption used is to have not any pollutants in the flue gas and perfect combustion. For NOx it is the NO2 which leads to the formation of heat stable salts, fortunately the level of NO2 in mostly less than 10% of the overall NOx content in a flue gas. To avoid the presence of these elements is necessary to deploy other unit operations to remove the air pollutants prior to CO2 capture system, as is shown in figure 8. [1].
18
Therefore the flue gas temperature at the enter of absorption column is assumed at 65°C, because after cooling the temperature is 40 °C but it increases of 25°C in the fan, which is necessary to bring the flue gas pressure to 1.2 bar. Several studies show that the increase absorption efficiency with a 2.4 bar absorber pressure is not justified by the higher energy consumption by the fan. Following the scheme of operation shown before, the MEA aqueous solution enriched by CO2 flows into a shell and tube heat exchanger. The hot fluid (lean solution) flows in the tube side and the cold fluid (rich solution) flows on the shell side. This type of exchanger has been chosen to reduce the cooling duty on the lean solution by internal regeneration of heat. The stripper column has 11 theoretical stages, and the first is the condenser (temperature on top of stripper is set at 90 °C) and the last is the kettle reboiler, which is feed by steam extracted from the power plant. This steam stream represents the main source of performance reduction of the power plant. After the stripper the H2O and CO2 mixture is cooled to 25°C to separate water from dioxide carbon, before the liquefaction plant. The removal system is not investigated for NOx and SOx (the clean-up devices are present) but the flue gas is assumed to be available at the absorber inlet free of them. The efficiency of carbon dioxide capture system is 90% of the CO2 produced by coal-fired power plant. The flue gas treatment process consists of four parallel trains each with an absorber, a heat exchanger and a stripper.
Figure 8: Schematic of a pulverized coal - fired power plant whit post - combustion CO2 capture system and
19
4. Greek lignite-fired power plant (360 MW
el)
4.1 Simulation data of Reference Power Plant
The reference power plant used as a base case is a 360 MWel gross power output plant with reheat and seven water preheater whit steam extraction from the steam turbine. The figure 9 illustrates the process flow diagram of the reference case. The cycle calculations have been performed using the thermodynamic cycle calculation software ENBIPRO (ENergie-BIllanz-PROgram). ENBIPRO is a powerful tool for heat and mass balance solving of complex thermodynamic circuits, calculation of efficiency, exergetic and exergo-economic analysis of power plants. The software code models all pieces of equipment that usually appear in a power plant installations and can accurately calculate all thermodynamic properties (temperature, pressure, enthalpy) at each node of the thermodynamic circuit, power consumption of each component, flue gas composition, etc. The code has proven its validity by accurately simulating a large number of power plants and through comparison of the results with other commercial software. [3] The initial code was developed to allow the computation of the characteristic of thermal interacting flows in the air – flue gas and water – steam cycles of a power plant. The code was extended to include a new module in order to simulate the drying process by taking into account heat and mass balance equations.
20
Since the raw lignite has high moisture content, a fuel pre-drying system has been integrated to both cases. According to this pre drying concept, the heat content of the moisture that is removed in the form of steam from the raw lignite is used for the drying (WTA drying system). This technology affects positively the efficiency of the PF power plant. The water content of the raw lignite is 55.4% w/w while it drops to 12% w/w at the exit of the dryer. The air excess in a typical lignite – fired power plant is 1.1 – 1.15, thus in this case the air excess ratio applied is 1.1, air infiltration excluded. According to the available information, the ash melting temperature of the lignite is on the order of 1250 °C, thus, a furnace outlet temperature close to 1200 °C has been chosen in all the simulated cases. The air infiltration rates in the boiler and in the ESP are both 0.01 kg/kg flue gas (total value 2%). The ultimate analysis and LHV of the raw and dried fuel are shown below:
C, wt% 18.5 H, wt% 1.5 S, wt% 0.4 O, wt% 8.7 N, wt% 0.6 Ash, wt% 15.0 H2O, wt% 55.3 LHV (kJ/kg) 5418
Whit data about G10 step of simulation it is possible, with data of flue gas composition (Table 4), to determinate the flue gas flow for each component.
G10 step flue gas flow: 390.2 kg/s
= 390,2 ⁄ × 22,45 = 87,60 ⁄ + = 390,2 ⁄ × 63,66 = 248,40 ⁄ = 390,2 ⁄ × 6,92 % = 27 ⁄ C, wt% 36.5 H, wt% 2.9 S, wt% 0.8 O, wt% 17.2 N, wt% 1.1 Ash, wt% 29.5 H2O, wt% 12.0 LHV (kJ/kg) 13,025
Flue gas composition at the boiler exit (G10) Reference PP (wt%) N2 + Ar 63.66 CO2 22.45 H2O 6.92 SO2 0.27 O2 1.74 Ash 4.97
Table 3: Flue gas composition for the reference PP
21
4.2 Simulation data of Greenfield Oxyfuel Power Plant
The oxyfuel concept is based on the fact that fuel is burned with pure oxygen instead of air, the produced flue gas contains mainly CO2 and H2O. By cooling the waste gas, the water content is condensed and almost a pure gaseous CO2 stream can be achieved by a further active dehydration whit tri-ethylene glycol (TEG) (to separate the remaining H2O in order to avoid corrosion and hydrate precipitation during transportation) and a removal of non-condensable element. After the pure CO2 stream can be compressed, transported and stored. An air separation unit (ASU) is required for oxygen production. Now the most suitable technique for nitrogen separation from air is cryogenic air separation.
The purity of oxygen produced in the ASU plays an important role regarding power consumption for air separation. Cryogenic separation can give 99.7% oxygen purity; for rate below 95% the energy consumption is reduced due to the lower air pressure required. On the other hand, for O2 purities higher than 97% power consumption is sharply increased. Taking into account the energy required for the air separation, the production of O2 whit purity of 95% is a promising option, and is also the rate chosen in this case; the majority of the rest 5% being Argon and all oxygen contained in the air is used.
22
The cryogenic air separation process has the following stages:
Air compression whit inter cooling, two stages whit intermediate cooling of the air down to 21 °C. These steps are 1.013 – 2.37 bar and 2.37 – 5.52 bar.
Air cooling to 11.5 °C
Removal of water vapour and other impurities trough molecular sieves
Liquefaction of the compressed air (- 180°C) in a heat exchanger, utilizing the heat of the outgoing gas streams
Separation of N2 from the liquefied air in a distillation column
Air in-leakage into the boiler as well as the oxygen purity play a significant role in the CO2 concentration of the flue gases; thus under assumptions of 95% O2 purity and 2% air infiltration, the CO2 capture efficiency is reduced due to the release of the inerts in the atmosphere during the product purification process. The exit pressure of the oxygen from the ASU in equal to 1.03 bars and, as a result, no FD fan is used in the oxyfuel case, in contrast to the air-fired power plant. Up to 15% of the power plant’s electrical output is consumed by the air separation process.
The air excess ratio is reduced from reference power plant, due to the high flue gas recirculation flow rate and a furnace stoichiometric of 1.05 – 1.07, air infiltration excluded. In addition, a reduced furnace stoichiometric is beneficial in terms of ASU power consumption.
The combustion whit pure oxygen produces very high temperature; to control it part of the flue gas is recycled in the combustion chamber. Several studies about oxyfuel capture system, propose approximately 2/3 of the boiler exit flue gas mass flow should be recirculated. The assumptions about air infiltration rate in the boiler and in the ESP both are 0.01 kg/kg of flue gas. The fuel consumption is the same to the reference power plant. According to the reference power plant, the furnace outlet temperature is chosen close to 1200 °C. Starting from the reference power plant to reach an optimized scenario to deploy the oxyfuel combustion capture system several processes integration options has been identified. The figure 10 illustrates the process flow diagram of the Greenfield oxyfuel power plant. A hot ESP (electrostatic precipitator) is used for particle removal at the boiler exit; the flue gas recycle is extracted from the point downstream the hot ESP and mixed whit the O2 stream from the ASU. The absence of an air pre-heater leads to the necessity of a second hot ESP, which adds an air in-leakage source and has lower separation efficiency compared to a cold one. The O2 stream is heated from the remaining flue gas, which consequently follows a further removal process in a cold ESP. The total air in-leakage in the ESP system is assumed to be 0.01 kg/kg flue gas.
Heat from flue gas condenser is integrated in the water steam cycle by partly replacing low-pressure feed water heaters 1 and 2. Oxygen is heated from the first CO2 compression step up to 110 °C. Heat from the second and the third compression steps are used for water pre-heating at the LPH1 (lower pressure heater), LPH2 and LPH3 waters heaters. The LPH4 is partly replaced whit heat deriving from flue gases before which enter in the flue gas treatment process.
The flue gas treatment is composed from different stage of compression, cooling and dehydration. The CO2 compression is divided in five stages whit intermediate cooling of the compressed product to 21 °C, namely 1.05 – 3.2 bar, 3.2 – 10.4 bar, 10.4 – 33.5 bar, 33.5 – 71 bar and 71 – 110 bars. The TEG dehydration is place between the third and the fourth compression stage at pressure of 33.5 bars, and the removal non-condensable after the fourth at pressure of 71 bars.
23
By the same procedure used for the reference power plant analysis, the exit of the boiler is identified as step G7 of simulation data:
G7 step flue gas flow: 393.9 kg/s
As explained above, the flue gasflow is split in two streams, one is recycled and the second is the emission stream, which needs the flue gas treatment. The recycled stream is around 67% of the total.
= 393,9 ⁄ × 67 % = 263,9 ⁄ = 130 ⁄
The percentuage composition of recycled flow is the same than at the boiler exit, combining the data from table 4 is possible to have the data about the flow elements:
= 130 ⁄ × 65,96 % = 85,75 ⁄
+ = 130 ⁄ × 8,29% = 10,8 ⁄
= 130 ⁄ × 18,8 % = 24,4 ⁄ Flue gas composition at the boiler exit (G7) Optimized oxyfuel PP (wt%) N2 + Ar 8.29 CO2 65.96 H2O 18.80 SO2 0.80 O2 1.28 Ash 4.87
24
4.3 Technical performances
The main results of the simulations (energy output, auxiliary power consumptions, efficiency) for both cases are shown in table 5. Despite the increase in gross power output for the Greenfield power plant, is possible to view as the huge demand for auxiliary power for CO2 capture technology results a significant penalty in the power plant performance.
From table 5 it is easy to view as with the same fuel consumption it is had the increase of gross power output for the oxyfuel PP and a relative increase in gross electricity efficiency; in other hand the rise of auxiliary consumption give a penalty in terms of net power output and net electrical efficiency.
Main Results [4] Units Reference PP Optimized
oxyfuel PP
FW Pump MWel 9.17 9.54
FD Fan MWel 1.43 -
ID and gas fans MWel 2.77 3.55
Dryer MWel 25.21 25.21
Lignite pre-crushers and mills MWel 4.00 4.00
ESP’s MWel 0.50 0.50
Fly ash transport MWel 0.85 0.85
Lignite feeding and handling system MWel 0.78 0.78
Condensate pump MWel 0.54 0.56
Circulating and cooling water pumps MWel 3.74 3.93
Others MWel 1.14 1.20
ASU MWel - 52.39
CO2 compression MWel - 46.35
Raw fuel flow kg/s 136.34 136.34
Gross power output MWel 356.78 392.45
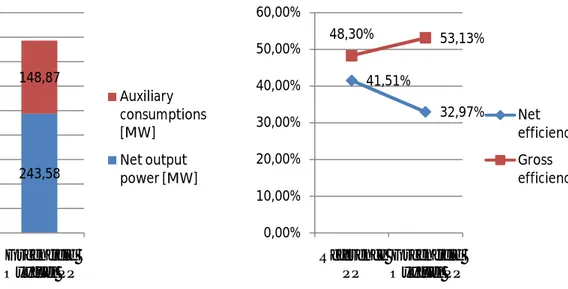
Gross el. efficiency % 48.30 53.13
Net power output MWel 306.66 243.58
Net el. efficiency % 41.51 32.97
Table 5: Main results of the simulations
41,51% 32,97% 48,30% 53,13% 0,00% 10,00% 20,00% 30,00% 40,00% 50,00% 60,00% Reference PP Greenfield Oxyfuel PP Net efficiency Gross efficiency 306,66 243,58 50,12 148,87 0 50 100 150 200 250 300 350 400 450 Reference PP Greenfield Oxyfuel PP Auxiliary consumptions [MW] Net output power [MW]
25
Since the net power output value with the flue gas flow data is possible to determinate the pollutant products per unit of electrical energy produced [kg/MWhel].
Reference PP Greenfield Oxyfuel PP
Net Power
Output [MWel]
Element Emission
flow [kg/s]
Products per energy units [kg/MWh]
Net Power
Output [MWel]
Element Emission
flow [kg/s]
Products per energy units [kg/MWh]
306,66 CO2 87,6 1028,37 243,58 CO2 85,75 1267,35
306,66 N2 + Ar 248,4 2918,06 243,58 N2 + Ar 10,8 159,62
306,66 H2O 27 316,96 243,58 H2O 24,4 360,62
In the reference power plant the carbon dioxide produced is emitted by stack, in the Greenfield oxyfuel power plant, by condensation the water is recovered to obtain a CO2 stream which will be compressed and stored. In this case the CO2 capture efficiency is limited to 90% of the CO2 produced by lignite combustion.
= 1267,35 ⁄ ℎ × 90% = 1140,62 ⁄ ℎ
= 126,73 ⁄ ℎ
The efficiency of CO2 capture system is strongly related to a flue gas composition at the boiler exit; the inerts in the oxyfuel case consist in O2, N2, SO2 and Ar. Their presence is due to the 95 vol% purity of the O2 at the exit of ASU, as well as the air infiltration in the boiler and the ESP. Other non-condensable elements are removed by flash process and then they are consequently released to the atmosphere. 1028,37 126,73 1140,62 0 200 400 600 800 1000 1200 1400 1600 1800
Reference PP Greenfield Oxyfuel PP
CO2 captured [kg/MWh] CO2 emitted [kg/MWh]
26
The figure 13 shows the CO2 amounts, despite the increase of CO2 produced, is possible to view as the emission value is lower as expected in the oxyfuel case, than the traditional lignite-fired power plant. In terms of efficiency and net output power, the application of CO2 capture technologies in a power plant is highly costly. In the oxyfuel case, due to the high amounts of heat produces during the CO2 compression, the flue gas condensation, the compression of the air for the ASU as well as due to the high heat content of the flue gas exiting the boiler at increased the temperatures, the efficiency and the power penalties can be significantly reduced when this heat is integrated in a water/steam cycle of the power plant. For the Greenfield oxyfuel power plant the huge demand for auxiliary power results in a significant penalty in the power plant performance ( 8,5 % points).
4.4 Economic Data from both cases
The economics of the conventional air-fired reference case without CCS are presented on order to be able to measure the effects of oxyfuel capture technology on the power plant financial feasibility. The cost of electricity (CoE) for both cases are calculated signs the net present value approach; the avoidance cost is evaluated in according to:
€ = (€⁄ ℎ) − (€⁄ ℎ) ⁄
( ⁄ ℎ ⁄ − ⁄ ℎ )
The economic evaluation of the power plant is the overall profitability of the plants. The study was performed on 2006, therefore the price of fuel, the EPC and O&M costs and other economic assumptions are reported to this year. Both cases are examined within the timeframe of 40 years payback period. While costs such interest, depreciation and inflation rates were introduced as part of the discounted cash flow (average value 8%). From [3] the CoE of the reference plant was estimated at around 35,5 €/MWh, the CoE of an oxygen lignite-fired plant with CCS is estimated around 57,5 €/MWh.
Cost of Electricity (CoE) [€/MWh] Emissions [kg/MWh] Avoidance Cost [€/tonCO2]
Reference PP 35,5 1028,37 // Greenfield Oxyfuel PP 57,5 126,73 24,4 w: with CCS w/o: without CCS
27
5. Lipperndorf lignite fired oxyfuel power plant (865 MW
el)
5.1 Reference Power Plant
The reference [5] used in this case is a 2 x 865 MW lignite fired Lipperndorf power plant, this is a modern state of the art power plant, was the second station in a new series in the lignite fields of the new German Lander. Employing new high-temperature technology and with a 42.6% design efficiency, the units set new standards for lignite-based power plants. This result has been reached by the most efficient high temperature, single-shaft units ever to be built for a fossil-fired power station. This high efficiency is made possible by new high-temperature technology that has been fully exploited in the Lipperndorf plant supplied by ALSTOM [6]. The plant also has a district heating capability of 300MW. The plant was the biggest private building project in Saxony. [7] The table 6 show the main data for the reference power plant.
In the Lipperndorf PP are used three different coal qualities: guarantees coal max water and a max ash coal. The guarantee coal is used for all calculations regarding efficiency and flue gas flow (LHV= 10,5 MJ/kg), but the plant must be able to handle other coal as well, thus the other two type called “max water” and “max ash” coals are used for dimensioning the flue gas equipment. The air excess in the boiler is 15% corresponding to an excess of 3% O2.
Table 6: Main process data and performance for reference power
plant Lipperndorf (same data for both blocks)
Gross electricity output 933 MWel Gross electricity efficiency 46,06 %
Net electricity output 865 MWel
Net electricity efficiency 42,6 %
Boiler power 2030 MW
District heat extraction 115 MW
Operating time 7500 h/year
Fuel Raw Lignite
Fuel demand 192,9 kg/s
Steam Flow 672 kg/s
High pressure steam 554/258,5 °C/bar
Intermediate steam pressure 583/49,7 °C/bar Steam pressure at condenser discharge 0,038 bar
Table 7: Emissions to atmosphere from reference power plant
Emission to air mg/m3n kg/h kg/MWhel
SOx < 350 < 1120 1,28
NOx < 145 < 460 0,53
CO2 < 235 < 740000 855,2
28
5.2 Oxyfuel Power Plant
The principle of operation of the oxyfuel CO2 capture system is shown in the chapters above. The aim of the reference study was to illustrate the environmental implications and costs associated with oxyfuel CO2 capture process; the net electricity output was kept the same as in the reference plant. To reach this result, the boiler power in the CCS power plant was increased using a simple scaling factor between electricity net efficiency:
=
Since Sf is not far from 1 (1,3 in this case), linear scaling is considered a reasonable approximation. In the same way, the fractional reduction in energy output (energy penalties EP), is related to the reduction of net efficiency and it is determinate in according to:
= 1 −
In the O2/CO2 boiler the combustive agent stream is composed from 21 vol.% oxygen and 79 vol.% flue gas. The combustion conditions like air are rather obtained for a concentration of oxygen about 30 vol.%; it has been choose the above mix just for simplicity of calculations, because the different air or O2/CO2 feed streams have similar volumetric flow conditions, in this way is possible to have facilitations for a direct comparison whit the reference power plant with respect to equipment and flows. Based on the data from reference power plant, a process evaluation was performed in order to identify the new components needed as well as the component that can be excluded from oxyfuel scheme. The cryogenic air separation is the only separation technique that can provide the oxygen flows required in this kind of application. It has been chosen an oxygen purity of 95%, a good compromise between cost and performance. The process layout is based on an existing ASU whit an O2 production of 50000 m3n/h. In this case is used an excess of 1,5 % O2 (dry basis). The inter cooling in the ASU compressors could be excluded, to have about 1 MWt per MWel consumed in the compressor which could be used for feed water preheating or district heating; but in this way the compressor efficiency decrease of approximately of 20%, which makes this alternative unattractive. The cooling of both the CO2 compressor and the air compressor in the ASU is performed whit cooling water from the plant cooling tower, also the CO2 condensation requires cooling water from cooling tower; there must be an almost 50% increase in the mass flow of cooling water produced by cooling tower compared to the reference plant. In the reference article the study about oxyfuel technologies deployment is performed whit and without FGD system (flue gas desulphurization). In the case where the FGD is included, the investment cost has been reduced to 60% of the corresponding FGD for the reference plant, since the flue gas flow will decrease drastically in the oxyfuel scheme. Wet FGD can be applied, although in according with literature, the SO2 removal is to be performed in a CO2 atmosphere with 3 times as high volumetric concentrations of SO2 as under normal conditions in air firing. In figure 8 is shown the plant layout for the oxyfuel capture scheme, it’s possible to see tat the plant is dived in three big areas: ASU, power plant and flue gas treatment.
29
The efficiency values are calculated in accordance to:
= ̇ ×
Table 8: Main process data and performance for Lipperndorf oxyfuel coal fired
power plant (same data for both blocks)
Oxyfuel PP Performance w FGD w/o FGD Gross electricity output 1203 MW 1176 MW Gross electricity efficiency 47,66 % 45,49 % Net electricity output 865 MWel 865 MWel Net electricity efficiency 34,27 % 33.46 %
Boiler power 2585 MW 2524 MW
Operating time 7500 h/year 7500 h/year
Fuel Raw Lignite Raw Lignite
Fuel demand 240,4 kg/s 246,2 kg/s
O2 demand 221,6 kg/s 226,9 kg/s
Figure 14: Overall process layout for the O2/CO2 plant. The plant scheme is made with
the Lipperndorf plant as reference: (A) air separation unit, (B) power plant, (C) flue gas treatment
30
The flue gas recycled loop in the oxyfuel power plant cause an increased level of SO2 and other impurities in the boiler; however the advantage of this recycle approach is that the flue gas flow entering the cleaning equipment is drastically reduced, which leads to savings in the investments costs. The flue gas treatment basically involves the removal of water and non-condensable gases, whit FGD and without it. Both options are provide, since SO2 may cause problems depending on the type of storage considered. Besides the technical feasibility, a combined underground storage of CO2 and SO2 also depends on political decisions with respect to dumping conventions. To avoid corrosion and hydrate precipitation, a complete dehydration of the flue gas is important. Not only sulphate but also carbon dioxide alone can be corrosive in the presence of water and cause the called sweet corrosion. In this case, the flue gas dehydration is performed in two steps: the first is a traditional flue gas condenser, where most of the water is removed; the second step is the triethylene glycol (TEG) unit. The TEG unit require a pressure of 30 bar to be efficient, for this a compressor step whit inter cooling is installed before the TEG. To reduce the costs and the energy consumptions, the compressors are used only to increase the pressure of flue gas stream (mostly CO2) to allow transition into a liquid phase in two steps: the first from 1 bar to 30 bar which is the inlet pressure of TEG, the second from 30 bar to 58 bar, when carbon dioxide and sulphur dioxide will be liquefied with a temperature of 20 °C, reach by the main cooling system. A high pressure pump is used for the last pressure increase up to 100 bars for the liquid carbon dioxide, before transportation to the injection site.
5.3 Plants efficiency
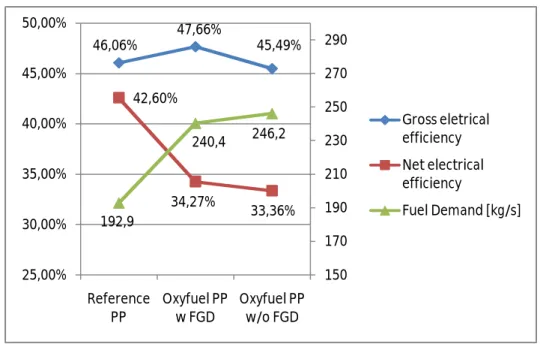
As shown before, the net power output is the same in both cases, but the net electrical efficiency of the plant becomes 34,27% for oxyfuel PP with FGD and 33,46 for oxyfuel PP without FGD; from 42,06% for reference power plant. The figure 15 show the trends of the efficiency rate in the different cases and in the same time show the fuel demand trend that is not constant. Since the motives explained before, in the case of the combined capture of SO2 and CO2, the internal electricity demand is reduced and the net efficiency is slightly increased. In the figure 16 is possible to view as for the same net power output the auxiliary consumptions increase from reference PP to oxyfuel case. In both options of oxyfuel power plant (with or without FGD) is observed a contrary trade between gross electrical efficiency and net electrical efficiency in the oxyfuel cases, also because the fuel demand change between them.
Table 9: Composition of the flue gas stream and emissions to atmosphere from Oxyfuel power plant
Flue gas stream composition Emission to air
Elements kg/h wt% vol% mg/m3n kg/h kg/MWhel
SOx 24120 (SO2) 1,5 0,6 < 6 < 13 0,015
NOx 2160 (N2) 0,2 0,2 < 141 < 190 0,220
CO2 914040 55,3 35,4 < 4 < 5000 5,8
31
5.4 Emissions Analysis
In the table 7 and 9 are shown the data about flue gas stream composition and emission in to the atmosphere for reference PP and oxyfuel PP with and without FGD. The NOx reduction, about 60% is attributed to the absence of thermal NOx as well as a drastic reduction on the conversion ratio of fuel nitrogen to exhaust NOx. The diagram in the figure 17 has built with the data from table 7 and 9; as reported the CO2 emission in the oxyfuel cases is are drastically reduced than reference plant.
865 865 865 68 338 311 0 200 400 600 800 1000 1200 1400
Reference PP Oxyfuel w FGD Oxyfuel w/o FGD
Auxiliary Consumptions [MW] Net Power output [MW]
Figure 16: Output power and auxiliary consumptions Figure 15: Trends of electrical efficiency rates
46,06% 47,66% 45,49% 42,60% 34,27% 33,36% 192,9 240,4 246,2 150 170 190 210 230 250 270 290 25,00% 30,00% 35,00% 40,00% 45,00% 50,00% Reference PP Oxyfuel PP w FGD Oxyfuel PP w/o FGD Gross eletrical efficiency Net electrical efficiency Fuel Demand [kg/s]
32
The figure 18 shown as the SOx and NOx emissions are reduced in relevant quantity from reference PP to oxyfuel PP with flue gas desulphurization.
1,28 0,015 0,53 0,22 0 0,2 0,4 0,6 0,8 1 1,2 1,4 Reference PP Oxyfuel PP
SOx emission [kg/MWhel] NOx emission [kg/MWhel] 855,2 5,8 0 1050,9 0 200 400 600 800 1000 1200 Reference PP Oxyfuel PP
CO2 Captured [kg/MWhel] CO2 Emitted [kg/MWhel]
Figure 17: Carbon dioxide emissions
33
5.5 Cost Analysis
The cost analysis was performed with the same assumptions for the capture and the avoidance cost, in according with the equation used also in the chapter 4, which is shown below. Following the standard power plant economic and assessment criteria introduced by IEA, an interest rate set at 10% and an assumed load factor of 85% (7500 h/year at full capacity) are used in the evaluation. The study was performed on 2005, therefore the price of fuel, the EPC and O&M costs and other economic assumptions are reported to this year. The plant economic life time was set at 20 years.
€ = (€⁄ ℎ) − (€⁄ ℎ) ⁄
( ⁄ ℎ ⁄ − ⁄ ℎ )
w = with CCS w/o = without CCS
The table below shown the final results about cost of electricity, carbon dioxide emissions and avoidance cost
COE (€/MWh) Emission tonCO2/MWh Avoidance cost (€/tonCO2)
Reference PP 32,4 0,855 //
Oxyfuel PP w FGD 49,5 0,0058 20,0
34
6. Advanced supercritical (ASC) pulverized fuel power plant (740 MW
el)
6.1 Reference Power Plant (performances and emissions)
The power plants proposed below, are from [8] where are used as base cases to make a technical and economic comparison. In the first analysis is investigated a conventional air fired pulverized fuel (bituminous coal), with gross power output of 740 MWel. The net efficiency of the power plant is 44,3 %.
Wet coal (average moisture contained 10%) is supplied to the milling plant where is also dried, the air temperature at the mill inlet is typically around 90 °C. The combustion air is preheated to 270 °C in a regenerative preheater. Around 20% of the combustion air is supplied to the mills and transports the pulverised coal pneumatically to the burners. The remaining 80% is supplied directly to the furnace chamber. The heat released by highly radiant flame of the coal burn can be divided in three big part: about 35% is absorbed in the radiant furnace chamber, 15% to the radiant platen super heaters suspended in the upper region of the furnace chamber, and 40% by convective heat transfer to superheater, reheater and economiser surfaces in the boiler and to the airheater, the last 10% is lost with flue gases exhausted to the stack. The excess of air used in this application was 17,5%; in this way the flue gas stream at the boiler exit has the composition shown in table 10.
Table 10: Composition of flue gas at boiler exit for ASC PP
% w/w % v/v kg/s Oxygen 3,45 3,21 23,46 Carbon dioxide 20,92 14,14 142,26 Sulphur dioxide 0,39 0,18 2,65 Water 5,02 8,30 34,14 Nitrogen 70,21 74,18 477,43
35
The flue gases also contain NOx, ash and Hg. The concentration of this element can vary from plant to plant and it is dependent upon the equipment installed and how well in maintained. In this case, with a good level of maintenance and a low NOx burner installed, is reasonable to have a typical level of NOx emission around 350 ppm at 6% O2 v/v dry. The flue gas flow for a power plant with 740 MWel of gross power output is 680 kg/s; the flow for each component of flue gases is shown on the table. The power plant included Selective Catalytic Reduction (SCR) and Flue Gas Desulphurisation (FGD) equipment to meet current NOx and SOx emissions legislation. The main data of the power plant are shown below (Table 11):
Table 11: Main data of the reference power plant
Fuel Bituminous coal
Fuel LHV 25,86 MJ/kg
Fuel demand 59,19 kg/s
Fuel Heat Input 1530.8 MWt
Gross Power Output 740 MWel
Auxiliary consumptions (FW pumps, Condensate, CW pumps, ESP, FGD, DENOx, etc)
63 MWel
Net Power Output 677 MWel
Operating Time 7446 h/year
Gross Efficiency 48,3%
Net Efficiency 44,3%
6.2 Oxy-combustion power plant (performances and emissions)
Applying the oxyfuel combustion capture technology to the reference power plant, is possible to achieve a good results to reduce the greenhouse gas emissions. The principle of operation has been shown before; in this case around one third of the total flue gas flow is recirculated back to the burners to keep under control the furnace temperature. The air is separated prior to the furnace in an ASU plant, only the oxygen is supplied to the combustion process, the nitrogen/argon is vented to atmosphere, the oxygen flow (127,1 kg/s) is supplied at 95% v/v purity. The flue gas is cooled and passed to the CO2 compression and inerts separation system, the pure CO2 stream is finally compressed to pipeline pressure of 110 bars. The figure 20 shows the plant arrangement. It is possible to see the flue gases treatment process and the air separation unit.
36
The oxygen excess (to ensure a complete combustion) is maintained at 19% over the amount required for stoichiometric combustion; it is a similar level of excess air with air firing. Two recycled flows are required for the oxyfuel combustion scheme: the primary is necessary to transport the pulverized fuel from the mills to the burner; the secondary is to keep under control the temperature in the furnace. The combination of them is around 67 % of the original flue gas leaving the economiser. The flue gas stream exiting from the boiler is used to heat the primary and the secondary recycle flue gas streams. After ESP the clean flue gas stream is split into two, one stream forming the secondary recycle and returning back through the gas /gas heater to the burner. The remaining flue gas is cooled, dried and split again to form primary recycle and CO2 product streams. The primary recycle is heated and delivered to the coal mills, this flow dries and transports to the burner, the pulverized coal. The remaining flue gas is compressed and the inerts are removed from it, to obtain a final CO2 product of 95% v/v purity at 110 bar of pressure. Associated with some technical advantages, there are disadvantages about the impurities in the flue gas (SO2 and HCl, etc) and the temperature level in the ESP. The NOx and SOx emissions, compared with reference scheme, are proposed uncontrolled (no SCR and no FGD). All soluble acid gas in the primary recycle and net CO2 product gas streams are removed by direct contact water scrubbing. In coal mills there are not tendency for any condensation of acid components or water. The corrosion effects from SO2 and NOx can be avoided with a sufficient dehydration; in all cases if a major purity of CO2 product is required, it’s possible to achieve low levels of SO2 and NOx with a distillation unit included in the carbon dioxide purification system, which separates them as a concentrate liquid at 30 bar pressure. The NOx level present in the flue gas exiting the boiler in the oxy-combustion PF is approximately 50% of the NOx emissions expected for similar sized air fired PF plant. The concentration of SO2, SO3 and HCl in the net flue gas product and recycle flue gas
37
streams depends only on the sulphur content and the chlorine content of the coal feed respectively and it is independent of the recycle rate back to the boiler which is adjusted to control the combustion temperature. In this case the CO2 capture plant produces CO2 at >95 mol% using a simple process that gives the required purity at high (>90%) recovery. It possible to modify this process to obtain high purity, the main penalties for the increased CO2 purity are the reduction in CO2 captured performance and an increase in the amounts of NO2 and SO2 vented in atmosphere. The data about the CO2 emissions for both cases are shown in table 12.
Table 12 - CO2 emission for both cases
CO2 Emission CO2 Specific Emission CO2 Captured
Reference ASC PF power plant 489 t/h 723 Kg/MWh -
Oxyfuel ASC PF power plant 45 t/h 84 Kg/MWh 831 Kg/MWh
The table below (Table 13) shows the performance data for ASC PF oxy-combustion power plant with CO2 capture. 723 84 0 831 0 100 200 300 400 500 600 700 800 900 1000 Reference PP Oxyfuel PP CO2 Captured (Kg/Mwh) CO2 Emitted (Kg/MWh)
Table 13: Main data of ASC PF oxy-combustion power plant with CO2 capture
Fuel Bituminous coal
Fuel LHV 25,86 MJ/kg
Fuel demand 58,09 kg/s
Fuel Heat Input 1502,2 MWt
Gross Power Output 737 MWel
Auxiliary consumptions (FW pumps, Condensate, CW pumps, ESP, ASU, CO2 compression, auxiliary)
205 MWel
Net Power Output 532 MWel
Operating time 7446 h/year
Gross Efficiency 49,1 %
Net Efficiency 35,4 %