EXPLORING MARKET FORCES FOR
TRANSMISSION EXPANSION AND
GRID STORAGE INTEGRATION
A technical-economic thesis about variation moderators for intermittent renewable power generation in the developed country of Sweden and the developing country of China
ERIKSSON, PERNILLA SUNDELL, MARTIN
The School of Business, Society and Engineering Course: Degree Project in Industrial Engineering and Management
Course Code: FOA402
Subject: Industrial Engineering and Management Credits: 30.0 credits
Program: Master of Science – Industrial Engineering and Management
Supervisor: Cecilia Lindh Examiner: Anette Hallin
Company Supervisor:Stefan Thorburn, ABB Date: 2015-06-05 E-mail: pen09002@student.mdh.se msl09002@student.mdh.se
ABSTRACT
Intermittent renewable power generation increases globally. In Sweden, installed wind power capacity has increased most of all electricity sources the last few years and China is today the world’s largest wind power producer. This on-going development increases the demand of flexible regulating measures to reduce wind curtailment and secure a reliable electricity supply. Two technical solutions that can provide such flexibility is transmission expansion and integration of grid battery storage. The transmission grid can transmit energy geographically, while grid storages have the potential to store energy over time to provide energy output when necessary.
This master thesis examines market forces for transmission and grid storage development as variation moderators in a power system containing an increasing share of intermittent renewable power generation. Two countries with diverse market conditions are studied; a developed country as Sweden and a developing country as China. Since the market for grid battery storage is emerging, potential market entry barriers are investigated. A cost-benefit model has been created to examine which alternative of transmission expansion and lithium-ion battery storage integratlithium-ion is the most cost-effective in a system perspective. Several cases have been studied in the model, including cost reductions of lithium-ion batteries and the impact of wind curtailment.
Based on the results from the cost-benefit model and the market analysis, it can be concluded that cost reductions of lithium-ion batteries are crucial for grid storage market penetration. Another important driving force for future development of grid storage is establishment of a regulatory framework. Furthermore, grid storage is found to be most suitable for peak shaving and transmission deferral applications due to its flexibility. The fact that storage facilities can be realized in a shorter timeframe compared to transmission grid expansion is also an advantage for grid storage development, since problems related to congestion can be reduced earlier. However, uncertainties related to the low market experience of grid battery storage technologies can be in favour for transmission expansion in future investment decisions.
Keywords: Grid storage, energy storage, lithium-ion battery, transmission grid expansion,
variation moderator, variation management, regulating powers, intermittent power generation, market analysis, market entry barriers, cost-benefit model, cost-benefit analysis, driving forces, market drivers, China, Sweden, emerging technology, wind curtailment, congestion.
ACKNOWLEDGMENTS
This thesis is a result of the final examination moment for our degree in Master of Science in Industrial Engineering and Management at Malardalen University in Vasteras, Sweden. The field of research has been conducted on behalf of ABB Corporate Research in Vasteras, Sweden, during spring 2015. To further increase the international aspect of the thesis work, half of the project time was spent at North China Electric Power University in Beijing, China. We would like to thank all the people who has been involved in this research work and to some extent contributed to its execution. A special thanks is devoted to the following persons:
PhD. Stefan Thorburn, ABB Corporate Research Prof. Erik Dahlquist, Malardalen University PhD. Cecilia Lindh, Malardalen University
PhD. Qiang Lu, North China Electric Power University
Martin Sundell
Vasteras, 2015-06-05
Pernilla Eriksson Vasteras, 2015-06-05
CONTENTS
Introduction ... 1
1.1 Background ... 1
1.1.1 Wind Power Growth ... 2
1.1.2 Intermittent Power Generation Challenges ... 3
1.1.3 Variation Moderators ... 3 1.1.3.1 Transmission ... 4 1.1.3.2 Energy Storage ... 4 1.2 Purpose ... 6 1.3 Research Questions ... 6 1.4 Expected Contributions ... 7 Methodology ... 9
2.1 Research Design and Approach ... 9
2.2 Data Collection... 10
2.3 Research Approach Quality... 10
2.3.1 Validity and Reliability ... 11
2.4 Cost-Benefit Analysis ... 12
2.4.1.1 Annualized Cost-Benefit Analysis ... 15
Market Conditions ... 17
3.1 The Swedish Electricity Market ... 17
3.1.1 Electricity Generation ... 21
3.1.2 A Competitive Market ... 21
3.1.3 Upcoming Challenges ... 22
3.1.4 Future Scenarios ... 23
3.2 The Chinese Electricity Market ... 25
3.2.1 Electricity Generation ... 26
3.2.2 A Controlled Market ... 26
3.2.3 Upcoming Challenges ... 27
3.2.4 Emerging Market ... 30
Market Analysis Variation Moderators ... 33
4.1 Grid Storage ... 33
4.1.1 Market Entry Barriers ... 33
4.1.1.1 Ownership Uncertainties ... 33 4.1.1.2 Operation Uncertainties ... 34 4.1.1.3 Government Policies ... 35 4.1.1.4 Product Diversity ... 36 4.1.1.5 Competition ... 37 4.1.1.6 Capital Requirements ... 38 4.1.1.7 Market Experience... 38 4.1.1.8 Technical Performance ... 38
4.1.1.9 Changing Market Conditions... 39
4.1.2 Market Forces ... 39
4.1.2.1 Technology Development ... 39
4.1.2.2 Congestion and Security ... 41
4.1.2.3 Wind Curtailment ... 42
4.1.2.4 Economic Incitements ... 43
4.2 Transmission ... 45
4.2.1 Market Forces Sweden ... 45
4.2.2 Market Forces China ... 47
Cost-Benefit Model ... 51
5.1 Case Descriptions ... 51
5.2 Cost Descriptions ... 52
5.2.1 Investment Cost Transmission ... 52
5.2.2 Investment Cost Grid Storage ... 53
5.2.3 Reinvestment Costs ... 54
5.2.4 Operation and Maintenance Costs ... 54
5.2.5 Planning and Construction Cost ... 55
5.2.6 Residual Value ... 55
5.3 Benefit Descriptions ... 55
5.3.1 Renewable Energy Time Shifting ... 56
5.3.2 Renewable Load Following ... 56
5.3.3 Electric Service Reliability ... 57
5.4 Capacity Constraints ... 57
5.5 Distance Constraints ... 58
5.6 Input Data Sweden... 59
5.7 Input Data China ... 62
5.8 Objective Function ... 64 5.9 Constraints... 64 5.10 Variables ... 65 5.11 Equations ... 65 5.12 Results ... 66 5.12.1 Sweden ... 66 5.12.1.1 Case 1 ... 66 5.12.1.2 Case 2 ... 66 5.12.1.3 Case 3 ... 67 5.12.1.4 Case 4 ... 67 5.12.1.5 Case 5 ... 67 5.12.1.6 Case 6 ... 67 5.12.1.7 Case 7 ... 68 5.12.1.8 Case 8 ... 68 5.12.2 China ... 68 5.12.2.1 Case 1 ... 68 5.12.2.2 Case 2 ... 68 5.12.2.3 Case 3 ... 69 5.12.2.4 Case 4 ... 69 5.12.2.5 Case 5 ... 69 5.12.2.6 Case 6 ... 69 5.12.2.7 Case 7 ... 70 5.12.2.8 Case 8 ... 70 Discussion ... 72 6.1 Market Conditions ... 72 6.1.1 Sweden ... 72 6.1.2 China ... 73 6.1.3 Market Contrasts ... 74
6.2 Driving Forces ... 74
6.2.1 Grid Storage ... 74
6.2.2 Transmission ... 75
6.3 Cost-Benefit Model ... 77
6.3.1 The Impact of Li-ion Battery Cost Development ... 77
6.3.2 The Impact of Residual Value ... 77
6.3.3 The Impact of Wind Curtailment ... 77
6.3.4 The Impact of Benefits ... 78
6.3.5 Source of Errors ... 79
Conclusions ... 81
Future Research ... 84
APPENDIX
APPENDIX I – CODE COST-BENEFIT MODEL SWEDEN APPENDIX II – INPUT DATA SWEDEN
APPENDIX III – CODE COST-BENEFIT MODEL CHINA APPENDIX IV – INPUT DATA CHINA
LIST OF FIGURES
Figure 1: Martin Sundell and Pernilla Eriksson at North China Electric Power University in
Beijing, China ... ii
Figure 2: Installed Wind Capacity in the World, Source: (Global Wind Energy Council, 2014) ... 2
Figure 3: Installed Wind Power top 10 countries 2013 [MW], Source: (Global Wind Energy Council, 2014) ... 2
Figure 4: Installed Wind Power Capacity, Source: (The Wind Power, 2013a) ... 2
Figure 5: Share of Wind Power Generation Capacity, Source: (U.S. Energy Information Agency, 2012a) (The Wind Power, 2013b) (The Wind Power, 2013) (Energimyndigheten, 2014) ... 2
Figure 6: Impacts of wind power on power systems, displayed by time and spatial scales, Source: (Holttinen, et al., 2011, p. 180) ... 4
Figure 7: Predicted cost trends for full automotive Li-ion battery packs. Source: (Climate Spectator, 2014) ... 6
Figure 8: Three layers of factors generated by infrastructure project, Source: (THINK, 2013) ... 13
Figure 9: Comprehensive list of effects, Source: (THINK, 2013) ... 14
Figure 10: Reduced effect mapping, Source: (THINK, 2013) ... 15
Figure 11: Social costs of non-competitive pricing, Source: (Posner, 1975) ... 18
Figure 12: Electricity areas in the Nordic countries, Source: (Svenska Kraftnät, 2013b, p. 16) ... 19
Figure 13: Swedish Power Grid, Source: (Svenska Kraftnät, 2014a) ... 20
Figure 14: Sweden’s Electricity Generation 2012, Source: (U.S. Energy Information Agency, 2012a) ... 21
Figure 15: Expected wind capacity 2017, Source: (Global Wind Energy Council, 2014) ... 23
Figure 16: Demand of variation moderators with increased amount of wind power, Source: (Svenska Kraftnät, 2013a) ... 24
Figure 17: China’s Electricity Generation 2012, Source: (U.S. Energy Information Agency, 2012a) ... 26
Figure 18: Feed-in-tariffs for onshore wind power, Source: (Hu, et al., 2013) ... 27
Figure 19: Locations of wind farms and electricity demand centres, Source: (Li, et al., 2012) ... 28
Figure 20: Percentage of curtailed wind generation by province in 2011, Source: (Clavenna, 2012) ... 29
Figure 21: Historical cost of Li-ion battery packs, Source: (Nykvist & Nilsson, 2015) ... 40
Figure 22: Transmission Deferral, Source: (THINK, 2013) ... 41
Figure 23: Wind curtailment as a function of wind energy penetration, with and without a 500 MW storage device. Source: (Silva-Monroy & Watson, 2014) ... 43
Figure 24: Energy storage projects in China. Source: (Littlewood, 2013) ... 45
Figure 25: Supply and demand side bid representation ... 46
Figure 26: Age of 400 kV and 220 kV grids in the Swedish national grid, Source: (Svenska Kraftnät, 2013b, p. 90) ... 47
Figure 27: Ratio of accumulated investment in power grid and power generation since 1978, Source: (Li, et al., 2012) ... 49
Figure 29: Main sections of EES systems and energy losses, Source (Zakeri & Syri, 2014) .. 54
Figure 30: St. Clair Curve, Source: (Hao & Xu, 2008) ... 58
Figure 31: Case 1 Sweden ... 66
Figure 32: Case 2 Sweden ... 66
Figure 33: Case 3 Sweden ... 67
Figure 34: Case 4 Sweden ... 67
Figure 35: Case 5 Sweden ... 67
Figure 36: Case 6 Sweden ... 67
Figure 37: Case 7 Sweden ... 68
Figure 38: Case 8 Sweden ... 68
Figure 39: Case 1 China ... 68
Figure 40: Case 2 China ... 68
Figure 41: Case 3 China ... 69
Figure 42: Case 4 China ... 69
Figure 43: Case 5 China ... 69
Figure 44: Case 6 China ... 69
Figure 45: Case 7 China ... 70
Figure 46: Case 8 China ... 70
Figure 47: Acknowledged Driving Forces - Grid Storage ... 75
Figure 48: Acknowledged Driving Forces – Transmission in Sweden ... 76
Figure 49: Acknowledged Driving Forces – Transmission in China ... 76
LIST OF TABLES
Table 1: Abbreviations ... ix
Table 2 Advantages and disadvantages of storage technologies, Source: (Insight_E, 2014) (Evans, et al., 2012) ... 5
Table 3: Electric Service Reliability Validation ... 57
Table 4: General Input Data Model, Sweden ... 59
Table 5: Input Data Grid Storage Model, Sweden ... 60
Table 6: Input Data Transmission Model, Sweden ... 61
Table 7: General Input Data Model, China ... 62
Table 8: Input Data Grid Storage Model, China ... 63
ABBREVIATIONS
Table 1: Abbreviations
ALCC Annualized Life Cycle Cost
ACBA Annualized Cost-Benefit Analysis
CAES Compressed Air Energy Storage
CBA Cost-Benefit Analysis CHP Combined Heat and Power
CNY Chinese Yuan
CO2 Carbon dioxide
CS Consumer Surplus
CSG China Southern Power Grid DSM Demand Side Management DSO Distribution System Operator
EU European Union
GW Gigawatt
GWh Gigawatt hours
h Hours
Hz Hertz
ICT Information & Communication Technology
km Kilometer kW Kilowatt kWh Kilowatt hours Li-ion Lithium-ion MW Megawatt MWh Megawatt hours Na-S Sodium-sulphur
NDRC National Development and Planning Commission
NEA National Energy Administration
O&M Operation & Maintenance
OECD Organisation for Economic Co-operation and Development
PHS Pumped hydro systems
RI Reinvestment
SEK Swedish Krona
SERC State Electricity Power Regulatory Commission
SGCC State Grid Corporation of China
SMES Superconduction Magnetic Energy Storage
SPC State Power Corporation SS Supplier Surplus
TSO Transmission System Operator
TW Terawatt
TWh Terawatt hours
U.S. United States
INTRODUCTION
This chapter intends to give an introduction to the subject of this master thesis. Firstly, a wide background presentation to this thesis is provided. This includes underlying challenges that lays the foundation to this thesis. Thereafter the purpose is clarified, along with research questions and expected contributions of this study.
1.1 Background
Renewable energy sources continue to increase worldwide. Cost-competitiveness is improving as renewable energy sources are promoted by energy policies. Ambitions to intensify low-carbon energy technologies are increasing, both in developed and developing countries. (International Energy Agency, 2014) This leads to challenges in global and country-specific energy markets.
A challenge on the global energy market is the declining nuclear capacity. This trend is acknowledged by the International Energy Agency (2014) as several nuclear plants are ageing or are non-profitable in OECD countries. The International Energy Agency (2014) predicts insufficient global nuclear capacity in 2025, where new reactors are providing a modest capacity increase.
In Sweden, power capacity from the three oldest nuclear power plants must be replaced by other energy sources. Svenska Kraftnät (2014c) does not expect these aging plants to be substituted by new nuclear power plants, resulting in less nuclear power in a near future. This might lead to future power shortage in the Swedish electricity mix, involving congestion and impaired power balance in some regions (Svenska Kraftnät, 2014c).
In order to cover the gap from nuclear power, and at the same time achieve energy and climate targets set by Sweden and the European Union (EU), the share of renewable energy sources in the power system is expected to increase (Svenska Kraftnät, 2014c). The European Commission (2015) includes a target of minimum of 27 percent share of renewable energy consumption by 2030. Sweden alone has set the energy target to 49 percent share of renewable energy already by 2020. This includes a target of reaching 30 TWh from wind power generation by 2020, corresponding to approximately 20 percent of Sweden’s total electricity generation. (Swedish Energy Agency, 2011)
Similarly to Sweden, China also faces major challenges regarding the national electricity generation. High level of air pollution, particularly in large cities as Beijing, has led to regulated targets to reduce air pollutions in the fast growing country. (Reuters, 2014). A reduction of fossil fuel combustion together with enlarged public environmental awareness is expected to promote generation from renewable energy sources. China has agreed to reach its peak in carbon dioxide (CO2) emissions in 2030 and by then have a 20 percent share of
renewable energy. In order to reach this target, an amount of 1 000 GW non-carbon emitting power such as nuclear, solar and wind power must be installed. (Scientific American, 2014)
1.1.1 Wind Power Growth
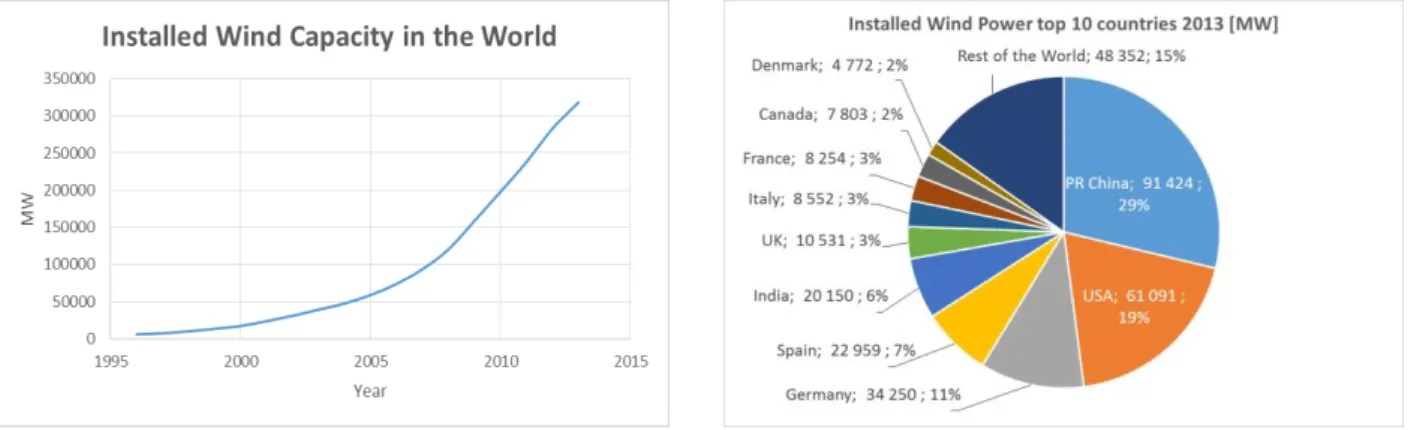
Wind power has increased most of all electricity sources in Sweden the last few years and China is the world’s largest wind power producer, as seen in Figure 3. The wind industry is promoted by governmental support systems in several countries all over the world, where mass production and technology development has contributed to cheaper turbines. As seen in Figure 2, the global installed wind capacity is increasing each year and has almost tripled the last five years, from 120 000 MW in 2008 to 320 000 MW in 2013. (Global Wind Energy Council, 2014)
Figure 2: Installed Wind Capacity in the World, Source: (Global Wind Energy Council, 2014)
Figure 3: Installed Wind Power top 10 countries 2013 [MW], Source: (Global Wind Energy Council, 2014)
The installed wind power capacity has increased in Sweden but especially in China as Figure 4 shows. The increasing installed wind power capacity in Sweden and China also yields a higher share of wind power in the total generation capacity mix. Sweden had almost 10 percent wind power of total electricity production capacity year 2012 and China had more than 5 percent wind power installed same year. The growth in share of wind power capacity from 2005 to 2012 can be seen Figure 5 below.
Figure 4: Installed Wind Power Capacity, Source: (The Wind Power, 2013a)
Figure 5: Share of Wind Power Generation Capacity, Source: (U.S. Energy Information Agency, 2012a) (The Wind Power, 2013b) (The Wind Power, 2013) (Energimyndigheten, 2014)
1.1.2 Intermittent Power Generation Challenges
Even though wind power increases rapidly due to its environmental benefits, new challenges arise in the power system. Wind power generation is more intermittent and unpredictable than conventional energy sources due to weather conditions with seasonally and daily variations. Seasonal variations are repeated annually and are hence relatively predictable. Unpredictable variations are caused by weather changes, leading to forecast errors and generation challenges. (The Boston Consulting Group, 2010)
Real-time balance between load and generation must be maintained. Output fluctuation from renewable energy sources influences system operation of frequency control, which often is accomplished by conventional thermal generators operated to adjust the frequency. (IEC, 2011) When generation from intermittent energy sources is high, load should increase or output from conventional power generators should be reduced. If scheduling is uncoordinated or if transmission capacity is limited, there is a risk that energy is curtailed. (Li, et al., 2015) Wind energy curtailment occurs when wind is available but not utilized for electricity generation in wind power plants. When generation exceeds demand on windy days, there is a risk of extremely low electricity prices on the spot market. Surplus power generation can be exported, provided that there is sufficient transmission capacity, or energy is curtailed. When there is a large power demand and less wind, regulating measures and balancing power is required. (IEC, 2011) Intermittent energy sources thereby require variation moderators to reduce wind curtailment and meet demand.
It is essential to find a cost-effective solution for regulating power in order to secure the electricity supply. Power reserves systems currently available have either geographical or financial downsides. For example, hydropower has geographical limitations and is often too remote from potential wind sites. (Li, et al., 2012) To provide optimistic investment outlooks for renewable energy technologies, energy policies are crucial. Cost-competitiveness is improving in some countries, depending on market strategies. (International Energy Agency, 2014) The Boston Consulting Group (2010) has anticipated Europe to be the first area to face variation problems from intermittent power generation. A compensating capacity of 100 GW is expected to be required in 2025, due to increased amount of intermittent electricity generation. (The Boston Consulting Group, 2010)
1.1.3 Variation Moderators
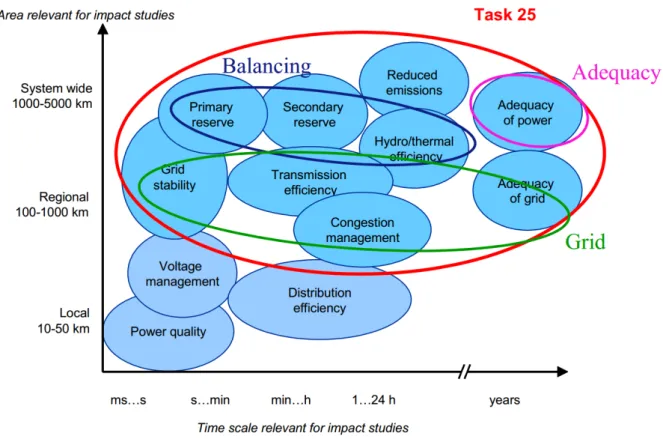
Increased share of intermittent wind power in the system requires enhanced variation moderators to balance generation and varying demand at all times. Interconnections and integration of generation, transmission planning and market are all aspects affected by this change in the energy system. These aspects have different positions, time frames and impacts on the system, as displayed in Figure 6. The system wide impacts have been divided into three focus areas; balancing and adequacy of power and grid. Primary reserves are short-term reserves that need to be activated in seconds, for example frequency regulation. Secondary reserves are activated in 10 to 15 minutes, for example load following reserves. A higher share of wind power entails extra investment costs. These costs arise from operational balancing and grid reinforcement costs, such as large-scale energy storage and transmission
investments. However, total operating costs and emissions can be reduced as wind replaces fossil fuels. (Holttinen, et al., 2011)
Figure 6: Impacts of wind power on power systems, displayed by time and spatial scales, Source: (Holttinen, et al., 2011, p. 180)
There are several examples of variations moderators that can provide flexibility to an intermittent power system. For example energy can be transferred through geographical transmission or stored over time in an energy storage.
1.1.3.1 Transmission
The electric power transmission systems transmit electricity from electric generators, such as hydro power plants, nuclear power plants or wind power plants, to electrical substations located near load centres. To reduce losses over long distances, electricity is transmitted at high voltages, 120 kV or above. (World Nuclear Association, 2015) Since transmission infrastructure depends on country specific conditions, further details are explained in chapter 3 for the transmission infrastructure in Sweden and China. By having a well-developed transmission grid, power generation from example wind farms can be transmitted to another geographical location, provided that the transmission capacity is sufficient. Trustworthy forecasts of weather and demand are advantageous to transmit a stable power supply (The Boston Consulting Group, 2010).
1.1.3.2 Energy Storage
Another option to regulate power from intermittent generation is by storing energy over time. There are numerous of research work that advocates integration of large-scale energy storage
into the power system with the purpose to provide variation capacity in the intermittent power system. Various energy storage technologies keep developing towards grid usage (Anuta, et al., 2014) (Evans, et al., 2012) (The Boston Consulting Group, 2010) (Lund & Münster, 2003). To compensate for short and long term energy interruptions there is also a need for different types of energy storages. Individual needs will be important in the choice of energy storage systems, but incorporation of several energy storage systems will also be necessary as large amount of energy is required (Evans, et al., 2012). However, integration of large-scale energy storage technologies is associated with potential market entry barriers, since the market for several storage technologies is not yet mature.
Energy can be stored in many different forms and can be divided into four different categories; mechanical, electrical, thermal and chemical energy, each offering different advantages and disadvantages. (Evans, et al., 2012) In Table 2, advantages and disadvantages have been summarized for storage technologies appropriate for intermittent balancing.
Table 2 Advantages and disadvantages of storage technologies, Source: (Insight_E, 2014) (Evans, et al., 2012)
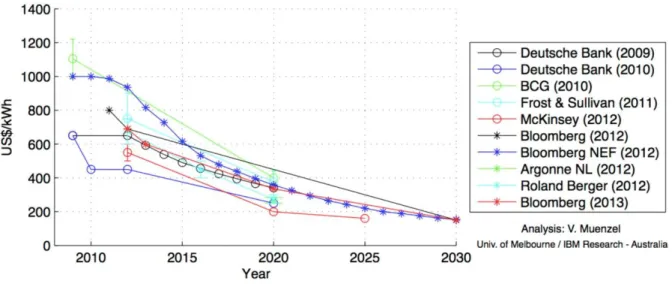
As Table 2 shows, there are many different technologies for storing energy. One of them are lithium-ion (Li-ion) batteries which is a fast developing technology. It has high energy to weight ratio, high efficiency, high energy and power density. No memory effect and low self-discharge are also some advantages with Li-ion batteries. The cost is currently high and it has some safety concerns regarding the materials in the batteries, which require sophisticated battery management. (Evans, et al., 2012) However, costs are expected to decrease as other industries drive the technology development forward (Insight_E, 2014) (Eyer & Corey, 2010). This can also be seen in Figure 7 below. Several references from the industry believe that
Li-Technology Advantages Disadvantages
Mechanical strorage
PHS Large scale, efficient, commercial Site dependent, low energy density, potential environmental impact
CAES Cost efficient, large scale, scalable Low energy density, large scale requires natural storage cavity (can be limited)
Flywheel High power density, efficient, scalable Cost, energy density
Electrical storage
Capacitors Long cycle life, high efficency Low energy density
Supercapacitors Power density, response time, efficient, cycle time Low energy density, relatively high cost
SMES Power density, response time, efficient Low energy density, cost, commercialisation
Thermal storage
Steam accumulator Relatively low cost, manufacturing Low energy density
Hot water accumulator High heat density, high energy density, long life cycle Slow charge and discharge rate
Chemical storage
Lead-acid battery Wide availability, reasonable low cost Low specific energy and power, short life time, high maintenance, temperature sensitive, Na-S battery Long life cycle, high energy density, mature High cost, high self-discharge, temperature
sensitive Li-ion battery High energy and power density, scalable, high
efficiency, no memory effect, low self-discharge, other applications drives cost down
High cost, material safety concerns
ion batteries will be a market leading technology for grid storage applications (Climate Spectator, 2014) (Nykvist & Nilsson, 2015). Considering this development, Li-ion battery storage technology becomes interesting to further examine in this thesis.
Figure 7: Predicted cost trends for full automotive Li-ion battery packs. Source: (Climate Spectator, 2014)
1.2 Purpose
This master thesis consists of two parts. The initial purpose is to explore market forces for transmission and grid storage development as variation moderators for intermittent power generation. Since battery grid storage is an emerging technology, market entry barriers for integrating storage into the grid aims to be identified.
The second part of the thesis aims to investigate the most beneficial combination of grid storage integration and transmission expansion in the future power system, in a system perspective.
1.3 Research Questions
In order to fulfil the purpose of the study, the following research questions have been addressed:
RQ1: What are the market entry barriers for integrating energy storage into the grid and
what drives the development of grid storage and transmission, respectively?
RQ2: How do these market forces affect the choice of variation moderators in the future
1.4 Expected Contributions
Several technical solutions are today available providing flexibility in the future power system. According to the International Energy Agency (2014), the main question is not how to bring flexibility to the power system, but which alternative is the most lucrative. This master thesis is expected to investigate the most lucrative combination of grid storage integration and transmission expansion by introducing a cost-benefit model.
Previous work within the area partly includes regional integration with separate plans of variation management. Göransson (2014) examines power system containing a large share of wind power and emphasis that intermittent energy sources will play an important role in the future. However, what kind of technologies complementing these intermittent energy sources is yet uncertain. (Göransson, 2014) Variation moderators such as transmission and storage, which this master thesis will focus on, can provide regulation of intermittent wind power. Previous research work indicates a lack of research within the area. According to Göransson (2014) an important subject in future work is to:
“…find a balance between centralized (e.g., transmission investments and trade with hydropower-rich Nordic countries) and decentralized (e.g., regional storage and DSM) efforts to manage variations.”
This master thesis will cover two potential solutions to manage variations from intermittent energy sources. The thesis is expected to contribute to a greater basis of research within the area and provide market indications for future investment decisions when planning Sweden’s and China’s power systems. By increased knowledge about driving forces, potential barriers, costs and benefits that influence the market conditions for these variation moderators, this master thesis imply material for decision making on the future power market.
The thesis is also expected to contribute to a general system perspective of introducing grid storage on the global power market. However, since grid infrastructure is country specific, a comparison is performed between transmission and storage in two diverse market conditions. Craig & Douglas (2005) support the international viewpoint and emphasize the importance of performing research with a global perspective, as markets constantly change and businesses are becoming more global.
METHODOLOGY
This chapter covers the methodology of this research work. Firstly, the research design and approach is explained. This is followed by describing the data collection method and research approach quality. Lastly, the method of the Cost-Benefit Analysis is further clarified.
2.1 Research Design and Approach
This master thesis has been conducted by an inductive approach. Data gathered has led to increased knowledge within the field of study. Thereafter, scientific theories have been used to further increase knowledge about the findings. This has also laid a foundation to the first version of the cost-benefit model. Then, additional reading within the field of study was conducted and the model was developed further. This process was made in several steps, thereby with an inductive approach. Although this approach could be time-consuming, according to Bryman & Bell (2011) and Blomkvist & Hallin (2014), it was still chosen due its advantage for exploratory studies, such as this thesis work.
Based on this study’s research questions and its purpose, it can be concluded that this study is of an interpretivist nature. According to Bryman & Bell (2011), interpretivism is a term for research that focuses on social phenomena rather than natural sciences. This kind of study requires a different research approach that respects the differences between people and the objects of the natural science. An interpretivistic approach does not focus on quantitative data but rather on qualitative data where the research is conducted in close interaction with what is being researched. (Bryman & Bell, 2011)
In order to answer the research questions, a case study research design has been chosen. This kind of research method is suitable for previous unexplored areas according to Bryman & Bell (2011) and Blomkvist & Hallin (2014), such as this research area. Data has been gathered by a qualitative approach and developed towards two different cases; one for a developed market, Sweden, and one for a developing market, China. A cost-benefit model has been constructed by data gathered and thereafter a Cost-Benefit Analysis (CBA) was made with the purpose to study the cases for each country. The CBA and the cost-benefit model is further examined in section 2.4 and in chapter 5.
The actual research procedure consisted firstly of building an understanding of the issue with a high share of intermittent power generation in the power system. Grid storage and transmission was chosen to be the two technologies in focus and further investigated in this research. Then an understanding for the emerging technology energy storage’s market entry barriers, further development and future potential in the energy infrastructure had to be conducted. This applied also for transmission, but since transmission is a mature technology in the energy infrastructure, this part had a different approach with focus on its current driving forces. To create this understanding, an extensive literature survey within the field of study
was made. Further, this continuously increased understanding has been connected with scientific theories, such as market entry and market conditions, during the process. Furthermore, a cost-benefit model for the two different countries was conducted with data gathered in the literature survey as its foundation, together with country specific data for grid storage and transmission. The model has been constructed and developed simultaneously as knowledge from the literature survey has increased during the work. This inductive approach applies for both technologies and also for the market analysis.
2.2 Data Collection
The literature survey in this research is essential to understand the context of the problem and find information available in the field of study. Previous research in the area laid a foundation to this thesis, together with information from different governmental and industry organizations and consulting reports. Statistics about electricity generation and consumption in respectively country has been gathered through the Global Wind Energy Council, the U.S. Energy Information Agency and Svenska Kraftnät. Information about the electricity markets, together with information about energy storage and transmission, has been found through multiple sources including academic journals, consultant reports and governmental organizations.
The material is retrieved from the Internet and databases for scientific research, including Google Scholar, Discovery, Diva and IEEE Xplore. Information have also been found at different Swedish governmental organizations, like The Swedish Energy Agency (Energimyndigheten), The Swedish Transmission System Operator (TSO), Svenska Kraftnät and industry organizations such as Svensk Energi and Svensk Vindenergi. They present information about the current electricity market and the transmission grid as well as future plans of expansion. There are also a few consultant reports, from companies such as Sweco, Ramböll, The Boston Consulting Group and Lazard, which are relevant for the study. Information gathered from these consultant reports includes potential future scenarios. Available information about China was limited, in particular from governmental organizations. Most of the collected information comes from previous academic research in the field of study and different news releases from websites.
2.3 Research Approach Quality
Bryman & Bell (2011) argues that reliability and validity are important criteria’s to consider when establishing and assessing the quality of a qualitative research. However, some researchers’ claims that validity has less relevance in qualitative research since measurements are not a major preoccupation among qualitative researchers. This would mean that validity has little influence on such studies. (Bryman & Bell, 2011)
2.3.1 Validity and Reliability
Validity refers to whether or not the purpose is met and research questions are answered. Validity is achieved by confirming that the literature survey and theory is connected to the purpose and the research questions. (Blomkvist & Hallin, 2014, p. 50) (Bryman & Bell, 2011) The validity in this research has been achieved by reconstructing the research questions to fit the context in the study, since the study has developed during the process and slightly changed direction. Increased knowledge in the field of study has led to interesting findings that have affected the research focus area. However, comparing grid storage and transmission as variation moderators for intermittent power generation is an emerging field, which yields that validity cannot be guaranteed completely. Further, there is a lot of previous research of the variation moderators separately, as well as research on how to enter a new market and differences between developed and developing countries. This enhances the validity in this study. Moreover, Craig & Douglas (2005) acknowledge the challenges of collecting comparative data and analyse results for diverse market environments. Several factors can cause difficulties in achieving comparable results between developed and developing countries. It is generally easier to use the same research approach for similar market environments. (Craig & Douglas, 2005) Nevertheless, Craig & Douglas (2005) argue that the research work can increase validity and support decision making if these challenges are addressed in a reasonable way.
Reliability refers to the consistency of a concept measure; to what extent the results of the study would differ if another researcher repeated the research. (Bryman & Bell, 2011) The limitation of adequate accessible market data affects the reliability of the study. Battery grid storage is an emerging technology and few market studies have been performed where the market conditions for storage is compared with another variation moderator, such as transmission. This makes this thesis a pioneer in the field of study, but it also creates some uncertainties regarding its reliability. Since it is a high topic subject and there is a lot of on-going development within the field of study the market conditions changes all the time, which affects the reliability of the results in the study. The market analysis and the conclusions are based on information available at present time. It is most likely that new information will be available for another researcher in the future.
Further, evaluating costs for energy storage is challenging, as there is limited information about economic performance of the few sites existing today. This research work considers market entry of an emerging technology at an early stage. According to Craig & Douglas (2005), the work should therefore be observed in a long-term perspective and aim to initiate further research within the area. Since many markets move quickly, trends need to be identified at an early stage. Also a long-term perspective is important when perceiving market potential (Craig & Douglas, 2005). Craig & Douglas (2005) also acknowledge the importance of entering a market at an early stage of the market development to avoid competition from other actors. Diverse approaches and methods for cost calculations and estimations are used in the literature. Furthermore, Zakeri & Syri (2014) claims that data for expenses cannot be appropriately scaled for larger or smaller storage sizes. This has been an issue during the design of the model that of course affects the reliability of the results. This has also been the case for data about current transmission projects. Since there have not been many transmission projects in the recent years of the appropriate size in Sweden, data from only one projects has been used. This affects the reliability of the results. In China, there are on-going
projects in present time in appropriate size but due to China’s restrictions of sharing information limited data was available. However, since an extensive data collection has been performed and no more up-to-date data could be found, reliability can be considered to be achieved. The thesis work was also performed under a limited time frame. The CBA and market analysis could have been performed in more detail with extended time frame.
The aim has also been to create a reasonable and general cost-benefit model including the most relevant benefits for integrating battery grid storage in the current energy infrastructure. The model itself is considered as general, but country-specific costs have been included for Sweden and China, respectively. Due to country-specific conditions, some data are hard to compare but must be included separately for the two countries. Two countries are included to increase quality to the model and understand how diverse market conditions can change the barriers and opportunities for grid storage integration and transmission expansion.
2.4 Cost-Benefit Analysis
The research work investigates two different markets, a developed economy and a developing economy represented by Sweden and China, respectively. Transmission expansion is considered for market specific conditions in these countries, where the focus area is to analyse the market situation from a wide infrastructure perspective. By means of the socioeconomic CBA and market analysis, potential investment decisions can be considered for infrastructure development. However, not all existing benefits for grid storage integration are included in the CBA. Grid storage can be used for several applications when utilizing different properties. The properties chosen for this thesis are applicable for regulating purposes of intermittent renewable power generation.
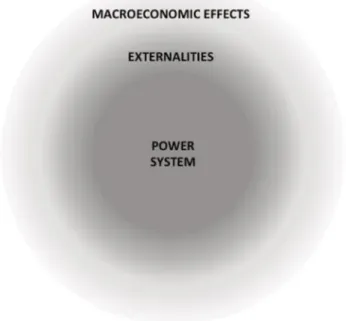
A CBA can be viewed as a method to determine whether an investment should be realized or not. It is also useful in comparing different projects to see which project that is more beneficial to realize. In a CBA, costs and benefits from a project is considered and expressed in a monetary value. (Layard & Glaister, 1994) Information about a monetary value does not often exist, but must be based on reasonable estimations. It is important to consider the most relevant factors of the project. Regarding infrastructure projects, the project has multiple factors such as impacts within the power system, external effects and macroeconomic effects as presented in Figure 8.
Figure 8: Three layers of factors generated by infrastructure project, Source: (THINK, 2013)
Within the power system, costs and benefits can be considered. Costs can involve infrastructure investment costs over the lifetime and also production cost savings, corresponding to more efficient use of ancillary and balancing reserves. Gross consumer surplus and other market benefits can also be considered within the power system, such as benefits from improved system reliability or price fluctuations on the spot market. (THINK, 2013)
Externalities refer to external effects that the project has on its environment. For instance, it can affect CO2 emission costs depending on type of energy source used for generation.
Another external effect is amount of renewable energy curtailment. Local environmental and social cost should also be considered, for example the impact that the project has on landscape or noise to the surrounding. Early deployment is also important to consider, as the project can lead to increased knowledge about certain types of technologies, such as grid storage. These potential effects are presented in Figure 9. (THINK, 2013)
Figure 9: Comprehensive list of effects, Source: (THINK, 2013)
However, some of these effects are not relevant in all projects or overlap with effects already considered. For example, benefits from CO2 emission reductions can be included in
production cost savings, due to the decreased cost for CO2 emissions. Likewise, benefits from
renewable integration can be included in production cost savings. Local and environmental costs can be included in infrastructure costs. For example, costs to meet the current directive regarding local fauna and flora, material assets and cultural heritage can therefore be included in infrastructure costs. This also applies to early deployment costs. Macroeconomic impacts are relatively similar for most projects and can therefore be considered as less important when comparing different projects. (THINK, 2013)
The most important effects on a project can be summed up to infrastructure costs, production cost savings and gross consumer surplus. These reduced effects on a project are presented in Figure 10 below. However, applicability of the CBA relies on consistency and quality of the data wind curtailment that underlines the parameters. (THINK, 2013)
Figure 10: Reduced effect mapping, Source: (THINK, 2013)
All costs and benefits during the project’s lifetime are usually included in the CBA and discounted at the same point in time. Thereafter, they are summed up to a net present value (NPV). (Layard & Glaister, 1994) The equations used in the model are showed in section 5.11.
NPV = ( )
𝑛 = Year
𝐵 = Sum of costs for year 𝑛 𝑖 = Interest rate
L =
Financial life time in years2.4.1 Annualized Cost-Benefit Analysis
To compare two investments without income and different life time the annuity for the alternatives can be calculated to make a trustworthy comparison of the costs. The Annualized Cost-Benefit Analysis (ACBA) of an investment in grid storage and transmission is obtained by multiplying the present value with the life annuity of the object.
𝐴 = 𝑁𝑃𝑉 ∗ 𝐹 = 𝑁𝑃𝑉 ∗ ( ) 𝐹 = Annuity factor
MARKET CONDITIONS
This chapter aims to give a further understanding of the conditions for variation moderators on two diverse markets. The first part of this chapter describes the Swedish electricity market, where upcoming challenges are identified and future scenarios presented. The second part describes market conditions on the Chinese electricity market, together with upcoming challenges and the influence of an emerging market.
3.1 The Swedish Electricity Market
The Swedish electricity market consists of hundreds of actors. However, the market is dominated by a few actors; Vattenfall, Fortum and E.ON, who together have a substantial market share of electricity generation and wholesale. Green & Newbery (1992) claims that it would be more efficient if the market consisted of several actors with smaller market shares in order to avoid deadweight losses. Deadweight losses means the loss a buyer suffer when buying something to a higher price than the competitive level (L in Figure 11) or the loss the buyer suffer when not choosing to buy at all (D in Figure 11) (Posner, 1975). Even though the market in Sweden could be seen as an oligopoly (Brander & Lewis, 1986) the electricity is traded on a joint Nordic market, Nord Pool Spot, which consist of several major actors and hundreds of smaller actors. According to Fridolfsson & Tangerås (2009), this results in a competitive market and no single actor has a dominating share of the market.
The Swedish national grid is controlled by a state monopoly. According to Bushnell (1999), transmission right owners can take advantage of their monopoly position and reduce transmission capacity during hours in which there would otherwise be no congestion. This will lead to social costs, see Figure 11, but not necessarily a loss for the TSO, it could even be beneficial. (Bushnell, 1999) (Posner, 1975)
Figure 11: Social costs of non-competitive pricing, Source: (Posner, 1975)
The Swedish national grid is owned by the Swedish government and managed by the Swedish TSO, Svenska Kraftnät. The Swedish TSO is responsible for ensuring that Sweden has a safe, environmentally sound and cost-effective electricity supply. In short term this is achieved by monitoring the electrical system around the clock and in the long term by plan and construct new transmission lines to meet future demand. (Svenska Kraftnät, 2015b) The Swedish national grid consist of 15 000 km high voltage lines with the current of 400 or 220 kV, presented in Figure 13, where the connections to its neighbouring countries also can be seen. (Svensk Energi, 2012d) Large wind plants over 100 MW are connected to the national grid. (Energimyndigheten, 2013b)
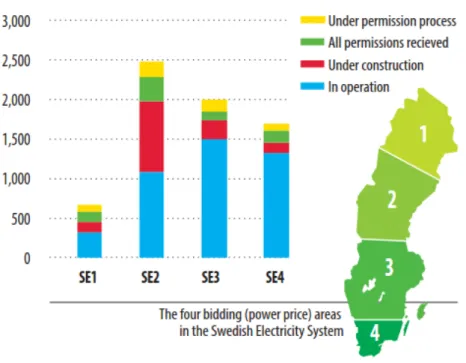
Since November 1, 2011 Sweden is divided into four different price bidding areas, as displayed in Figure 12 below. This breakdown is made to show where the grid requires an increase in capacity. The borders are placed where the limitations in capacity are. In general, there is a surplus of generation in north compared to the demand. The opposite occurs in the south where the transmission capacity is not enough during peak hours. This congestion affect market pricing; price decreases in one area and increases in the other area. The decision to split the Swedish market in four areas is also a part of EU’s goal of one united electricity market in Europe. (Svenska Kraftnät, 2013b, p. 16)
3.1.1 Electricity Generation
Sweden has an electricity generation that consist of low CO2 emitting fuels. The amount of
renewables and waste consist of 60 percent of Sweden’s total electricity generation, as seen in Figure 14. 38 percent of the generation comes from nuclear which is not renewable but still a low CO2 emitter. Only two percent comes from fossil fuels and they are mostly used as
reserve capacity in peak hours. (Svensk Energi, 2012a)
Figure 14: Sweden’s Electricity Generation 2012, Source: (U.S. Energy Information Agency, 2012a)
The nuclear power generation is the base load in Sweden’s electricity system and consist of ten nuclear power plants on three locations different location in southern half of Sweden (SE3). Hydro power generation is Sweden’s largest energy source and like nuclear it acts as a base load. Furthermore, it also acts as a regulating reserve due to its good ability to handle seasonal variation and also variation in shorter intervals. This ability to regulate the electricity generation is very valuable for Sweden’s electricity system. The share of wind energy is increasing in Sweden and with this weather dependent production there is a need for regulating reserves. (Svensk Energi, 2012a) However, hydro power as regulating reserve might not be enough in the future. Hydro energy in Sweden is already used near its maximum potential. (Svenska Kraftnät, 2008)
3.1.2 A Competitive Market
Historically the trading in Sweden was controlled by a state monopoly and consumers were forced to buy electricity for a set price. In January 1996 the first step was taken towards a competitive electricity market. The market was partly deregulated and free competition was created in trade and production of electricity. The major step towards a competitive market was made in 1999. The new rules that were applied made it possible for consumer to buy electricity from any electricity trading company on the market. This new competitive market,
connected consumers and producers, with the basic principle of demand and supply. (Svensk Energi, 2012c)
Nord Pool Spot market is today the leading power market in Europe and 90 percent of Sweden’s electricity generation is traded there. Nord Pool Spot is owned by the TSOs in Sweden, Norway, Finland and Denmark. (Svensk Energi, 2012b) Nord Pool is divided in two physical parts, Elspot and Elbas.
Elspot is a day-ahead auction market for the Nordic and Baltic region. It is the main market place and the traded power applies for delivery during the next day. The price is set by supply and demand, where a buyer sets the demand and price for the following day. A seller, for example an owner of a wind farm, sets the amount that can be delivered hour by hour and to what price. Each actor uses a strategy to maximize their outcome of the deal. (Nord Pool Spot, 2015a) (Engelbrecht-Wiggans, 1980)
Elbas is an intraday market which is traded on Nord Pool Spot. Elbas is covering the Nordic, Baltic region and Germany. Trading takes place every day until one hour before delivery. Its purpose is to set balance to the market if unexpected events occur, such as higher wind power generation than planned. The price is set by a first come, first served principle. The best prices is prioritized, highest buy price is matched to lowest sell price. (Nord Pool Spot, 2015b)
3.1.3 Upcoming Challenges
According to Global Wind Energy Council (2014) future constructions will be concentrated to northern parts of Sweden where larger wind farms are more feasible, as seen in Figure 15. These problems are most likely to occur in the most southern area (SE4) where transmission capacity from north and regulation is limited. The regulation of intermittent generation could be solved in a better way by investing in transmission capacity towards neighbouring countries as well as domestically between the different bidding areas. However, these kinds of grid investments are very costly. The process of constructing a new transmission line also requires far ahead planning. Constructing a new transmission line, from planning to commissioning, takes about five to ten years (Svenska Kraftnät, 2015). A challenge of geographical transmission is also the monitoring of wind generation and wind forecasts. The forecasts need to be constantly updated to facilitate planning of large wind power generation and balancing power with long start-up time. The actual wind generation can also be used to validate the forecast towards the outcome. (Svenska Kraftnät, 2013b)
Figure 15: Expected wind capacity 2017, Source: (Global Wind Energy Council, 2014)
The Swedish TSO has received applications for connecting wind power of 20 000 MW, which represents about 75 percent of Sweden’s maximum power demand. The expansion of wind power expects to depend on the future design of the electricity certificate system. Slow authorization processes can influence when wind power growth can be realized. Locations of the wind power plants have big impact on the capacity of the transmission grid. Nevertheless, increased transmission capacity in the national grid will be required, no matter of location of the increased wind power generation. If expansions occur in the southern parts, hydro power from the northern parts of the country is expected to balance the grid, requiring enhanced transmission capacity. If expansion occur in the northern parts, improved transmission capacity is also necessary to transmit the power to the rest of the country. (Svenska Kraftnät, 2013b)
3.1.4 Future Scenarios
The system electricity price should increase due to increased marginal costs. This is concluded by both Ramböll (2014) and Sweco (2014). The consultant company Ramböll has evaluated Sweden’s future electricity generation where two possible scenarios have been studied. The first scenario, scenario C, consists of 6 nuclear power plants instead of Sweden’s 10 plants today. It also consist of 33 TWh wind power per year and to meet peak load, 1 500 MW gas power needs to be installed. In the second scenario, scenario D, nuclear power has been completely phased out and replaced with 82 TWh wind energy per year. Furthermore, 4 700 MW gas power has been installed to meet peak load. Both scenarios involve an increase in the system price to 0.46 SEK/kWh ($0.055/kWh) and 0.53 SEK/kWh ($0.064/kWh), respectively. This can be compared to today’s level of 0.30-0.35 SEK/kWh ($0.036/kWh-$0.042/kWh) at Nord Pool Spot market. (Ramböll, 2014) Another consultant company, Sweco, also expects the electricity prices to rise. A scenario analysis for 2030 has been performed to study European Power Market Scenarios with different approaches. A scenario
with high economic growth involves higher electricity demand and greater focus on the environment. Consequently, the generation capacity increases and larger investments are necessary for interconnections on the continent. (Sweco, 2014)
High focus on climate change and increased renewable power generation is also expected to lead to volatility prices. Intermittent generation, and consequently volatile prices, is expected to increase in all European countries. As a result of this, Sweco (2014) acknowledges that increased transmission capacity is necessary. By expanding the market integration with continental Europe, the Nordic countries are expected to increase exportation of surplus power. (Sweco, 2014)
More wind power capacity in the future electricity mix can result in increased spill of energy. According to Ramböll (2014), an increased amount of wind energy in the electricity mix will result in an energy surplus, wind curtailment, of 5 percent and 26 percent of the hours of the year. Two scenarios have been studied C and D, respectively. The excess generation will yield a very low system price these hours. (Ramböll, 2014)
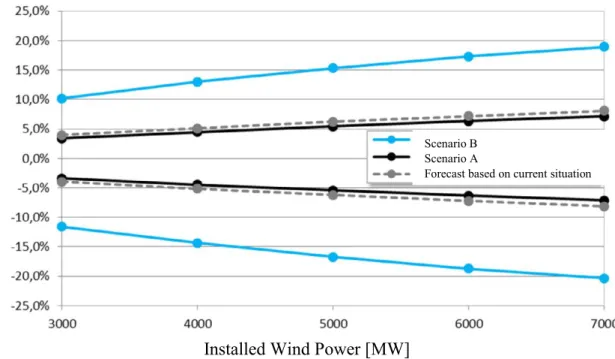
The Swedish TSO has analysed a scenario for 2025, with a wind power capacity of 7 000 MW in Sweden. They expects an increase of variation moderators to integrate the expansion of wind power. There is two scenarios shown in Figure 16. Scenario A has the assumptions of an ideal market with continuous plans and forecasts, and with corrected trade on Elbas. Scenario B is the opposite where all trade is made on Elspot and there are no updates of plans and forecasts. However, to decrease the number of variation moderators needed and to increase availability of the existing ones, a few measures have been identified. Two measures are intensified monitoring and increased costs of imbalances. (Svenska Kraftnät, 2013a)
Figure 16: Demand of variation moderators with increased amount of wind power, Source: (Svenska Kraftnät, 2013a)
The Swedish TSO assesses that expansion of wind power in Sweden will not require an adjustment of the present market model in a near future. Thereby, the Swedish TSO does not currently intend to expand their responsibility of balancing the power system, partly because European directives set guidelines for future developments of the market model. (Svenska
Installed Wind Power [MW]
In cre ase d de m and of r egulation i n pe rc ent ag e of installed w ind powe r Scenario B Scenario A
Forecast based on current situation
Kraftnät, 2013a) However, Aigner (2013) acknowledges that an integrated intraday market in Northern Europe would have major effect on production. This could result in reducing the activation of balancing reserves by about 70 percent in 2020 and $361 million in annual savings. (Aigner, 2013)
One main energy target on the Swedish energy market is to increase the share of renewable energy sources to at least 50 percent by 2020. The Swedish TSO has therefore developed a planning framework ten to fifteen years ahead, including increased wind power generation. In the framework, the Swedish TSO recognizes a few concerns about the future energy market. For instance, planning of the grid is a challenge due to uncertainties regarding future energy sources. Grid expansions are time consuming, which can hold back integration of wind power on the Swedish power market. A big share of wind energy is expected to result in increased value of variation moderators. (Svenska Kraftnät, 2013b)
3.2 The Chinese Electricity Market
In 2002 the state owned State Power Corporation (SPC) monopoly on the power market ended (Posner, 1975). SPC’s share of 46 percent of the country’s electrical generation and 90 percent of the transmission and distribution were divided into several companies. Two national grid companies were created, State Grid Corporation of China (SGCC) and China Southern Power Grid (CSG). Furthermore, five generation companies were created, each with less than 20 percent market share, along with four power service companies that provides ancillary services. The purpose with the restructuring of SPC was to create a competitive market. (Gee, et al., 2007) This coincide with Green & Newbery (1992), who claims that it would be more efficient if the market consisted of several actors with smaller market shares in order to avoid deadweight losses. However, the market structure can still be viewed as an oligopoly (Brander & Lewis, 1986).
Earlier, private investors have been lured into the Chinese power market with very beneficial agreements, due to China’s lack of sufficient power generation during the late 80’s and 90’s. After the reconstruction in 2002, these private owned generator companies started to compete for market shares under a “single buyer” system and the previous lucrative agreements were dissolved. As a consequence of the power market reform, private actors sold most of their business due to lack of returns. (Gee, et al., 2007)
State Electricity Power Regulatory Commission (SERC) was created in 2003 to work as a regulatory agency under the State Council. However, the agency does not have the same authority that similarly agencies in other countries have. SERC is in charge of overseeing market reforms, for example tariff model proposals and competitive bidding rules, and of protecting fair competition. SERC share the authority of tariff settings with the much larger and more authoritatively, National Development and Planning Commission (NDRC), who is in charge of central planning. NDRC opposed the market reform since it now has to compete with the more recently created SERC. (Gee, et al., 2007) However, China plans to restructure the National Energy Administration (NEA), which is under the jurisdiction of NRDC, and incorporate the functions of the SERC that is to be dissolved. The reason for this is the overlapping of functions and responsibilities between the NEA and the SERC. (English.news.cn, 2013)
This new oligopoly situation on the Chinese power market has moved the sector toward structural unbundling and corporatization. However, pricing is still not truly set by an open market and controlled by political and societal goals. (Gee, et al., 2007) (Brander & Lewis, 1986) (Posner, 1975) Mou (2014) also claims that the electricity market is still regulated by the government. Furthermore, to create a united electricity market is more effective than the current regional and provincial market. (Mou, 2014)
3.2.1 Electricity Generation
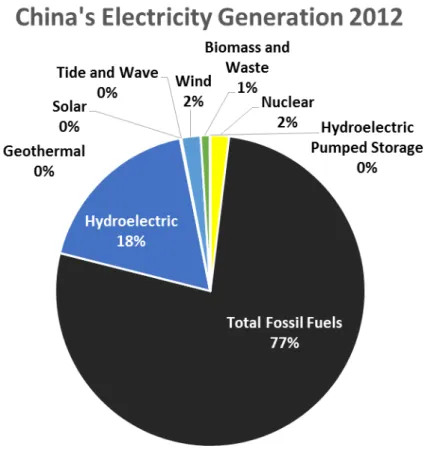
China is the largest global energy consumer and their electricity generation comes mainly from fossil fuels where coal is dominating with 77 percent, as seen in Figure 17. China’s rapidly growing economy together with being the world’s most populous country drives the urge to secure energy resources. In 2013, new leadership emerged in China and the new administration has a more long-term and sustainable focus.
Figure 17: China’s Electricity Generation 2012, Source: (U.S. Energy Information Agency, 2012a)
3.2.2 A Controlled Market
In comparison to Sweden’s current competitive electricity market, the electricity market in China is controlled by the State Council. The State Council has ultimate control over the power sector and its development and operation. NDRC, who is under the control of the State Council, reviews and approves electricity tariff settings and adjustments. Regarding new power projects, the tariff is often proposed by the provincial government, reviewed by SERC
and approved by NDRC. New power projects also needs approval from NDRC before being established. (Ma, 2011)
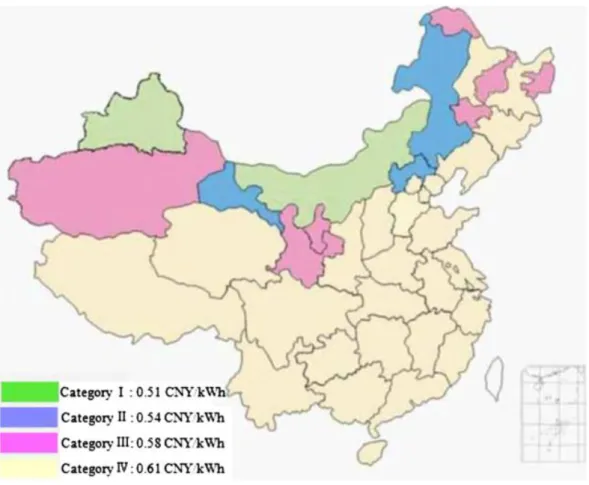
In 2009, a four category fixed feed-in tariff for new onshore wind power projects was announced by NDRC. This was implemented to benefit the wind power industry and abolish the earlier complex and time consuming tariff setting process. The new feed-in tariff has been divided into four categories to reflect the wind resources in the different areas. The regions with most beneficial wind conditions in north and west has been given a tariff of 0.51 RMB/kWh ($0.082/kWh). The regions with less beneficial wind conditions have been given tariffs of 0.54 RMB/kWh ($0.086/kWh) and 0.58 RMB/kWh ($0.093/kWh), respectively. Regions with even less wind resources have been given a tariff of 0.61 RMB/kWh ($0.098/kWh). Figure 18 shows the different tariff regions. These new feed-in tariffs are the minimal on-grid tariffs in each region. The developer of each project has the possibility to negotiate with the grid company for a better tariff. However, it is unlikely that the grid companies will offer higher tariffs than minimal tariff defined. (Ma, 2011)
Figure 18: Feed-in-tariffs for onshore wind power, Source: (Hu, et al., 2013)
3.2.3 Upcoming Challenges
China’s ambitious renewable energy goals will continue to bring challenges to the grid. The country aims to reach 200 GW of installed wind capacity and 50 GW installed solar capacity by 2020. (The Electrical Energy Storage Magazine, 2014) The rapidly growing wind power in China over the last decade, and especially after the first Renewable Energy Law was issued in 2006, had already brought substantial challenges for the county’s grid infrastructure. The majority of wind farms in China are built in northern or north-western parts of the country due
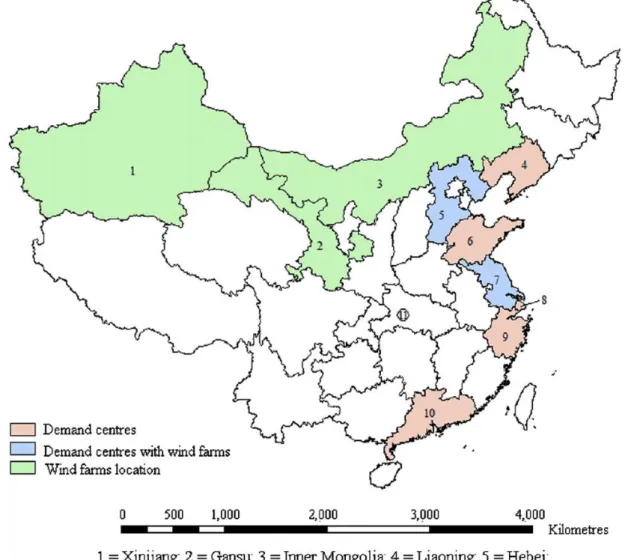
to suitable weather conditions. The demand of electricity however, is mostly situated in the eastern parts of the country. This means that electricity has to be transmitted through large distances to reach the demand centres, as seen in Figure 19. For example, the distance from Xinjiang province to Central China Grid is 2 500 km and to Eastern China Grid the distance is 4 000 km. (Li, et al., 2012)
Figure 19: Locations of wind farms and electricity demand centres, Source: (Li, et al., 2012)
The geographic disparity between power demand and the geographic distribution of installed wind power capacity put pressure on grid connectivity. Demand centres are far away from the large wind resources in the northern parts of the country, where grids are fairly weak with insufficient capacity or technology to feed in the wind power. Grid balance can be disrupted by low-quality generation, resulting in further wind capacity surplus. Given that technology remains unchanged, the allowable grid-connected wind power capacity will be limited to a relatively low level, otherwise the grid cannot work. Wind power generation exceeding allowable grid-connected capacity will therefore be curtailed, even though wind power has access priority to the grid. (Wu, et al., 2014)
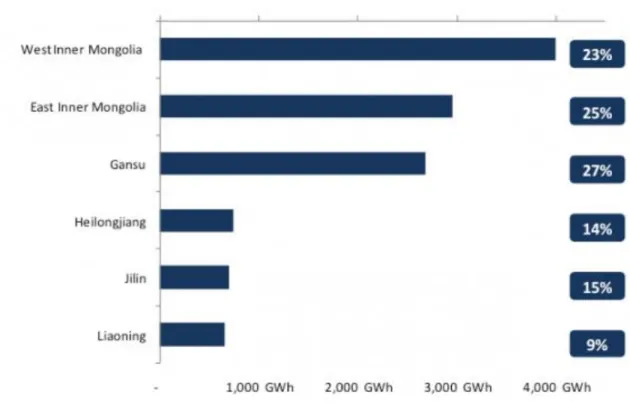
Wind power curtailment along with the lack of transmission capacity from wind power plants is a large problem in China. As seen in Figure 20, the curtailment for some provinces is