http://www.diva-portal.org
Postprint
This is the accepted version of a paper presented at ISTSS - International Symposium on Tunnel Safety and Security, New York, 14th-16th March 2012.
Citation for the original published paper: Meyer, G., Bryntse, A., Janzon, B. (2012)
Studies of explosions occuring in a metro carriage in a tunnel. In: (pp. 10-).
N.B. When citing this work, cite the original published paper.
Permanent link to this version:
STUDIES OF EXPLOSIONS OCCURRING IN A
METRO CARRIAGE IN A TUNNEL
Gero Meyera)*, Anders Bryntseb) & Bo Janzona), a)Mälardalen University, Västerås, Sweden b)Swedish Defence Research Agency, Tumba, Sweden
gero.meyer@mdh.se
ABSTRACT
The paper presents a comparison between numerical modeling and explosion tests in model scale and full scale involving underground/commuter train carriages. The full-scale test was performed in an abandoned Swedish railway tunnel in September 2011.
Relevant geometries and construction models of the metro carriage were exposed to closely controlled design explosions in the model scale experiments. The characteristics of the blast waves were
measured at different locations. The final design of the full scale experiment was chosen based on the experiences from the model scale tests.
The subjects studied were uncased explosive charges and their blast wave effects in the present complex geometry and the consequences on the structures. The results from the full scale test, the corresponding model scale tests and the numerical modelling work were compared and analyzed. KEYWORDS: explosion, tunnel, metro carriage
INTRODUCTION
These studies were performed within the METRO project, which is a large three-year inter-disciplinary research project, executed by a consortium of universities and research institutes in Sweden. The project was financed by several stakeholders in Sweden. The METRO-project is a joint research project aimed at improvement of the safety and security concepts of underground mass transport systems with regard to both structural and organizational measures. It is divided into several Work Packages. Work Package 5 (WP5) is intended to evaluate the interaction between an explosive charge and the structure and interior parts of a carriage, the interaction with the tunnel, and to supply more reliable data regarding construction sustainability in case of extraordinary strains and stresses. This paper seeks to analyze the correlations between numerical simulations, small-scale tests and the full-scale test. Some simplified models, which were as closely as possibly related to the tests, were calculated with the AutoDyn
model. The small-scale tests were carried out at a test site of the
Swedish Defence Research Agency, at Grindsjön, at a scale of 1:10 and the full-scale test was made in an abandoned railway tunnel at Brunsberg in Sweden.
METHOD
Small-scale tests and a full-scale test were carried out and compared to numerical simulations with correlative set-up. Experienced phenomena were discussed and illustrated with help of figures. Numerical modelling of the experiments was performed with the Ansys AutoDyn
finite difference code [1]. Replica (Hopkinson-Cranz) scaling was used i.e. the linear scale was 1:10 the area scale 1:100 and the mass scale 1:1000. This is designed to give equality of the shock pressures at scaled and full distance, whereas time and impulse will be linearly scaled [2]. The colour of the graphs included
in the comparison figures is matching the colour of its name and its colour of the corresponding scale.
LIMITATIONS
This paper gives interpretations of the calculated and measured values for the simulations and tests presented. It does not necessarily mean that it is valid in all cases. The results of peak pressure measurements need to be discussed for each test individually. The precise amount of the explosive device used in the full-scale test and the comparable simulations NS 100-109 will not be mentioned.
TESTS MADE
The tests were designed to study the effect of an explosion in a metro carriage located inside a tunnel. These tests were designed to enable correlations to be made between them, in order to create valuable data for contingency planning and tactics of first responders.
Numerical Simulations (NS)
The numerical simulations were made with the numerical continuum dynamics code Ansys-AUTODYN
. The carriage and the tunnel were filled with air at normal temperature and pressure, modelled as an ideal gas with Cp/Cv = 1.4, density 1.3 kg/m³ and internal energy 0.1925 MJ/kg. The
shock wave was calculated on ambient air with a pressure of 100 kPa (ab. 1000 millibar) which is relevant at sea level for an air temperature of 0 °C. The explosive charge was modelled as a sphere of TNT, with data taken from AUTODYN´s material library. After a short run in 2D it was mapped into the 3D model as a gaseous sphere with 1 m radius, 0.3–0.5 milliseconds after the detonation was initiated. The calculation continued in 3D with an Euler-FCT processor. The mesh in the geometry model contained 2–3 million cubical elements. The tunnel ended after 30 m with a flow boundary that emulated an infinite continuation of the tunnel [3]. These characteristics were similar in all
simulations. The numerical simulations can be divided into three set-up groups recognizable by the different range of calculation numbers used.
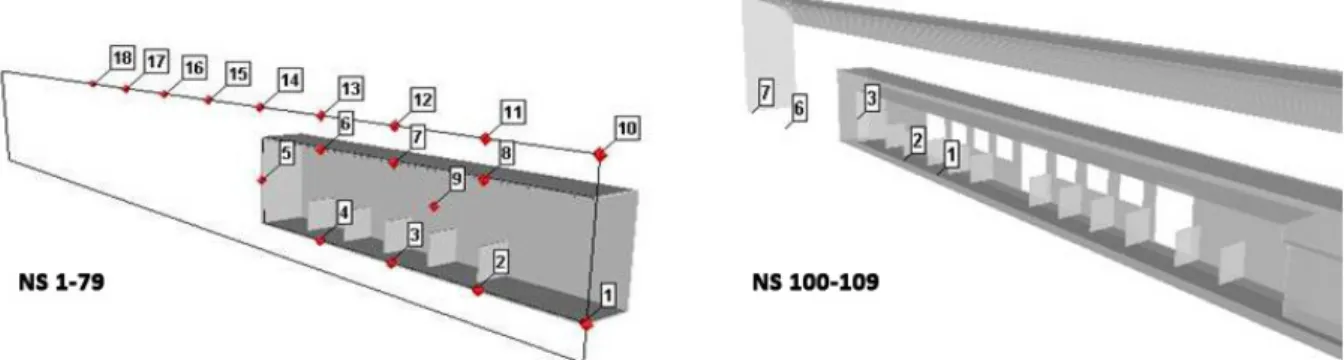
NS´s 1-79 were prepared for the comparison with the small-scale tests. In these simulations the metro carriage were modelled as a hollow box with a length of 24 m and a cross-section of 3x3 m located 1 m above the ground plane of the tunnel. The distance between the “gauge” (pressure registration) locations were c/c = 3 m originating from the detonation point in the centre of the carriage. A similar set-up was used in the small-scale tests, only with fewer gauge positions. Inside the carriage the total number of 20 seats were modelled as 1x1 m rigid plates and located with c/c = 1.7 m. The model used symmetry in two vertical planes, one in the tunnel length axis and the other one orthogonal to the length axis of the tunnel [3].
Figure 1 shows the design of the modelled carriages that included the explosive device. The left picture is a quarter of the simulated carriage for the small-scale tests NS 1-79 and the right side shows half of the simulation carriage for the full-scale tests NS 100-109.
A total of 76 numerical simulations were made with different combinations of charges, venting areas, tunnel areas and the presence of an adjacent dummy carriage. The charge weight was chosen as 1, 5 or 10 kg TNT. The ventilated area in the carriage wall and ceiling was chosen as 2, 6, 18 or 45 m2
which is not shown in Figure 1. The tunnel cross-section was chosen as either 5x5 or 7x7 m and a variation with an adjacent carriage present or not present was made as well. The calculations NS 70-79 were set-up with an initial opening of 2 m² that was widened to 18 m² after 20 ms. This was done in order to simulate the breaking up of walls and ceiling of the carriage [3].
The calculations with the numbers NS 100-109 were related to the set-up of the full-scale test (FS). They considered a more detailed shape of the train and tunnel. The changes included a horseshoe shaped tunnel with 38 m² cross-section area, a decreased clear height inside the carriage to 2.3 m, inserted openings for windows and doors and an eccentric arrangement of tracks and carriage inside the tunnel. The gauges were arranged similarly as in the full-scale test [3].
Small-Scale Explosion Tests of an Underground Carriage (SS)
The small-scale tests were performed in collaboration between the Swedish Defence Research Agency - FOI and the Mälardalen University. These tests were designed to approximately model the full-scale commuter train explosion test in Brunsberg at a scale of 1:10.
A box made of a steel frame construction and 2 mm thick steel plates was fabricated with the
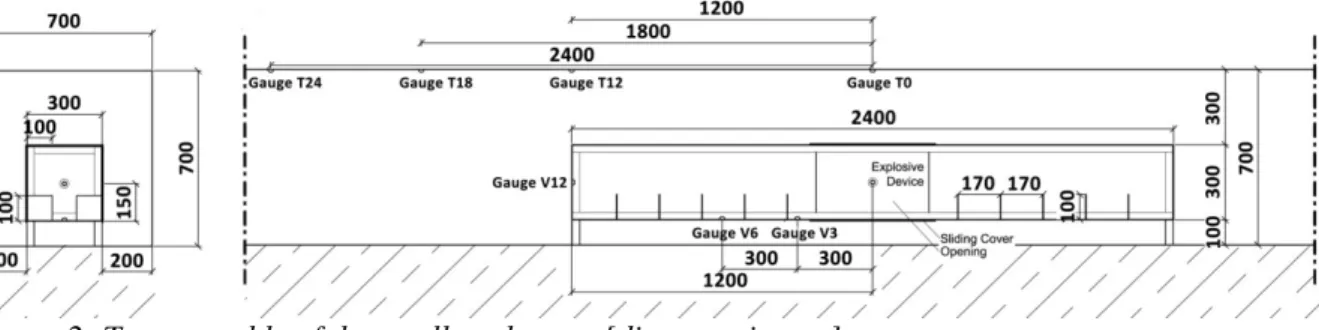
dimensions 240x30x30 cm and was placed 10 cm above the ground at the centre of a 10 m long tunnel with a cross-section of 70x70 cm. The sides and the roof of the carriage model left an opening of 45 cm at the middle of the carriage which was covered by movable steel sheets in order to be able to use different venting areas at different tests. The seats of the train were modelled by 20 steel plates of 10x10 cm, welded to the model carriage's structure [4].
Three gauges (V3, V6 and V12) were installed at the centreline of the carriage model, V3 and V6 at floor level to measure the side-on pressure and V12 in centre of the end wall to measure the reflected pressure. Four further gauges (T0, T12, T18 and T24) were installed outside the carriage model at the centreline of the tunnel roof. T0 measured the reflected pressure and T12, T18 and T24 measured the side-on pressure further down the tunnel [4].
Figure 2 describes the placement of the gauges in detail. The tests were also documented with a high-speed camera that was placed 15 m from the explosion and recorded at a rate of 300 frames per second. The explosive device was mounted at the centre point of the carriage. The tunnel was made of concrete blocks, used as walls, covered with 25-30 mm thick steel plates above as tunnel roof [4]. The tests varied the size of the venting area (180 and 1800 cm²), with or without an adjacent carriage, and the explosive devices used had a mass of 1, 5 or 10 g. The 1 g charge consisted of only the Nonel blasting cap with RDX as explosive. The 5 and 10 g charges were made of Swedish Plastic Explosive (85% PETN + 15% mineral oil) ignited with a Nonel blasting cap [4].
Figure 2: Test assembly of the small-scale tests [distances in mm]
In tests 12 to 16 the venting area was covered with 1 mm aluminum plates (weight ab. 28 g/dm²) in order to simulate the breaking up of the carriage walls and to keep the initial pressure wave confined inside the carriage [4].
Full-Scale Commuter Train Explosion Test at Brunsberg (FS)
The FS was carried out in an abandoned rail way tunnel at Brunsberg close to Arvika (Sweden). Two 24 m long carriages were placed close to the middle of the 272 m long tunnel. The cross-section of the tunnel was shaped like a horseshoe and the walls consisted of rough rock formations covered with a concrete layer (grouting). The profile depth along the tunnel walls and the ceiling varied between 20 – 30 cm. The height of the cross-section at the location of the experiment was constantly at 6.6 m and the width varied between 6.2 m at the east end of the train to 5.6 m at its west end. The rail track was located eccentrically by 30 cm. The explosive device was made of a common explosive; it was of a size easily carried by hand and was placed in a soft bag on top of the seat that was located next to the middle doors inside carriage A (see Figure 3). Pressure gauges were installed inside and outside both carriages to collect the pressure wave data, and a high speed camera was placed at the easterly tunnel adit to catch pictures of the explosion. At the time of explosion all doors and windows were closed [5].
Figure 3:Test assembly of the full-scale test [distances in m] [5]
Four gauges were placed inside the carriages, three of them in carriage A (A1, A2 and A3) and one in carriage B (B4). Three further gauges were installed outside the carriages on the sleepers of the track (Out 5, Out 6 and Out 7). The distances to the charge were chosen as following: [5]
A 1 3 m east of detonation Side-on pressure at floor level of carriage A 2 5.5 m east of detonation Side-on pressure at floor level of carriage
A 3 9.5 m east of detonation Reflected pressure at 0.85 m height above floor level B 4 24 m west of detonation Side-on pressure at floor level of carriage
Out 5 24 m west of detonation Side-on pressure at ground level of tunnel Out 6 18 m east of detonation Side-on pressure at ground level of tunnel Out 7 24 m east of detonation Side-on pressure at ground level of tunnel
COMPARISON OF RESULTS
Comparison between the numerical simulations
The numerical simulations were compared with each other in order to observe general phenomena of the pressure propagation caused by an explosion in an underground carriage. As described variations were made with the size of the charge, the size of the venting area, the tunnel cross-section and the presence of an adjacent carriage.
It was observed that strong reflections from the interior walls increased the impulse density in several steps with clearly visible plateaus. Outside the carriage the impulse density increased in only two significant steps with the level depending strongly on the size of the venting area. The first step is the initial part of the pressure wave escaping through the venting area, the second step is depending on the remaining part of the pressure wave inside the carriage that was reflected at the end of the carriage and then escapes into the tunnel while it passes the venting area the second time. A small venting area led to a high impulse density inside the carriage and a relatively low impulse density outside. A large venting area led to a weak reflection of the interior walls, and the impulse density inside the carriage reached the maximum without noticeable plateaus and stayed relatively small, but it also led to significantly increased impulse densities outside.
when the explosion occurs and the breaking up of the carriage walls will take some time. This
sequence of events will mean that a more realistic pressure propagation situation will be created, with a small initial venting area that opens up to a large venting area before the pressure pulse returns from the carriage ends. It is a combination of the worst parts of both scenarios mentioned above and will be considered in the comparison with the small-scale and the full-scale tests.
The size of the tunnel cross-section influences the peak pressure and the impulse density significantly. A large cross-section decreases the pressure levels; a small cross-section increases the pressure. The pressure values change significantly due to the presence of a dummy carriage in small tunnel cross-sections, but not in large ones.
Comparison of numerical simulations (NS) with small-scale tests (SS)
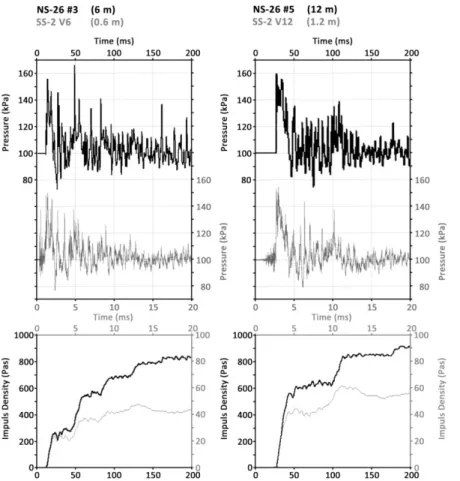
The different scales between the numerical simulations and the small-scale tests will mean different sizes of charge and venting area. The first comparison was made between NS-26 with 1kg TNT and 2 m² venting area and SS-2 which used 1g of RDX and 1.8 dm² venting area. The difference in the size of the venting areas was negligible. Figure 4 shows the results of the numerical simulation NS-26 in black and the small-scale test SS-2 in grey. The first column presents the side-on pressure
measurements at a distance of 6 m (0.6 m) from the explosive device. The second column presents the reflected pressure measurements at 12 m (1.2 m) distance from the point of detonation.
Figure 4: Comparison of NS-26 with 1kg TNT and 2 m² venting area and SS-2 including 1g of Plastic Explosive and 1.8 dm² venting area
The pressure-time graphs at both gauge positions are showing good agreement at first sight. Especially for the computations it can be seen that the impulse density increases in steps with clearly visible plateaus. The steps will be caused by the reflected shock wave passing the gauge again while the plateaus indicate the time needed for the shock wave to return. The impulse density graphs in the first column are showing good agreement within the first 50 ms (5 ms) but
are drifting apart as time progresses. As the shock wave passes the measurement point at 6 m distance from the point of detonation (#3 and V6) the first time, the propagation was not disturbed by any obstacles. After 200 ms (20 ms) the values of the SS-2 graph are 40% less than the NS-26 graph values. Comparing the impulse-time graphs of the second column where the gauge was located at the end of the carriage at 12 m (1.2 m) distance from the charge, they show reasonable agreement in shape but a difference in level right from the beginning. Since the gauge was located at the end of the carriage, the pressure wave had to pass several simulated seats before it came to the measurement point. Obstacles obviously interfere with the shock wave differently in the small-scale test and the numerical simulation. A likely explanation will be that there will be shock-front relaxation and energy losses from friction and turbulence that occur around the simulated seats, which are not accurately modelled in the numerical simulation.
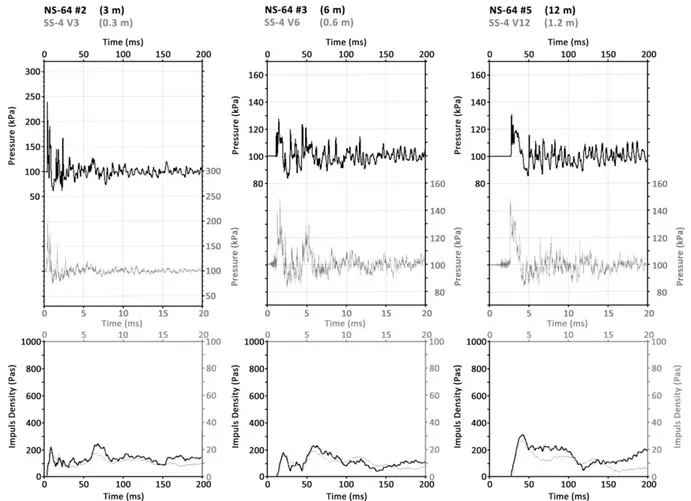
Figure 5: Comparison of NS-64 (1kg TNT, 18 m² venting area and a tunnel cross-section of 7x7 m) and SS-4 (1g of RDX, 18 dm² venting area and no tunnel)
Figure 5 shows a comparison of the numerical simulation NS-64 and the small-scale test SS-4. Only the three gauge positions inside the carriage were taken in consideration since the tunnel was not present in SS-4. The difference to Figure 4 is the enlarged venting area which had an immediate influence on the pressure propagation. The first peak pressure of NS-26 #3 (6 m) in Figure 4 shows a value of 155 kPa with a 2 m² venting area and a value of 128 kPa with an 18 m² venting area in NS-64 #3 (6 m) in Figure 5. That means that the peak overpressure value of NS-26 #3 (6 m) is 55 kPa and the peak overpressure value for NS-64 #3 (6 m), is due to the enlarged opening, reduced by 50% to 28 kPa. The difference in the pressure wave propagation also appears significantly in the different shapes and maximum values of the impulse density graphs of Figure 4 in comparison to Figure 5. The comparisons of NS-64 and SS-4 (Figure 5) shows good agreement.
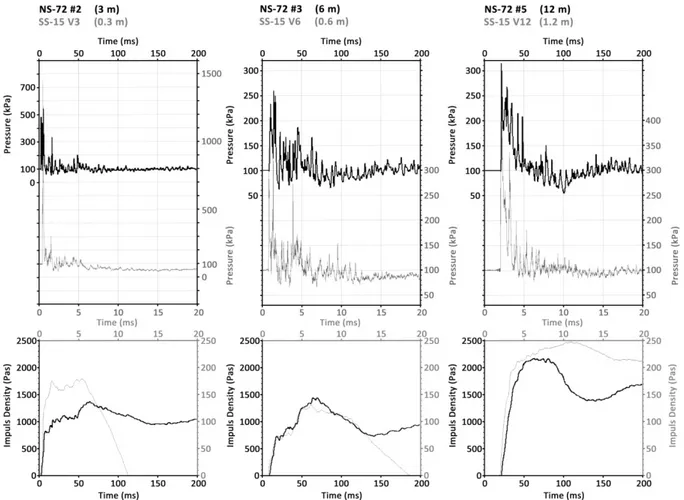
Figure 6: Comparison of NS-72 (5kg TNT, initially 2 m² venting area opened after 20 ms to 18 m² and a tunnel cross-section of 7x7 m) and SS-15 (5g of Plastic Explosive, 18 dm² venting area initially closed with loose aluminum plates and a tunnel cross-section of 0.7x0.7 m) The differences between the simulations and the tests that created the results in Figure 5 and Figure 6 were mainly the size of the charge, which was enlarged from 1 to 5 kg (g), and the attempt to simulate the breaking up in the NS-72 by opening up the venting area from 2 to 18 m² after 20 ms and in the SS-15 by covering the 18 dm² venting area with loosely hanging aluminium plates. The Swedish Plastic Explosive used in the experiment consisted of 85% PETN and 15% mineral oil. PETN has a TNT-equivalent of 1.27 [2], so the energy releases compares well to the same amount of TNT. Since the breaking up of the walls takes some time it was expected that the first pressure peaks inside the carriage would be very distinctive. After detonation a great part of the shock wave remains inside and as it returns after reflection at the carriage ends, it dissipates into the tunnel through the enlarged opening. The comparisons of the pressure graphs NS-72 and SS-15 (Figure 6) show good agreement, besides significant differences in the first pressure peaks where the experimental impulse density rises dramatically over the calculated values. That might be explained by the different situation of the initial venting area. The NS-72 started with a 2 m² opening whereas the venting area of SS-15 was closed up with an aluminium plate which
increased the pressure inside the carriage and caused two prominent peaks, the first on the way to the end of the carriage and the second on the way back after reflection. Those peaks are clearly visible in SS-15 V6 (0.6 m) after 1 and 4 ms.
Figure 7 illustrates the calculated values of NS-72 in form of the main shock waves 1(left) and 2 (right) which are passing the gauge positions #2, #3 and #5. Gauges #2 and #3 are giving side-on pressure values and gauge #5 a reflected pressure value which is expected to be more than double
as high as a side-on pressure value at the same point. That explains the rising of the calculated pressure value from 260 kPa after 10 ms in gauge #3 to 310 kPa after 20 ms in gauge #5. The increase at gauge #2 shows slight increase of the pressure after 50 ms (visible also in SS-15 V3) which may be explained by reflections of the shock waves from roof, walls and other obstacles, causing an overlayering of pressure waves. It seems to be impossible to trace the shock wave 1 or 2 over longer distances since it constantly interferes with obstacles, openings and other shock waves.
Figure 7: Illustration of shock wave travel
Comparison of the numerical simulation (NS) and full-scale test (FS)
Figure 8 and Figure 9 are presenting a comparison of calculated results from the NS-102 in black and measured results of the FS in grey. The peak pressure measurements of the FS leave some space for interpretation. Figure 8 includes the gauge positions inside the carriage.
Figure 8: Comparison of the gauges inside the carriage of NS-102 (Z kg TNT, initially 26 m² venting area and a tunnel cross-section of 38 m²) and FS (Z kg of Plastic Explosive, initially closed carriage and a tunnel cross-section of 38 m² with rough wall surfaces)
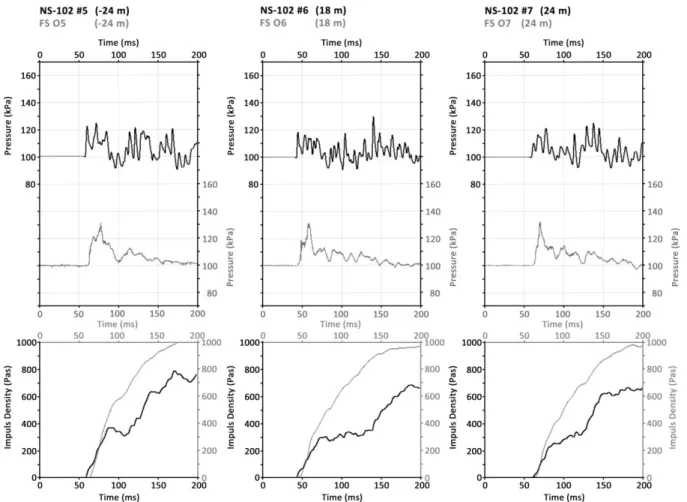
The pressure-time graph of FS A1 (3 m) displays two unexpected high peaks, one after 25 ms and one after 100 ms. An explanation for these peaks could be fragments or other particles hitting the gauge, since they were not protected. Gauge A3 was mounted in the wall that was dividing the driver’s cabin from the passenger compartments. The gauge lost its position since the wall was not resistant to the explosion. The peak pressure after 115 ms in the pressure-time graph FS A3 (9.5 m) is likely to be the gauge hitting an obstacle after losing the original position. Figure 9 includes the gauge positions outside the carriage. The pressure-time graphs of NS-102 show different initial amplitudes than the graphs of the FS. This could be reasoned in an error at the modelling since the shock wave had to travel a long distance in a tunnel with a complicated geometry.
Figure 9: Comparison of the gauges outside the carriage of NS-102 and FS
FURTHER DISCUSSION
In all numerical simulations presented, TNT was chosen as explosive material. Within the correlations comparable scaled charge sizes were used.
Numerical simulations have limits in generating the conditions of the real surroundings. The simulations use a mesh of little boxes through the lateral faces of which the peak pressure is
transmitted. Due to the steep peak pressure of an explosion and the limited resolution of the mesh, the value will get rounded and end up lower than in reality. This failure gets qualified with the distance to the detonation point due to the increasing duration of the pressure. A further limitation of the
simulations is to model the realistic behaviour of materials that interfere with the propagation of the pressure wave. The simulated walls of the carriage were included as stiff borders which do not give way due to the pressure wave. During the small-scale tests it was observed that the explosions were bulging the carriage walls slightly. In SS-15 and SS-16 the walls, the ceiling and the floor of the carriage were bulging outwards for about 1.5 cm. That change in the shape of the model might have
affected the results in the later tests. The numerical simulation (NS 102) uses a simplified shape of the full-scale test carriage and does not consider the rough tunnel walls. Furthermore the correct shape of the seats or their materials were neglected. The seats were simulated as stiff bulkheads that will cause significant turbulence as the initial shock wave passes by. This turbulence would make it more difficult for the gases behind the shock front to propagate through the carriage and decrease the values of the simulations.
CONCLUSION
• It is not possible to take pressure measurements from explosions as truth. There is always a need for interpretation. Several possible explanations for the observed differences between the values are given.
• The NS and SS correlate quite well since both set-ups are fairly equal, whereas for the values of the NS and the FS there appear differences which might be explained in the complexity of the set-up and the simplification of the NS. And turbulence is not well simulated by AutoDyn. • Numerical simulations are a great help for understanding the pressure wave propagation and
give a lot of information about the real scenario. But to reach reliable results it is crucial to enter a set-up as realistic as possible.
• Often computations can be used to investigate the limits of possible outcomes of the real situation by choosing different simplified set-ups of the problem. For instance the mesh size which is a compromise between the use of computing time and propagating errors, may not be possible to choose optimally.
ACKNOWLEDGEMENT
I would like to express my gratitude to all participants within the METRO project who helped to accomplish the explosion tests. As there were Stockholm Greater Fire Brigade and Rescue Service Höga Kusten-Ådalen, which helped with their service during the full-scale test; Greater Stockholm Local Traffic Co. (SL), that provided the train; Technical Research Institute Sweden (SP), that helped a lot at the set-up of the full-scale test and Swedish Defence Research Agency (FOI), which was responsible for the small-scale and the full-scale explosion tests. Many thanks go also to the sponsors that made these tests possible.
REFERENCES
1. Anon, “ANSYS® AUTODYN® Explicit Software for Nonlinear Dynamics”. ANSYS Inc., 2007.
2. Baker, W.E., Cox, P.A., Westine, P.S., Kulesz, J.J. & Strehlow, R.A., Explosion Hazards and Evaluation vol. 5, Elsevier Scientific Publishing Company Inc., 1983.
3. Bryntse, A. & Meyer, G., “METRO - Calculated pressure from explosion in train coach”, FOI - Swedish Defence Research Agency, FOI-Memo nr 3790, Tumba, Sweden, 2011.
4. Carlberg, T. & Berglund, R., “Metro - Scale Model Test”, FOI - Swedish Defence Research Agency, FOI-Memo nr 3792, Tumba, Sweden, 2011.
5. Meyer, G. & Berglund, R, “Full-Scale Commuter Train Explosion Test”, MU – Mälardalen University, REPORT in progress, Västerås, Sweden, 2011.
![Figure 3:Test assembly of the full-scale test [distances in m] [5]](https://thumb-eu.123doks.com/thumbv2/5dokorg/4827136.130142/5.892.104.789.110.539/figure-test-assembly-scale-test-distances-m.webp)