Examensarbete
15 högskolepoäng, grundnivåExploring how users perceive and
interact with continuous glucose
monitoring software
Louise Flou
Teknik och samhälle Datavetenskap och Medieteknik
Examen: Kandidatexamen 180 hp Handledare: Fredrik Rutz
Huvudområde: Datavetenskap Examinator: Nancy Russo
Program: Informationsarkitekt
2
Abstract
The present study is based on the hypotheses that a better user experience in mobile applications increases the frequency of use among users, and that a higher frequency of use of continuous glucose monitoring systems leads to better health status in patients with diabetes.
The purpose of this study is to understand how users perceive and interact with CGM software. The result of this study shows that existing CGM applications and the functionalities they provide are very much appreciated by the participants. Many of the user needs may however not have been met in one application alone, since a large proportion of the participants use more than one CGM application.
This study highlights importance of providing options for customization in every aspect of functionality due to the individuality of each user’s condition, and that the settings of such should consider minimizing the cognitive load for the user.
3
Abbreviations
T1D Type 1 Diabetes
T2D Type 2 Diabetes
HbA1c Glycated Haemoglobin (type A1c) IAH Impaired Awareness of Hypoglycaemia CGM Continuous Glucose Monitoring BGM Blood Glucose Monitoring SMBG Self-monitoring of Blood Glucose ISF Interstitial Fluid
Glossary
HbA1C Long term measurement of blood glucose control.
Hypoglycaemia A state of which the blood glucose levels are below the target range. Hyperglycaemia A state of which the blood glucose levels are above the target range. Interstitial Fluid The fluid that surrounds the cells, where CGM sensors measure glucose. Cognitive Load The amount of mental resources that is required to operate a system.
4
Table of contents
1. Introduction ... 6
1.1 Types of diabetes ... 6
1.2 Self-monitoring ... 7
1.2.1 Blood Glucose Monitoring ... 7
1.2.2 Continuous Glucose Monitoring ... 8
1.3 Open Source Communities ... 9
1.4 Background and previous research ... 10
1.4.1 Glycaemic control ... 10
1.4.2 Impaired Awareness of Hypoglycaemia ... 11
1.4.3 Changing living habits ... 11
1.5 Research Questions and Purpose ... 12
2. Method ... 13
2.1 Task specific usability inspection ... 13
2.1.1 Materials used ... 14 2.1.2 Tasks ... 14 2.1.3 Metrics ... 15 2.1.4 Participants ... 15 2.1.5 Execution ... 15 2.2 Survey ... 16
2.2.1 Structure of the Questionnaire ... 16
2.2.2 Participants of the Survey ... 17
3. Result of task specific usability inspection ... 18
3.1 Monitor observations ... 18
3.2 Success Rate ... 19
3.1.2 Task Completion Time ... 20
3.1.3 Action Count ... 22 4. Result of survey ... 24 4.2 Application use ... 25 4.3 Functionality use ... 26 4.3 Frequency of use ... 27 4.4 User Experience ... 28 4.5 Qualitative Results ... 29 5. Analysis ... 30 6. Discussion ... 33 6.1 Limitations ... 33 6.2 Future work ... 33 7. Conclusion ... 34 10. Table of figures ... 35
5
11. Table of tables ... 35
References ... 36
Appendix A: Logging data ... 39
Appendix B: Graphs ... 40
Appendix C: Navigation ... 42
Appendix D: Notifications and alarms ... 44
Appendix E: Sharing ... 47
Appendix F: Statistics ... 48
Appendix G: Visualizations of responses from parents/guardians to a diabetic……….….…51
Appendix H: Visualizations of responses from diabetics………...52
Appendix I: Visualizations of responses from Dexcom users……….53
Appendix J: Visualizations of responses from xDrip users………54
Appendix K: Visualizations of responses from Spike users………...55
6
1. Introduction
Diabetes is a condition in which the body’s ability to produce or respond to the hormone insulin is impaired. Insulin is essential in the process of transforming glucose to energy. With too little or no insulin the glucose cannot properly enter the body cells which makes it trapped in the blood stream [1]. This results in blood glucose levels elevated to a state called hyperglycaemia. Long term hyperglycaemia can lead to various severe sequelae such as cardiovascular disease, stroke, kidney failure, limb amputation and blindness. While high glucose levels (hyperglycaemia) have long-term health implications, low glucose levels (hypoglycaemia) can in severe cases of the condition have more urgent consequences such as seizures, loss of consciousness, coma, and death unless treated in time [2].
A person with diabetes needs to manage their blood glucose levels on their own in order to stay healthy. That includes monitoring the blood glucose levels regularly throughout the day and dosing and injecting insulin accordingly. Before and after eating, drinking, exercising and sleeping it is of great importance for a diabetic to know the status of their blood. If the glucose levels are out of range - the correct action must be taken in order to normalize it.
Today innovative sensor technology known as Continuous Glucose Monitoring (CGM) systems allows diabetics to monitor their blood glucose levels in real-time in applications on their smartphones. This significantly reduces the amount of blood tests they previously had to make throughout the day. Studies have shown how frequent use of CGM compared to regular Blood Glucose Monitoring (BGM) leads to better glycaemic control in patients [3].
CGM Software is today complementing self-monitoring of blood glucose with functions that lets the users view their health data in a wide variety of formats e.g. daily profiles, average days and statistical information [4].
There is a research gap on how users perceive and to what extent they use the various functions provided in CGM applications. This study aims to get insight in how different users perceive and interact with CGM software. The results could be useful to organizations that are developing CGM applications or other health-related applications.
1.1 Types of diabetes
Diabetes comes in various varieties that differ in severity. The three main types of diabetes are described as follows:
Type 1 diabetes (T1D) is the most severe type, which is a chronic disease with neither known cause nor cure. Though it sometimes is called “child diabetes”, it does not imply that the condition disappears when growing up, but it usually starts early in life. T1D is an autoimmune illness where
7
the immune system attacks the beta cells in the pancreas and continues to do so until there are none left. Eventually the body’s ability to produce insulin completely ceases which leaves people with T1D dependent on daily insulin therapy for the rest of their life [5].
Type 2 diabetes (T2D) is a condition where either the body becomes resistant to insulin, or the pancreas can’t produce enough insulin. The cause of T2D is not fully established but has strong relations to overweight. And though T2D is sometimes referred to as “adult-onset diabetes”, there is an increase in the number of children being diagnosed today – presumably in conjunction with the increase of childhood obesity in some parts of the world. T2D can in some cases be managed with dietary changes and regular physical activity but in other cases diabetes medications or insulin therapy might be needed [6].
Gestational diabetes mellitus (GDM) is a condition which occurs to some women during pregnancy. High blood glucose values during pregnancy results in the baby growing abnormally big which in turn can lead to negative complications during labour. GDM is a condition that usually goes away after childbirth but leaves both the mother and the child at risk of developing T2D later in life [7].
1.2 Self-monitoring
People on insulin therapy need to monitor their blood glucose levels regularly to be able to adjust their treatment correctly. The process is referred to as self-monitoring of blood glucose (SMBG) [5]. Long term optimisation of blood glucose control using SMBG depends on the diabetic’s ability to interpret and respond to blood glucose data accordingly [4].
1.2.1 Blood Glucose Monitoring
The most accurate SMBG method is by using a Blood Glucose Monitoring (BGM) device. A blood glucose test is done by first inserting a small test strip into the BGM device, pricking the finger with a small needle and place a drop of blood on the test strip connected to the device. The BGM device will then calculate the approximate glucose level in the blood sample inside the test strip. After a couple of seconds, it displays the value on the screen.
This method is accurate, yet in order to be in control one has to repeat this several times throughout the day, since the test only shows the value from that exact moment in time; it cannot inform the user about the trend in blood glucose levels [4]. That means that the blood glucose value can be completely different after 15 or 30 minutes. SMBG can be a very cumbersome habit to incorporate in one’s daily life [8].
A more innovative way to test the glucose levels is through another sample medium for glucose testing, the interstitial fluid (ISF), which is the fluid that surrounds the cells and feeds them nutrients including glucose. By inserting a glucose sensing filament into the tissue just below
8
the skin, an approximate blood glucose level can be estimated. The glucose levels in the ISF closely follow the blood glucose but have a slight time delay that may increase after physical activity and insulin or food intake [9] [10].
Figure 1 -Freestyle Libre sensor measuring glucose in the interstitial fluid [9].
1.2.2 Continuous Glucose Monitoring
Continuous Glucose Monitoring (CGM) systems consist of an ISF glucose sensor placed on top of the skin, and the sensor sends the ISF glucose values every 5 minutes to a receiver. The receiver translates the sensor values through complex algorithms which make the value better resemble the actual blood glucose levels. The data is presented in a graph on the receiver that displays a real-time overview over the glucose levels throughout the day, including an estimation of in what direction the blood glucose values are currently going.
Nowadays a smartphone can work as the receiver in CGM systems. There is an increasing development of both first- and third-party applications that handles CGM data in various ways and thereby meet different user needs. Many CGM applications lets the user log data of when food intake, insulin intake and physical activity occurred, as a way of mapping out the causes of high and low blood sugar. This multivariate data adds to the real time blood glucose graph which in a way visualizes the status of their condition. It can give the user valuable insight in how their body works and how different habits could work for them.
Next to the blood glucose value, CGM applications often provides trend arrows that show the direction of which the blood glucose is currently changing, and at what rate. This gives the users a better idea of the status of their blood at a glance on the smartphone. Below is a list of Abbott’s Freestyle Libre system and how their trend arrows are defined [11].
↑ blood glucose rising quickly (more than 0.1 mmol/L per minute) ↗ blood glucose rising (between 0.06 and 0.1 mmol/L per minute) → blood glucose changing slowly (less than 0.06 mmol/L per minute) ↘ blood glucose falling (between 0.06 and 0.1 mmol/L per minute) ↓ blood glucose falling quickly (more than 0.1 mmol/L per minute)
9
CGM applications can also be set to fire alarms, not only when their blood glucose is out of the target range, but also when the blood glucose is changing rapidly and is estimated to go out of range in the near future. This is a very important feature that helps users to prevent hypo- and hyperglycaemia.
It is recommended to calibrate the CGM system with control BGM tests at least twice a day in order to make sure the translation of the ISF values to the blood glucose estimation is accurate. The calibration test should not be done during rapid changes in the amount of blood glucose since it most likely would cause sensor error [10]. CGM technology has made it possible for diabetics to track their glucose levels throughout day and night and reduce their finger pricking from 4-10 times to only twice a day.
1.3 Open Source Communities
At the DiabetesMine D-Data Exchange event that took place at Stanford University in November 2013 a hashtag followed with the statement “we are not waiting” was coined out of the frustration of having to wait a long time for solutions that meet the many needs of diabetics. It is now a growing global movement of people exploring different methods of utilizing technology to improve their diabetes control [12].
As part of this movement, Nightscout or sometimes referred to as “CGM in the Cloud” is a free open source project that was started by two parents whose son got diagnosed with T1D. They experienced the complexity of managing their son’s diabetes. They got hold of a CGM system pretty early on after the diagnosis. They were constantly worried about their son’s health when they were not together, which led them to identifying crucial bits of missing functionality that were not yet available in the system. They developed a system that could automatically upload the data from their son’s CGM device to a server for them to access online, which made it possible for them to remotely monitor their son’s blood glucose level over the internet. After getting it all to work, they shared the code to the solution with the community along with instructions on how to set it up [13]. Today Nightscout works both with Android and IOS smartphones and multiple CGM systems. There is no limit to the number of data receivers, which means that all people involved, such as family members, friends and colleagues, can get access to the diabetic’s blood glucose values online [14].
xDrip is an unofficial Android application developed by Stephen Black who is a type 1 diabetic that regularly contributes to the Nightscout community. It works as a data hub and processor between many different devices and supports connections to various sensors, glucose meters, insulin pens as well as smartwatches [15].
“I was diagnosed with Type 1 four months ago. At that time, I knew nothing about diabetes. I was in disbelief when I discovered that if I wanted to see my glucose levels in real time, I would
10
need to carry around an extra, bulky device in my pocket. If I wanted to see that data anywhere else, I would need to plug it into a computer and upload it. If a loved one wanted to check in to see if I was doing alright, they would need to call me and hope I answered. This seemed anachronistic in the wireless age.”
- Stephen Black (January 2015) Stephen found the Nightscout movement when he started to work on a way to wirelessly send his real-time blood glucose readings straight to his phone through Bluetooth. Today xDrip is a widely used application by diabetics all over the world. Many features have been added and improved over the years. The application now works with multiple CGM systems and contains more useful features such as calculative algorithms that can predict future blood sugar values.
1.4 Background and previous research
There is not one recipe on how to manage diabetes that works for everyone. It is a very individual condition that is affected by type of diabetes, medication, hormones, lifestyle, diet, attitude and many other things. Previous research suggests that CGM systems could aid diabetics 1) in gaining better glycaemic control [3] [16], 2) during occurrence of impaired awareness of hypoglycaemia [17], and 3) in changing their living habits [8] [18] [19]. It is however not clear what impact the features of CGM software have on their users.
1.4.1 Glycaemic control
Glycosylated Haemoglobin type A1C (HbA1c) and Glucose Variability (GV) are two measurements of how well controlled the glucose levels of a diabetic are.
HbA1c is an average measurement for how good or bad the glucose levels in the blood have been over the last two to three months. HbA1c refers to Glycosylated Haemoglobin which is a molecule that forms when glucose joins with the protein Haemoglobin in the red blood cells [4]. The risk of getting long term complications from diabetes decreases along with lowering the HbA1c value. HbA1c is tested by the health care provider through a blood test, usually from the arm. CGM systems can estimate a fairly accurate HbA1c percentage from the continuous sensor data.
HbA1c measures the average blood glucose value over a long period of time, it does however not take into account how stable the blood glucose levels have been during that time period. Glycaemic Variability (GV) is a measurement of the changes in the amount of glucose that occur in the blood over a given period of time. The measurement has been shown to be independently predictive of severe hypoglycaemia in T1D’s [20].
The results from a study, conducted to compare different treatment modalities [16], suggests that a higher frequency of use of CGM systems leads to reduction in HbA1c levels. However,
11
to determine the contribution of the existing CGM applications it is crucial to study the extent to which their different functions are being used.
1.4.2 Impaired Awareness of Hypoglycaemia
Hypoglycaemia is the state in which the blood glucose levels are below the target range (< 4mmol/l). This triggers the “fight-or-flight” response that causes a wide variety of symptoms such as thumping heart, cold sweat, shakiness, and anxiety. If the blood glucose level continues to drop, the brain won’t get enough glucose, which will prevent it from functioning as it should and consequentially bring further symptoms such as blurred vision, confused thinking, slurred speech, irrational behaviour and drowsiness. Diabetics treat their hypoglycaemia by consuming a small amount of fast-acting carbohydrate (e.g. glucose tablets or fruit juice) However, if the blood glucose level fall to a state of severe hypoglycaemia, it is considered a diabetic emergency that if left untreated can have fatal consequences [21].
Because lowering blood glucose levels is a daily ambition in the managing of diabetes, occurrence of hypoglycaemia is a common problem. Studies have shown that frequent episodes of hypoglycaemia ultimately can cause impaired awareness of hypoglycaemia (IAH). That means they do not perceive the symptoms of the condition which prevents them to recognize and treat it in time [4]. This subsequentially leaves them at higher risk of ending up with severe hypoglycaemia. Patients with IAH tend to have more frequent episodes of severe hypoglycaemia than patients with normal hypoglycaemic awareness [22]. Other studies have shown that frequent use of CGM correlates with a significant improvement in glycaemic control, (reduction in HbA1c) as well as significantly reducing the number of hypoglycaemic events in diabetic patients [3], even in those with IAH [17].
1.4.3 Changing living habits
Associate Professor in psychology, Elisabeth Arborelius talked in a conference about how to affect patient’s living habits and conduct individual health care guidance. She highlights the importance of targeting the information on behaviour instead of knowledge and how the assertion that “knowledge will affect attitudes which in turn will change behaviour” is not true when it comes to living habits. Oftentimes health care providers expect people to be rational, when in most cases people are not. Things that objectively only mean disadvantages to health, is not always experienced as such for the person concerned. Arborelius argues that successful health information should base on facilitating the patient's own standpoint to their living habits, e.g. discussing the benefits and disadvantages they experience with changing them. If the disadvantages seem greater than the benefits, not even the threat of poorer health will help them to change their living habits [8]. Improving tools, such as CGM systems, is important in order to facilitate the managing of diabetes by reducing the disadvantages in the monitoring of blood
12
glucose. Thereby, the change of living habits related to diabetes will become less extensive to incorporate in the lives of users of this type of technology.
Previous research suggests that mobile health applications can improve the management of chronic diseases, both in terms of quality of life and better health status. A systematic literature review on studies on mobile health interventions in diabetes care showed a significant reduction in HbA1c levels in patients who incorporated mobile health applications in their managing of diabetes [18]. The significance was greater for adults than younger people and longer exposure of the mobile health intervention increased the significance further. In another systematic review of mobile health interventions for diabetes self-management, one of the main limitations identified in the available diabetes applications regarded the ease of data entry [19]. The conclusion of the review was a call to future research into how user-centred design could improve usability and perceived usefulness in this kind of interventions.
1.5 Research Questions and Purpose
The users of CGM applications are confronted with their interface multiple times every day. This makes it important that these applications not only are useful but also appealing to use.
A higher frequency of use of both CGM systems and mobile health applications in diabetes care increase glycaemic control in people with T1D. In order to determine the contribution of the provided functionality in CGM software it is crucial to study the extent to which it is being used and how it is perceived by the users.
“Although some products strive to be easy to use and efficient…critical products have to be easy to use and efficient. What differentiates a critical product from a noncritical product is that the entire reason for the critical product’s existence is for the user to complete a very important task. Not completing that task will have a significant negative outcome [23].“
This study aims to identify how users of CGM systems interact with and perceive different applications and what actual features they use in those. The focus lies on general self-management tasks for diabetics such as blood glucose monitoring, insulin dosage, physical exercise, decision support and notifications/alerts. Analysing the results may give insight into specific user behaviour and needs for future development of better CGM software.
RQ1: How do CGM users perceive and use different functionality in CGM applications? RQ2: What usability issues do CGM users experience in CGM applications?
13
2. Method
This study is based on mixed method research that involves collecting and analysing both quantitative and qualitative data. The results are then combined in order to provide a better understanding of the problem than if either dataset had been used alone [24].
First, a task specific usability inspection (TSUI) was made in order to identify differences as well as usability problems in common CGM applications. The efficiency of activities such as 1) logging data 2) navigating to different sections in the application, and 3) finding and interpreting key pieces of information, was measured using three different performance metrics.
Then an online survey was created and sent out into seven different support forums for users of CGM software with the intention of getting insight into how actual users perceive and interact with their CGM applications. Attitudes found in the usability inspection are validated in the analysis of the survey responses (p.56) [23].
2.1 Task specific usability inspection
Five tasks were generated to be completed in all three applications (mentioned in 2.1.1) in order to get insight into how different CGM applications work and what possible usability issues they carry. The monitor was recording 1) the degree to which the participant succeeded in completing the tasks, 2) the time it took for the participant to complete the tasks, and 3) the actions required for the participant to complete the tasks. After each task the monitor wrote comments about observations made during the interaction.
Taking into account that real CGM users most likely use the CGM application frequently throughout the day and should be familiar with the interface, the test session was carried out twice on each test participant with a break in between. The first session was measuring how users intuitively interpret and interact with the different interfaces. There is however a possible learning/confusing effect that a participant could experience from one application design to another (Chapter 3.3.10) [23]. Depending on the expectations of the test participants, this could either benefit or mislead them in completing the tasks in the next application. The second session was measuring the performance of the applications when the users already knew what they were expected to do and were aware of how the interfaces differ from each other.
14
2.1.1 Materials used
The hardware components of the CGM system used in this usability study are listed as follows: 1. ISF Sensor (Freestyle Libre)
2. NFC to Bluetooth translator (MiaoMiao transmitter) 3. Data receiver (Android phone)
The software components in this usability study were chosen from one of the following categories of CGM applications: Native applications, third-party applications, and open-source applications. The main criterion was that it had to be compatible with the hardware setup listed in previous paragraph. The list below describes each application and the category they fall into:
1. Tomato - a native application developed for the CGM hardware component: MiaoMiao Bluetooth transmitter.
2. Diabetes:M - a subscription based, paid, third-party application, high rated in the international app market.
3. xDrip - an open-source application that can be downloaded and installed for free on Nightscout’s website [1].
2.1.2 Tasks
Five tasks were generated to cover common types of scenarios in the use of CGM software. The first task involves monitoring blood glucose. It is considered a critical task, which unless performed could have a significant negative outcome (e.g. blood glucose values going out of target range). The second task involves logging treatment information. When performed, it gives more value to the CGM data. It is a task that should be performed repeatedly by the user and should for that reason be highly efficient. Tasks number 3 and 4 involves finding, understanding and interacting with health information. They are not performed as often as previous tasks, but they can give important insight into the users’ health status and can facilitate in conversation with their healthcare provider (HCP). Task number 5 involves navigating to a particular page in the settings section in the CGM application. It is not a task to perform frequently, but it is crucial for CGM users to be able to set up the application according to their individual condition.
1. Check what is the current status of the blood glucose? (value and change rate) 2. Log that you have eaten an apple (14 carbs) and taken 1 unit of insulin. 3. How many % of the past week was blood glucose within the target range? 4. What is the estimated HbA1c %?
15
2.1.3 Metrics
Since CGM applications are intended to be used on a frequent basis, they have to be both efficient and easy to use (Chapter 3.3.4) [23]. The amount of effort involved in completing the tasks in the previous paragraph was tested with the following three performance metrics: 1) Success rate, 2) task completion time, and 3) action count.
Success rate measures the level of success by a 4-point scoring method:
1. No problem, the user completed the task successfully without any difficulty or inefficiency. 2. Minor problem, the user completed the task successfully but took a slight detour.
3. Major problem, the user completed the task successfully but had major problems on the way. 4. Failure/gave up, the user provided the wrong answer or gave up before completing the task.
Task completion time is measuring the time it takes for a participant to complete a task. This is particularly important for tasks that are performed repeatedly by a user. The start and stop timing indicators are defined as follows: Monitor starts the time as the application is opened by the participant. Monitor stops the time as participant states the answer of the task or that the task has been completed.
Action count is measuring efficiency by comparing the number of actions used by the participant to accomplish the task with the minimum (optimum) number of actions needed to accomplish the task. The four actions to record are 1) clicks (taps), 2) scrolls (swipes), 3) zooms (pinches) and 4) inputs of data (text, number or voice input).
2.1.4 Participants
Both of the participants have T1D. Neither of them had ever used a CGM system before, thereby they fall into the category of novice users. They are both regular application users and consider themselves generally comfortable with technology. The first test participant is a 30-year old male and the second test participant is a 28-year-old female. Both of them remain anonymous in this study.
2.1.5 Execution
The applications were tested on a smartphone that was connected to a MiaoMiao Bluetooth transmitter on top of a Freestyle Libre sensor that was inserted in a CGM user. The CGM user had been using all three applications frequently a month prior to the execution of the TSUI in order to feed the applications sufficient diabetes data. The CGM user was the one moderating the test participants during the TSUI.
The participants were ahead of initiating the TSUI informed how CGM systems work and the given instructions are described as follows:
16
1. Imagine you are the one wearing the sensor, that the data in the applications is your diabetes data, when completing the tasks.
2. Each task will be read to you out loud. You are expected to confirm you understand what the task involves you doing prior to proceeding.
3. Each task will start from the initial page that appears when opening (pressing) the application that is being tested.
4. When you are confident you have completed a task, you should either speak the answer out loud or say “done”.
5. The intention of this test is to measure the performance of the applications, not You. Do not try to perform good or fast. Just complete the tasks as you intuitively would have if you were not in this lab environment.
A session involves completing all tasks in each application. The first sessions started out in the morning and the second sessions later that same afternoon. The order of which the applications were tested was different for the two participants. The first participant started out with the xDrip application, followed by the Diabetes:M application and last the Tomato application. The second participant started from the opposite end.
2.2 Survey
The online survey was constructed to collect both quantitative and qualitative data. It has a summative approach with focus on user attitude and self-reported behaviour (p.54) [23].
2.2.1 Structure of the Questionnaire
Using google forms [25], a web-based questionnaire was designed in English, divided in pages and sections. The first page collected data about the participant, such as demographic information, relationship to diabetes, time since diagnosis, and diabetes status. the second page about which kind of CGM system they use and how long they have been using it. The following eight pages consisted of sections regarding how common functionality in CGM applications is perceived and used by the participant. Each section was constructed to collect both quantitative and qualitative data through multiple choice-, short-, and long-answer questions. All questions were optional in order to increase the completion rate of the survey. Research suggests that requiring responses of each question in a survey may both reduce overall data quality and the completion rate of the participants [26]. The survey in this study was anonymous, and no incentives were offered.
17
2.2.2 Participants of the Survey
A recruiting criterion was used in order to determine whether or not a person was eligible to participate in the study (Chapter 3.5.2) [23]. The criterion was defined as follows: “You use a CGM system to manage your, or your child’s diabetes”. The criterion was provided both in the post with the link to the online survey and in the first section of the online survey.
The online survey was sent out in seven online support groups, for users of different CGM systems where people reach out to each other for support when having problems regarding their CGM or diabetes. These groups were chosen in the endeavour to reach out to both novice and expert users, based on the assumption that active members of the support group are either asking or answering questions.
18
3. Result of task specific usability inspection
This section contains the result from the task specific usability inspection. The main observations that was made by the monitor are described, followed by the result for each performance metric: success rate, task completion time and action count.
3.1 Monitor observations
Tomato - The major problems in the Tomato application occurred during the second task: “Log that you have eaten an apple (14 carbs) and taken 1 unit of insulin”. It seems to depend on the fact that the user interface does not allow for multiple data inputs before saving a log entry. Intuitively both participants tried to toggle between the insulin-shot symbol and the cutlery symbol (see Figure 2, the first screenshot), but that action removed the previously inputted data which only increased their task completion time and action count. Other usability issues encountered during the last task: “Navigate to the page where you can change the target range for blood glucose.” The participants were searching in the two different settings menus, where that option was nowhere to be found. In the tomato app most features are visible in each user interface.
Diabetes:M - The blood glucose value is displayed much smaller in the Diabetes:M application compared to the other CGM applications in this TSUI. The buttons for saving a log entry was generally confusing for first time users. One of the participants seemed frustrated to be confronted with an error pop-up, asking “Are you sure you want to save this data?” when trying to save the entry. A logged entry does not show up on the graph on the home screen, and when pressing the graph, the settings for CGM opens up which not seem to be expected by the participants. In order to be sure the entry had been saved, the participants had to open the “log-book” section. During task #3, participants were intuitively looking for information such as Time (%) blood glucose was
within target range this week on the statistics page, where it was nowhere to be found.
xDrip - Finding information in the xDrip application was generally hard for the participants. They made major detours in the menus on their first tries. The participants seemed to somewhat remember the path during the following session. Some of the charts in the statistics section miss labels and description, this leaves the user clueless to what they are looking at. Both users struggled, on their first tries, to understand that swiping was required to find more graphs and data in the statistics section.
19
Figure 2 - Screenshots of the logging interfaces of the applications: 1) Tomato, 2) Diabetes:M, and 3) xDrip.
3.2 Success Rate
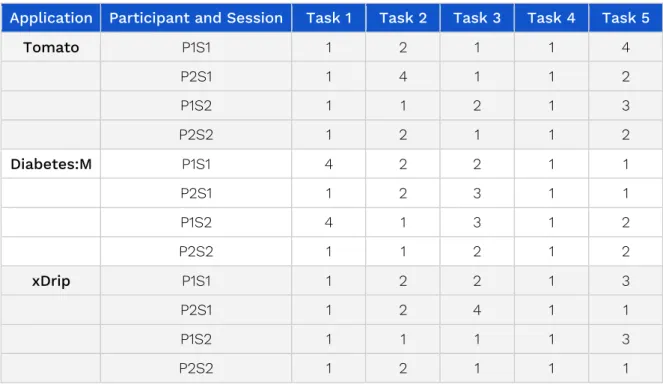
Table 1 outlines the result of the metric: Success Rate. The letters P and S stands for the what participant and what session the result represents (e.g. P1S1 represents the result from Participant 1 and Session 1). The numbers 1-4 represents the degree of which the task was completed or not, as defined in chapter 2.1.3.
Application Participant and Session Task 1 Task 2 Task 3 Task 4 Task 5
Tomato P1S1 1 2 1 1 4 P2S1 1 4 1 1 2 P1S2 1 1 2 1 3 P2S2 1 2 1 1 2 Diabetes:M P1S1 4 2 2 1 1 P2S1 1 2 3 1 1 P1S2 4 1 3 1 2 P2S2 1 1 2 1 2 xDrip P1S1 1 2 2 1 3 P2S1 1 2 4 1 1 P1S2 1 1 1 1 3 P2S2 1 2 1 1 1
20
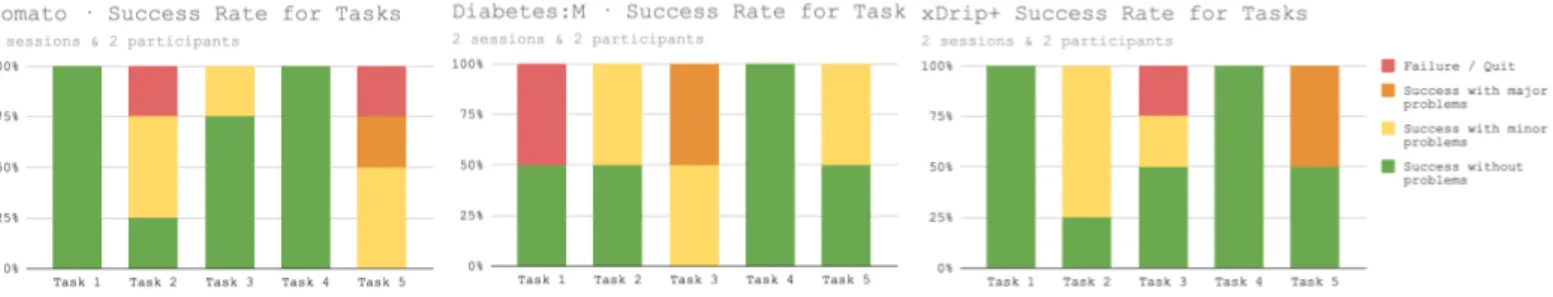
The graphs include the results from both sessions and participants in the TSUI. The figure visualizes what tasks were generally hard/easy to complete in the different applications by outlining the distribution of the various levels of success.
Figure 3 - TSUI Result: Success Rate for (three graphs).
3.1.2 Task Completion Time
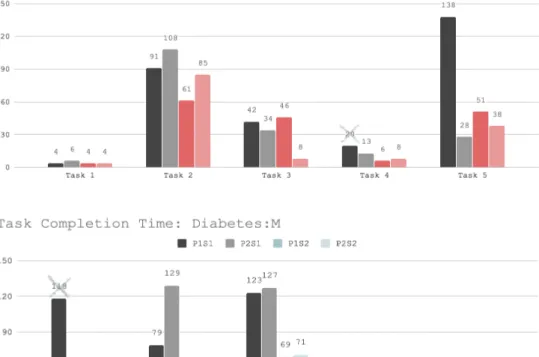
Figure 5 ountlines the detailed result for both sessions and participant of each application. The letters P and S stands for the what participant and what session the result represents (e.g. P1S1 represents the result from Participant 1 and Session 1). A crossed out number in this figure represents that the task was not completed, and the number represents the time elapsed before the participant either gave up or gave the wrong result.
21
22
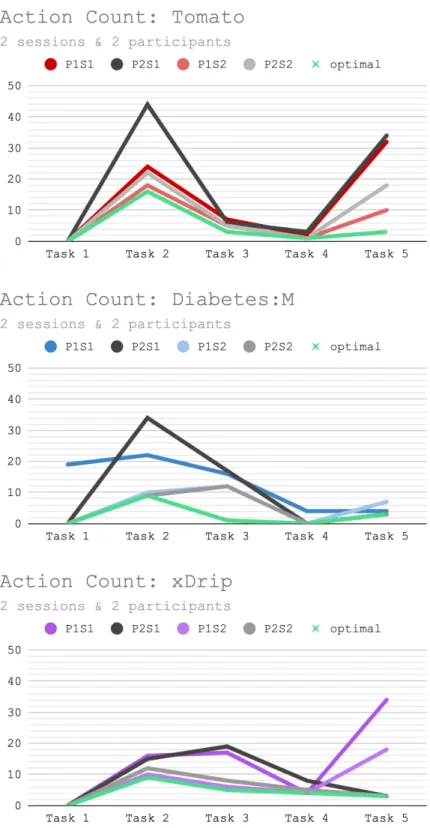
3.1.3 Action Count
Figure 5 and 6 outlines the result of the metric: Action Count in the TSUI. Figure 5 represents the optimal outcome (left barchart) of each task compared to the average result of both sessions and participants (right barchart). Figure 6 consist of three line-graps that represent results for one application at a time. The letters P and S stands for the what participant and what session the result represents (e.g. P1S1 represents the result from Participant 1 and Session 1).
Figure 5 - Minimum (optimal) number actions required to complete a task compared with average number of actions it took for participants to complete the task: Two sessions and two participants (two bar-charts).
23
Figure 6 - Number of actions required for participants to complete a task compared with minimum(optimal) actions required to complete the task (three line-graphs).
24
4. Result of survey
There was a total of 184 CGM users who participated in the survey. 134 (73%) of the participants have T1D whereas 45 (24%) are parents or guardian to someone with T1D. One person entered both having T1D and being a parent to a child with T1D. The remaining 3% have T2D, except one person with total pancreatectomy.
33 participants (18%) have not specified what application they use, or they have answered that they do not use any application. The fact that the only criterion of participating in the study was being a
user of a CGM application, has partly excluded their contribution from this study. They are however
all users of some kind of CGM system, only a system without any mobile application, which also make their input valuable. Some of their contribution constitutes parts of Appendix A-E.
What was left after excluding non-CGM-application-users is: 151 participants that have entered that they use one CGM application or more. 101 of those (67%) use only one CGM application, whereas 50 participants (33%) use multiple CGM applications.
Two other user groups are 1) 116 participants (77%) that use a CGM system to monitor the blood sugar of themselves (people with T1D, T2D or total pancreatectomy), and 2) 36 respondents (23%) that use a CGM system to monitor the blood sugar of someone else (parents or guardians to a child with T1D).
25
4.2 Application use
The two applications with most users from this study is xDrip (38%) and Spike (22%). 53% of the participants who use xDrip, use other CGM applications in addition to that, and 61% of the Spike users, also use additional CGM applications. Figure 7 outlines the number of users that use
multiple CGM applications (orange) compared to the number of users that use only that particular CGM application (green), and no additional CGM application. Table 1 outlines the percentage
of the users of each application that entered that they only use that particular application.
Figure 7 - Number of CGM application users who use multiple applications, compared with the number of users that use only one particular CGM application.
Table 2 - Percentage of CGM application users who use only that particular CGM application.
The majority (86%) of the participants who care for someone else with T1D use a single CGM application. The majority (61 %) of the participants who care for themselves (with type 1 and 2 diabetes and total pancreatectomy), also use a single CGM application.
Tomato Diabetes:M xDrip Spike Dexcom Glimp mySugr Nightscout
26
4.3 Functionality use
Figure 8 outlines the distribution of what data is logged by users (%) of different CGM application. This graph does not take into account that the users may use multiple CGM applications.
Note: there are not the same number of users for every application in these comparisons. Table 2 shows the number of users for each application in these representations.
Results for parents / guardians to diabetics and diabetics separately can be found in Appendix H and I. Results that concern single application users, for xDrip, Spike and Dexcom can be found in Appendix J to L.
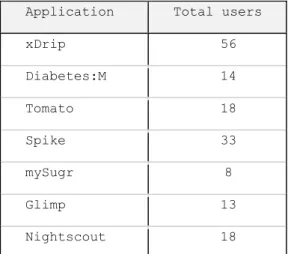
Figure 8 - Visualizes the percentage of users of different CGM applications that log certain data.
Application Total users
xDrip 56 Diabetes:M 14 Tomato 18 Spike 33 mySugr 8 Glimp 13 Nightscout 18
27
4.3 Frequency of use
The majority of the participants (95%) in this study use their CGM system multiple times every day (see Figure 9).
Figure 9 - How often participants use the CGM system.
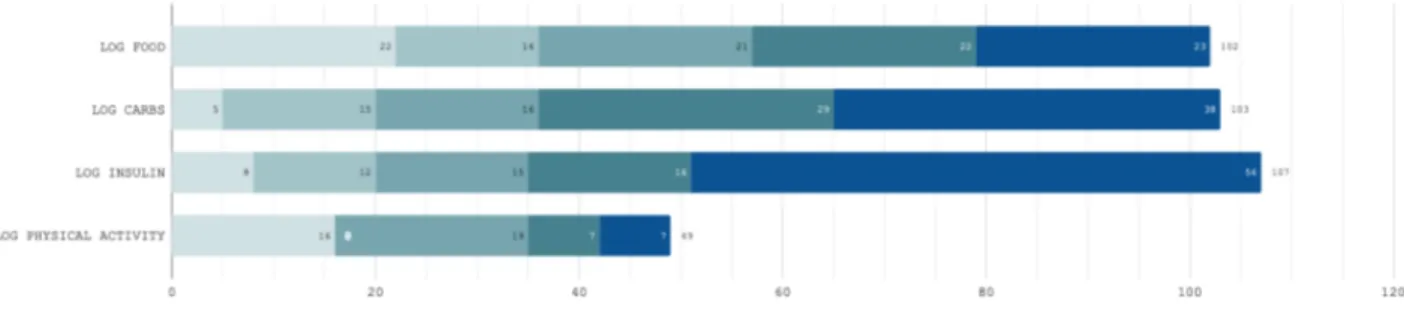
The majority of the participants in this study have entered that they log food (68%), carbs (68%) and insulin (71%) in the CGM application they use. The majority of those have entered that they do it almost every time, or every time they have eaten, eaten carbs, taken insulin or been physically active. Figure 10 outlines the number of participants who log this data and at what frequency. 32% of the CGM users in this study log physical activity, and 33% of those only do it very seldom.
28
4.4 User Experience
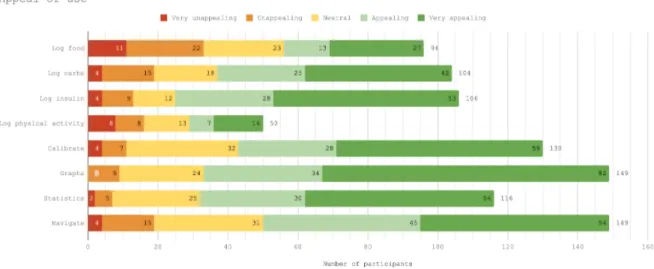
For the most part, CGM users experience the functionality in the applications they use in a similar way. For each functionality category in the survey, there were questions regarding the ease and the appeal of use. In both user groups (people who care for themselves/people who care for others, people who use a single application/people who use multiple applications etc.) the majority of the participants entered that the functionality is easy or very easy, and, appealing or very appealing to use (see Figure 11 and 12).
Figure 11 - How easy / hard participants perceive functionality in CGM applications.
29
4.5 Qualitative Results
The results from the long-answer questions regarding logging data, using graphs, statistics and navigation can be found in the Tables in Appendix A-E. The responses to the question asking the participants to describe any functionality in the CGM application they particularly like or dislike to use, the alarm was the most mentioned feature in both positive and negative regards (see figure 13 and 14). The alarms seem to be a must-have feature that helps users, especially those who struggle with impaired awareness of hypoglycaemia (IAH). The negative perspective of the alarms involves for the most part the lack of settings such as volume, frequency and how they are triggered.
Figure 13 - Qualitative codes for: Functionality CGM users particularly like to use.
30
5. Analysis
Findings from the responses to the long answer questions in the survey (see Appendix A-F) can validate
some of the usability issues that emerged from the task specific usability inspection (see p. 17). In this
section connections are made by referencing different data in this study.
The responses to the question “What actual data do you record in the CGM application?” shows that the most varied data is being recorded by the users of the applications: mySugr and Diabetes:M
(see Figure 7). These CGM applications have a similar interface where the way of logging data resembles
one another. In their interface for logging data, input fields for multiple types of data are provided (see Figure 2: the second screenshot). It is possible that the interface is influencing the users to not wanting to
leave empty fields and may consequently be the one to consider if wanting to manipulate users to log more datapoints. The Dexcom application, however, does not allow the user to log much data. It only presents the real-time sensor values in the graph on the screen, along with statistics. Dexcom users does not choose not to record this data, they simply cannot do it in the application. One Dexcom user claimed that he would log more data in the application, if it was easier to do so (see 9 in Appendix A).
The quantitative data in this study does not seem to show any significant difference in how different features in CGM applications are being perceived, regardless of user perspective.The majority of the participants have entered that the functionality is easy or very easy, and, appealing or very appealing to use (see Figure 10-11). The fact that the majority of the users of the applications: Tomato, Diabetes:M,
Spike and mySugr, in this study, use multiple CGM applications (see Figure 7 and Table 2), implies that all
their needs are not met in these particular applications alone.
In order to increase the frequency of logging data and the amount of datapoints being logged in CGM applications, it is according to this study advisable to provide a user interface with multiple input fields for data. No more than one input field should be required by the user to save an entry. If the action is too time consuming to complete, it could likely end up with the user not logging anything at all (see 1, 14 in Appendix A).
The reason CGM users more frequently log food, carbs and insulin than physical activity in their applications (see Figure 10), is probably due to the fact that by logging those, they get something in
return. Many CGM applications provide functionality for predicting future glucose values. In order to be accurate, it needs information of when and how much insulin was taken, and how many carbs was consumed. Settings for how sensitive the person wearing the sensor is to insulin, can be changed accordingly. When these values are set up correctly, the predictions can become highly convenient. Prediction functionality is also one of the most positively mentioned features in the responses to the question: “Is there any functionality you particularly like or dislike to use?”(see Figure 13).
31
When a log entry has been saved, the user should be provided with some simple feedback of the data that was logged. In case of a falsely made input, there should be an undo button close at hand for a smoother interaction, rather than interrupting the users by asking them to confirm they are sure they want to complete the action they are trying to carry out (see 4 in Appendix C). In the TSUI made on the
Diabetes:M application during the first task: Log that you have eaten an apple (14 carbs) and taken
1 unit of insulin, participants were, by the lack of instant feedback, not sure whether their entry had
been saved or not. In order to be sure, they had to open the “log-book” section where they could find their saved data entry.
The participants were during the same task expecting the graph to be interactive and that the logged items would appear in it, but by pressing on the graph they instead opened up a settings interface which was not intuitive. Since the graph is one of the most prominent things on the home screen in CGM software, it seems like a waste of space to only present it as a static element (see 19 in Appendix B).
Some CGM users like to see their data entries in the real-time CGM graph and to have the option to navigate to different data points by zooming in and out of it. This gives them the ability to map their logged events to occurrence of high or low blood glucose values. (see 5, 19, 20, 22, 35 in Appendix B). The
real time CGM graph is generally perceived to be great for identifying trends (see 5, 14, 27, 33, 34, 39, 4, 42 in Appendix B) and patterns (see 12, 13, 16, 36 in Appendix B) in blood glucose values.
In order to make the logging process more efficient for users who perceive the regular input process to be too time consuming (see 3, 16, 20, 22, 23 in Appendix A), providing an option to save data inputs they
log frequently in some sort of a shortcut button could be a solution.
The amount of mental resources that is required to operate a system is called cognitive load [27]. Minimizing cognitive load is a way of improving the user experience and can be done by eliminating
unnecessary tasks that require users to e.g. read text or remember certain pieces of information (see 10 in Appendix C).
“Just like computers, human brains have a limited amount of processing power. When the amount of information coming in exceeds our ability to handle it, our performance suffers. We may take longer to understand information, miss important details, or even get overwhelmed and abandon the task.” [27]
The most mentioned CGM feature in the survey is the alarm. Both positive and negative aspects are found in the survey responses. The alarms seem to be a life-saving and life-improving feature (15, 20, 23-24, 26 in Appendix D) which give both parents and diabetics the relief to sleep at night, without having
to make blood tests in the middle of the night to be sure the glucose levels are under control. The most mentioned issues concern the lack of settings such as volume, frequency and how the alarms are triggered. The majority of these comments comes from Dexcom users (see 1, 6, 8, 35, 36, 43, 47, 49-50 in Appendix D). xDrip and Spike provide more options for customization, they are however experienced
32
It is important that CGM users are able to set up the application according to their own personal preference in order to increase the appeal of use. The option to make adjustments to the appearance of the graph, such as how datapoints either are displayed as dots or a line in the graph, as well as choosing from different colours (see 9, 21, 29, 38 in Appendix B).
Both applications, xDrip and Spike, provide a lot of options for tailoring the functionality according to personal preference, but the interface in the menus and settings are not perceived as very intuitive by its users (see 7, 20, in Appendix C).
“Spike’s ability to customize alarms is truly amazing; however, it takes a lot of time to set them up the first time” (see 5 in Appendix D).
During task #5: Navigate to the page where you can change the target range for blood glucose in the TSUI made on the xDrip application, one participant got lost in and struggled so much in completing the task that the metric action count ultimately turned out to be more than eleven times greater than the optimal path (see Figure 6). The most mentioned issues in the survey responses regarding navigation
comes from users of xDrip, and Spike who do not experience their navigation as user-friendly (see 2-3, 5, 8-9, 16-17, 22 in Appendix C).
The participants in the survey also seem to have different ideas or degrees of perception of what actual functionality is provided in the CGM application they use. One xDrip user, who is a parent to a child with T1D, phrased that she dislikes the lack of follow functionality for the parent. By that, she means functionality for sharing real-time glucose values with multiple devices. This functionality is in fact provided in xDrip, although that might not be obvious to some users because of the interface. This “Follow functionality” is called remote monitoring. It enables users to view their continuous data on multiple devices. This is a feature that parents value highly because they can see the diabetic status of their child, even when apart (see 4, 12-13 in Appendix E). Other important functionality are
predictions about future glucose values and information about at what rate and what direction the glucose levels are going (see 23, 27, 40 in Appendix B).
Statistics can be motivating for users when presented in different formats, such as the time (%) the blood glucose values have been above, within and below the target range (see 22 in Appendix F). HbA1c
is a measurement that most diabetics understand the meaning of, but other measurements can be hard to interpret without any explanation of what it is and how it is calculated (see 1, 25 in Appendix G).
Providing this kind of information and why it is important, could teach Diabetics more about their condition and how to measure success in stabilizing blood glucose values.
33
6. Discussion
Today the use of CGM systems are one of the most convenient ways of monitoring blood glucose. In comparing CGM to regular blood glucose monitoring (BGM), the CGM comes across as a lot more convenient. When analysing the survey responses, it appears like many participants have considered the whole CGM system, in contrast to BGM, when answering the questions regarding ease and appeal of use of different functionality, instead of focusing on the functionality belonging to the actual application.
In the responses from users of multiple applications it is not possible to know what application is associated with the features the responses concern. This could have been prevented, either by asking the participant to enter what application they use for each feature, or to make the respondents answer the whole survey with solely one application in mind.
6.1 Limitations
The following limitations should be considered when interpreting the results from this study: First of all, in comparing the responses from CGM users with different background, the sample sizes are not equal. That is also the case when comparing from the perspective of which application they use. Most respondents of the survey use multiple CGM applications and it is not clear which application they refer to when answering the questions.
The online survey was solely sent out in online forums, which means only CGM users who were members of those could answer the survey, the data is therefore much likely biased.
6.2 Future work
Future studies with equal sample sizes of users from each application is needed in order to determine what impact different user interfaces and functions have on their users.
Apart from food and insulin, there are many other factors that affects blood glucose. Potential automation in logging e.g. physical activity, stress and sleep tracking could be done by collecting data from other applications and devices such as step counters, smart-watches, pulse meters, female ovulation trackers etc. It could be interesting to explore whether this connection is beneficial to end users and if this type of multivariate data could be visualised and implemented in the same real time graph.
34
7. Conclusion
In the exploring how users perceive and interact with CGM software, that consisted of a small usability inspection with two participants on three available CGM applications, followed by an online survey where a total of 151 CGM application users have answered question regarding their experience with the application(s) they use, the following findings have emerged:
RQ1: How do CGM users perceive and use different functionality in CGM applications?
The majority of CGM users in the present study experience functionality such as logging food, carbohydrates and insulin as easy and appealing to use. The majority of those log this data every time, or almost every time they eat food, carbohydrates or take insulin. Only 32% of the CGM users log physical activity in the CGM application, and the majority of those do it very seldom.
The most mentioned features in the present study are: Alarms, interoperability, predictions and graphs. Alarms are good for critical metrics, but the user should be able to control the characteristics of the alarm (such as volume, sound, frequency and how they are triggered).
It is important that CGM applications can interoperate with other applications and devices. Many users use more than one CGM application.
Functionality that predicts future blood glucose values based on the connection between current glucose value and logged insulin and carb intake are experienced as very helpful.
The graph is perceived as great for identifying trends and patterns in blood glucose levels. It should be an interactive element that enables users to zoom in and out of it to control the amount of datapoints displayed at once.
RQ2: What usability issues do CGM users experience in CGM applications?
In the application xDrip and Spike, navigation seem to be a common issue. Sections are flooded with options for customising the application to behave a certain way. This type of interface seems to increase the cognitive load in users which could be the reason some users are unaware of parts of what functionality the application provides.
35
10. Table of figures
Figure 1 -Freestyle Libre sensor measuring glucose in the interstitial fluid [9]. ... 8 Figure 2 - Screenshots of the logging interfaces of the applications: 1) Tomato, 2) Diabetes:M, and 3) xDrip. ... 19 Figure 3 - TSUI Result: Success Rate for (three graphs). ... 20 Figure 4 - Time it took (seconds) to complete the tasks in 1) Tomato, 2) Diabetes:M and 3) xDrip. ... 21 Figure 5 - Minimum (optimal) number actions required to complete a task compared with average number of actions it took for participants to complete the task: Two sessions and two participants (two bar-charts). ... 22 Figure 6 - Number of actions required for participants to complete a task compared with minimum(optimal) actions required to complete the task (three line-graphs). ... 23 Figure 7 - Number of CGM application users who use multiple applications, compared with the number of users that use only one particular CGM application. ... 25 Figure 8 - Visualizes the percentage of users of different CGM applications that log certain data. ... 26 Figure 9 - How often participants use the CGM system. ... 27 Figure 10 – The number of CGM application users who log different types of data and the frequency of which it is done. ... 27 Figure 11 - How easy / hard participants perceive functionality in CGM applications. ... 28 Figure 12 - How appealing / unappealing participants perceive functionality in CGM applications. ... 28 Figure 13 - Qualitative codes for: Functionality CGM users particularly like to use. ... 29 Figure 14 - Qualitative codes for: Functionality CGM users particularly dislike to use. ... 29
11. Table of tables
Table 1 - Result of the metric Success Rate in the TSUI. ... 19 Table 2 - Percentage of CGM application users who use only that particular CGM application. ... 25 Table 3 -Total number of users of CGM applications (they may or may not be users to additional CGM applications) ... 26
36
References
[1] International Diabetes Federation, “About Diabetes: What is diabetes,” International Diabetes Federation, [Online]. Available: https://www.idf.org/aboutdiabetes/what-is-diabetes.html. [Accessed 8 August 2019].
[2] International Diabetes Federation, “About diabetes: complications,” IDF, [Online]. Available: https://www.idf.org/aboutdiabetes/complications.html. [Accessed 08 August 2019].
[3] J. C. Pickup, S. C. Freeman and A. J. Sutton, “Glycaemic control in type 1 diabetes during real time continuous glucose monitoring compared with self monitoring of blood glucose: meta-analysis of randomised controlled trials using individual patient data,” BMJ (Clinical research ed.), Published online, 2011.
[4] National Clinical Guideline Centre (UK), Type 1 Diabetes in Adults: Diagnosis and Management, London: National Institute for Health and Care Excellence (UK), 2015. [5] International Diabetes Federation, “About diabetes: Type 1 Diabetes,” [Online]. Available:
https://idf.org/aboutdiabetes/type-1-diabetes.html. [Accessed 08 August 2019].
[6] International Diabetes Federation, “About diabetes: Type 2 diabetes,” [Online]. Available: https://www.idf.org/aboutdiabetes/type-2-diabetes.html. [Accessed 8 August 2019]. [7] International Diabetes Federation, “Gestational diabetes,” IDF, [Online]. Available:
https://www.idf.org/our-activities/care-prevention/gdm.html. [Accessed 8 August 2019]. [8] R. Hanås, Typ 1 Diabetes hos barn, unga och unga vuxna, Västerås, Sweden: BetaMed AB,
2008.
[9] Abbott, “How does the Freestyle Libre system measure my glucose?,” Abbott, 18 05 2016. [Online]. Available: https://freestylediabetes.co.uk/freestyle-thinking/post/FreeStyle-Libre-system-measure. [Accessed 08 08 2019].
[10] E. Cengiz and W. V. Tamborlane, “A tale of two compartments: Interstitial versus blood glucose monitoring,” Diabetes Technology & Terapeutics, Published online, 2009. [11] Abbott, “Freestyle Libre In-service guide,” 2017. [Online]. Available:
https://www.myfreestyle.com/provider/sites/all/themes/provider20/pdf/FreeStyle-Libre-In-Service-Guide.pdf. [Accessed 08 August 2019].
[12] J. Woodfield, “The #WeAreNotWaiting movement is helping people with diabetes improve their health now, not later,” Diabetes.co.uk, 19 07 2016. [Online]. Available:
37
https://www.diabetes.co.uk/blog/2016/07/the-wearenotwaiting-movement-is-helping-people-with-diabetes-improve-their-health-now-not-later/. [Accessed 08 08 2019].
[13] Nightscout Foundation Org., “About,” Nightscout Foundation, [Online]. Available: http://www.nightscoutfoundation.org/about. [Accessed 08 08 2019].
[14] The Nightscout Project, “Welcome to Nightscout,” The Nightscout Project, [Online]. Available: http://www.nightscout.info/. [Accessed 08 08 2019].
[15] Nightscout Foundation, “Nightscout xDrip+,” xDrip & Nightscout, [Online]. Available: https://github.com/NightscoutFoundation/xDrip. [Accessed 08 August 2019].
[16] J. Šoupal, L. Petruželková, M. Flekač, T. Pelcl, M. Martin, D. Martina, J. Škrha, Š. Svačina and M. Prázný, “Comparison of different treatment modalities for type 1 diabetes, including sensor-augmented insulin regimens, in 52 weeks of follow-up: s COMISAIR study,” Diabetes Technology & Therapeutics, Published online, 2016.
[17] C. A. van Beers, H. J. DeVries, S. J. Kleijer, M. M. Smits, P. H. Geelhoed-Duijvestijn, M. H. H. Kramer, M. Diamant, F. J. Snoek and E. H. Serné, “Continuous glucose monitoring for patients with type 1 diabetes and impaired awareness of hypoglycaemia (IN CONTROL): a randomised, open-label, crossover trial,” The Lancet Diabetes & Endicrinology, Published online, 2016.
[18] X. Wang, W. Shu, J. Du, M. Du, P. Wang, M. Xue, H. Zheng, Y. Jiang, S. Yin, D. Liang, R. Wang and L. Hou, “Mobile health in the management of type 1 diabetes: a systematic review and meta-analysis,” BMC Endocrine Disorders, online, 2019.
[19] O. El-Gayar, P. Timsina, N. Nawar and W. Eid, “Mobile Applications for Diabetes Self-Management: Status and Potential,” Journal of Diabetes Science and Technology, online, 2013.
[20] L. Fuqua, “Diabetes in control,” 30 September 2015. [Online]. Available:
http://www.diabetesincontrol.com/teaching-patients-about-glycemic-variability-and-why-its-important/. [Accessed 08 08 2019].
[21] American Diabetes Association, “Hypoglycemia,” 11 February 2019. [Online]. Available:
http://www.diabetes.org/living-with-diabetes/treatment-and-care/blood-glucose-control/hypoglycemia-low-blood.html. [Accessed 8 August 2019].
[22] C. M. Reno, M. Litvin, A. L. Clark and S. J. Fisher, “Defective counterregulation and hypoglycemia unawareness in diabetes: Mechanisms and emerging treatments,” Endocrinol Metab Clin North Am., Published online, 2013.
38
[23] T. Tullis and W. Albert, Measuring the user experience: collecting, analyzing, and presenting usability metrics, San Fransisco, United States: Elsevier Science & Technology, 2013. [24] J. W. Creswell and V. L. Plano Clark, Designing and conducting mixed method research,
California: SAGE Publications Ltd., 2007.
[25] Google, “Google Forms,” Google, [Online]. Available: https://www.google.com/forms/about/. [Accessed 08 August 2019].
[26] J. P. Décieux, A. Mergener, K. M. Neufang and P. Sischka, “Implementation of the forced answering option within online surveys: Do higher item response rates come at the expense of participation and answer quality?,” Serbian Psychological Association, Published online, 2015.
[27] K. Whitenton, “Minimize Cognitive Load to Maximize Usability,” Nielsen Norman Group, 22 December 2013. [Online]. Available: https://www.nngroup.com/articles/minimize-cognitive-load/. [Accessed 08 August 2019].
[28] D. E. Jake-Schoffman, V. J. Silfee, M. E. Waring, E. D. Bordeaux, R. S. Sadasivam, S. P. Mullen, J. L. Carey, R. B. Hayes, E. Y. Ding, G. G. Bennett and S. L. Pagoto, “Methods for evaluating the content, usability, and efficacy of commercial mobile health apps,” JMIR Mhealth Uhealth, Published online, 2017.
[29] Diabetes Förbundet, “Om diabetes: Lär dig om diabetes,” Diabetes Förbundet, 12 October 2017. [Online]. Available: : https://
www.diabetes.se/diabetes/lar-om-diabetes/typer/graviditetsdiabetes. [Accessed 8 August 2019]. [30] Google, “Google Sheets,” Google, [Online]. Available:
39
Appendix A: Logging data
Index Answers to question: “Is there anything you particularly like or dislike about logging
data in the application?” CGM application
1. Time consuming, I don't do it all the time. xDrip
2. I like automation, manual effort is too much hassle, so I only really log CGM results. xDrip
3. Slower to respond than I'd like. xDrip
4. No facility for basal recording. xDrip
5. I dislike that I can't log basal and I can't mark sqare bolus. xDrip
6. Except Blood Glucose, much data many people don't know how to use in a good way. Spike, xDrip, mySugr, Glimp
7. Data input too complicated. Tomato, Glimp
8. Bit tedious and I usually forget to do it, except glucose level. Spike, Tomato
9. If they’d make it easier, I’d add more data. Dexcom
10. Applications not talking to each other. xDrip, Dexcom, Diabetes:M
11. It is very hard to describe the food in weight and size. Dexcom, Glimp Spike, xDrip,
12. Some parts of logging are not intuitive and open to problematic input/review.
Spike, xDrip, Tomato, mySugr,
Diabetes:M
13. It is the general nuisance of having to do the data entry that is the part I dislike. The app
itself makes entering the data quick and simple once everything is set up. Spike
14. Sometimes it can be tedious to log all the possible data options. mySugr
15. A lot of hassle. Spike, One Drop
16. It is too time consuming to do it every time I should. Dexcom, Sugarmate
40
18. Like the way input data on phone and it automatically uploads to Nightscout rather than being separately uploaded like in the Libre application. Tomato
19. Like that It's automatically recorded. xDrip, Tomato
20. I like the widget function that I can log a repeated function with a single click. Spike, Nightscout 21. Difficult to read / filter on the data afterwards to identify patterns etc. Unspecified app 22. I live a busy work/life, I don't always have the time to enter data. Unspecified app
23. It takes too long. Unspecified app
Appendix B: Graphs
Index Answers to question: “Is there anything particular you like or dislike about the graphs in
the application? Please describe.” CGM application
1. I like to see where I am not staying between my high and low thresholds and how I can
change that. Dexcom, Sugarmate
2. The algorithms used by Loop and Spike are very interesting when analysing how a certain
food affects my blood glucose levels. Spike, Loop
3. Like the options for overview. mySugr
4. Like being able to see exact time and blood glucose level on the graph as needed. Dexcom
5. Allows me to track trends. Would love to be able to zoom in on the graph to get a more
specific view of certain data. LibreLink
6. Very basic graphics. xDrip
7. Shows IOB and COB and times you have taken both.
Spike, xDrip, Tomato, mySugr,
Diabetes:M
8. They don’t make you feel great. Tomato
9. I prefer it to display dots rather than lines in the graph. Spike, xDrip
10. I can see how the blood sugar goes the whole day and night, not only before and after
![Figure 1 -Freestyle Libre sensor measuring glucose in the interstitial fluid [9].](https://thumb-eu.123doks.com/thumbv2/5dokorg/4025736.82109/8.892.143.558.198.360/figure-freestyle-libre-sensor-measuring-glucose-interstitial-fluid.webp)