Proficiency Testing
Drinking Water Microbiology
March 2018
Tommy Šlapokas
Edition
Version 1 (2018-05-29) Editor in chief
Hans Lindmark, Head of Biology department, National Food Agency Responsible for the scheme
Tommy Šlapokas, Microbiologist, Biology department, National Food Agency PT March 2015 is registered as no. 2017/00791 at the National Food Agency, Uppsala
Proficiency testing
Drinking water Microbiology
March 2018
Parameters included
Coliform bacteria and Escherichia coli with membrane filter method (MF) Coliform bacteria and Escherichia coli, (rapid methods with MPN)
Clostridium perfringens with MF
Actinomycetes with MF Moulds with MF Yeasts with MF
Culturable microorganisms (total count) 3 days incubation at 22 °C
Tommy Šlapokas
Linnea Blom & Ramiyeh Molaei
Abbreviations and explanations
Microbiological mediaACTA Actinomycete Isolation Agar (according to SS 028212)
CCA Chromocult Coliform Agar® (Merck; according to EN ISO 9308-1:2014)
Colilert Colilert® Quanti-Tray® (IDEXX Inc.; according to EN ISO 9308-2:2014) LES m-Endo Agar LES (according to SS 028167)
LTTC m-Lactose TTC Agar with Tergitol (acc. to EN-ISO 9308-1:2000) m-FC m-FC Agar (according to SS 028167)
PAB/TSC/SFP Tryptose Sulfite Cycloserine Agar (acc. to EN ISO 14189:2016) RBCC Rose Bengal Agar with both chlortetracycline and chloramphenicol
(according to SS 028192)
YeA Yeast extract Agar (according to EN ISO 6222:1999)
Other abbreviations
MF Membrane filter (method)
MPN "Most Probable Number" (quantification based on statistical distributions) ISO "International Organization for Standardization" and their standards EN European standard from "Comité Européen de Normalisation" (CEN) NMKL "Nordisk Metodikkomité for næringsmidler" and their standards
DS, NS, SFS, SS National standards from Denmark, Norway, Finland and Sweden
Legend to method comparison tables
N total number of laboratories that reported methods and numerical results n number of results except false results and outliers
Mv mean value (with outliers and false results excluded) Med median value (with outliers and false results included)
CV coefficient of variation = relative standard deviation in percentage of the mean, calculated from square root transformed results
F number of false positive or false negative results < number of low outliers
> number of high outliers
total number of results for the parameter remarkably low result
remarkably high result or CV or many deviating results
Explanations to histograms with accepted and deviating results
result without remark false negative result outlier
↓ 34 average without deviating results
* over a bar means that the result is beyond the x-axis limit 601
Contents
Abbreviations and explanations ... 2
Contents ... 3
General information on results evaluation ... 4
Results of the PT round ... 4
- General outcome ... 4
- Coliform bacteria (MF) ... 6
- Suspected thermotolerant coliform bacteria (MF) ... 8
- Escherichia coli (MF) ... 9
- Coliform bacteria and E. coli (rapid method, MPN) ... 12
- Presumptive and confirmed Clostridium perfringens (MF) ... 15
- Moulds and yeasts (MF) ... 17
- Actinomycetes (MF) ... 20
- Culturable microorganisms 22 °C, 3 days ... 21
Outcome of the results and laboratory assessment ... 23
- General information about reported results ... 23
- Base for assessment of the performance ... 23
- Mixed up results and other practical errors ... 23
- Z-scores, box plots and deviating results for each laboratory ... 23
Test material, quality control and processing of data ... 28
- Description of the test material ... 28
- Quality control of the test material ... 29
- Processing of numerical results ... 30
References ... 31
Annex A – All reported results ... 32
Annex B – Z-scores of the results ... 36
General information on results evaluation
The proficiency testing program organised by the National Food Agency is accredited against EN ISO/IEC 17043. This standard prescribes that results should be grouped based on the methods used. Therefore it is mandatory for participants to inform about method data. Method data where differences are present or could be expected are here reported for each parameter.
The method information gathered is sometimes difficult to interpret. Sometimes there is inconsistency between the standard referred to and the information regarding various method details. Results from laboratories with ambiguous details are either excluded or placed in the group "Other/Unknown" in the tables, together with results from methods used only by individual laboratories. Thus, to get an as appropriate evaluation as possible of the results, it is important that correct standards and method details are reported.
Outliers and false results are not included in the calculation of mean value and measure of dispersion for the various method groups. The numbers of low and high outliers, as well as false results, are instead explicitly given in tables together with the group means etc. The mean and measure of dispersion is not shown for groups with 4 or fewer results, more than exceptionally when it is specifically mentioned. However, all results are shown in the method histogram when possible.
The histograms and calculation of outliers are described on page 30 under "Processing of numerical results" with further reference to the scheme protocol [1].
Results of the PT round
General outcome
Test items were sent to 88 laboratories, 36 in Sweden, 49 in other Nordic countries (Faeroe Islands, Greenland and Åland included), 2 more from EU, 1 from the rest of Europe but no one from countries outside Europe. Results were reported from 85 laboratories.
The percentages of false results and outliers are compiled in table 1.
Microorganisms and parameters of analyses are also compiled in table 1. For the MF analyses the parameters suspected coliform bacteria and thermotolerant coliform bacteria could be reported. The results from suspected colonies are only used for interpretations and discussions.
All reported results are compiled in annex A and results for each laboratory are also shown on our website after logging in (www2.slv.se/absint).
Standardized z-scores for all evaluated results are given in annex B and photographs with examples of colony appearance on various media are presented in annex C.
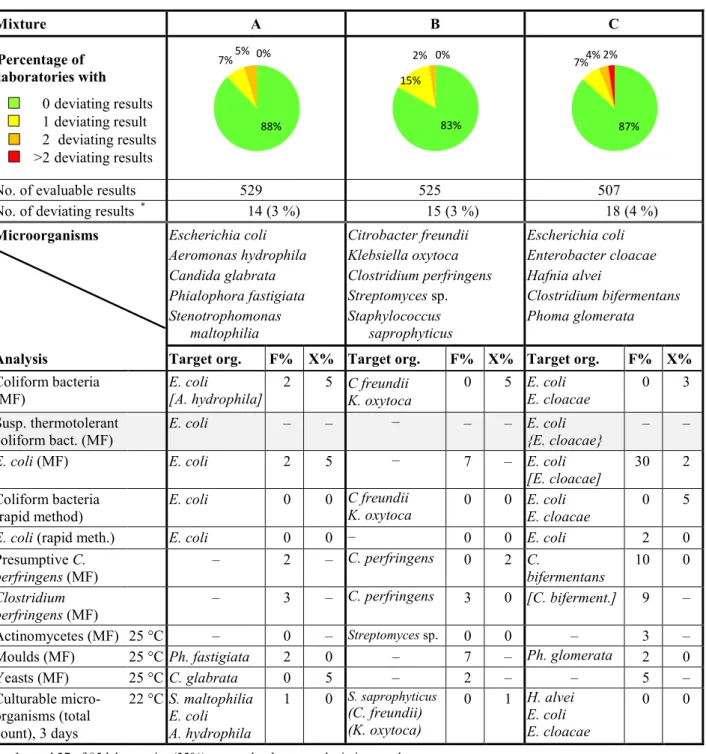
Table 1 Microorganisms in each mixture and percentages of deviating results (F%: false positive
or false negative, X%: outliers); parameters with grey rows are not assessed
Mixture A B C Percentage of laboratories with 0 deviating results 1 deviating result 2 deviating results >2 deviating results
No. of evaluable results 529 525 507
No. of deviating results * 14 (3 %) 15 (3 %) 18 (4 %)
Microorganisms Escherichia coli Aeromonas hydrophila Candida glabrata Phialophora fastigiata Stenotrophomonas maltophilia Citrobacter freundii Klebsiella oxytoca Clostridium perfringens Streptomyces sp. Staphylococcus saprophyticus Escherichia coli Enterobacter cloacae Hafnia alvei Clostridium bifermentans Phoma glomerata
Analysis Target org. F% X% Target org. F% X% Target org. F% X%
Coliform bacteria
(MF) E. coli [A. hydrophila] 2 5 C freundii K. oxytoca 0 5 E. coli E. cloacae 0 3 Susp. thermotolerant
coliform bact. (MF) E. coli – – – – – E. coli {E. cloacae} – –
E. coli (MF) E. coli 2 5 – 7 – E. coli
[E. cloacae] 30 2 Coliform bacteria
(rapid method) E. coli 0 0 C freundii K. oxytoca 0 0 E. coli E. cloacae 0 5
E. coli (rapid meth.) E. coli 0 0 – 0 0 E. coli 2 0
Presumptive C.
perfringens (MF) – 2 – C. perfringens 0 2 C. bifermentans 10 0
Clostridium
perfringens (MF) – 3 – C. perfringens 3 0 [C. biferment.] 9 –
Actinomycetes (MF) 25 °C – 0 – Streptomyces sp. 0 0 – 3 –
Moulds (MF) 25 °C Ph. fastigiata 2 0 – 7 – Ph. glomerata 2 0
Yeasts (MF) 25 °C C. glabrata 0 5 – 2 – – 5 – Culturable micro-organisms (total count), 3 days 22 °C S. maltophilia E. coli A. hydrophila 1 0 S. saprophyticus (C. freundii) (K. oxytoca) 0 1 H. alvei E. coli E. cloacae 0 0
* In total 27 of 85 laboratories (32%) reported at least one deviating result – Organism missing or numerical result irrelevant
( ) The organism contributes with only very few colonies
[ ] The organism may be presumptively false positive on the primary growth medium { } The organism may give different results depending on method or definition used
88% 7% 5% 0% 83% 15% 2% 0% 87% 7% 4% 2%
Coliform bacteria (MF)
The group "LES, wrong standard" that has been present in earlier PT rounds has now been deleted after communication with those laboratories. The results are now allocated to other groups, mainly m-Endo Agar LES (LES). The only laboratory in the group Other/Unknown has used Tryptone Glucose Extract agar (TGE) and incubated 7 days in room temperature.
From the table it is clear that LES is still used by most laboratories. The proportion that used CCA has continued to increase since the standard EN ISO 9308-1 from 2014 was launched. The use of LTTC from the previous edition of that standard simultaneously decreased and is not reported at all here.
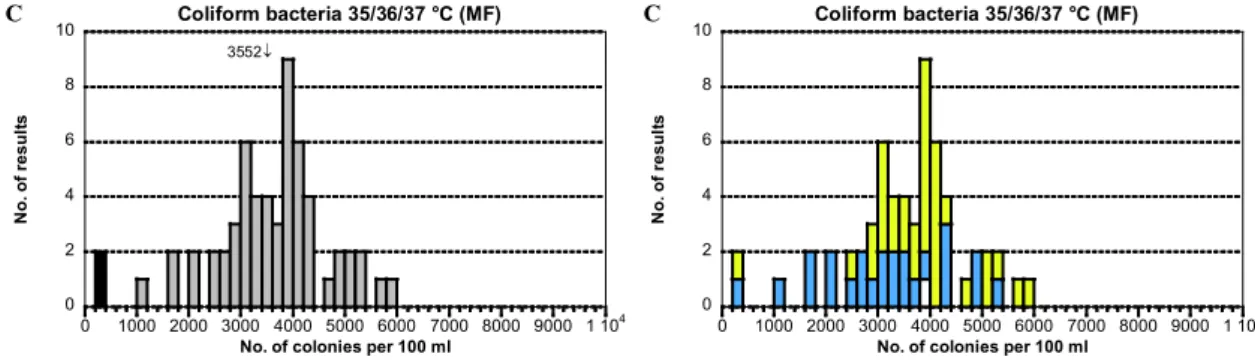
It appears as if LES gave a higher mean result compared to CCA for all samples. In total six different coliform bacteria were present in the samples.
Medium N n Mv CV F < > n Mv CV F < > n Mv CV F < > A B C
Total 61 57 188 12 1 0 3 57 45 13 0 2 1 57 3552 14 0 2 0 m-Endo Agar LES 35 33 192 12 0 0 2 33 49 12 0 1 1 33 3852 10 0 1 0 Chromocult C Agar 25 23 183 11 1 0 1 23 40 13 0 1 0 23 3129 18 0 1 0 Lactose TTC Agar 0 0 – – – – – 0 – – – – – 0 – – – – – Other/Unknown 1 1 – – 0 0 0 1 – – 0 0 0 1 – – 0 0 0 188 ↓ 0 2 4 6 8 10 0 50 100 150 200 250 300 350 400 450 500 Coliform bacteria 35/36/37 °C (MF) Without remark False negative Outlier N o. of re sul ts
No. of colonies per 100 ml
* 0 2 4 6 8 10 0 50 100 150 200 250 300 350 400 450 500 Coliform bacteria 35/36/37 °C (MF)
m-Endo Agar LES Chromocult Coliform Agar Other/Unknown N o. of re sul ts
No. of colonies per 100 ml
* 45 ↓ 0 2 4 6 8 10 0 10 20 30 40 50 60 70 80 90 100 Coliform bacteria 35/36/37 °C (MF) N o. of re sul ts
No. of colonies per 100 ml
* 0 2 4 6 8 10 0 10 20 30 40 50 60 70 80 90 100 Coliform bacteria 35/36/37 °C (MF) N o. of re sul ts
No. of colonies per 100 ml
*
B B
Mixture A
- A strain of E. coli and a strain of A. hydrophila were included. They appeared with for coliform bacteria typical colonies on the MF media at 37 °C, a metallic sheen on LES and blue and dark pinkish red, respectively, on CCA.
- The distribution of the results was good with a small dispersion (CV; see page 30). One false negative result and 3 high outliers were present.
- A. hydrophila was a false negative strain but could be removed after confirmation with oxidase test because it is oxidase positive. At least one of the high outliers is probably caused by A. hydrophila not being removed after confirmation.
Mixture B
- No E. coli but strains of two other coliform bacteria, C. freundii and K. oxytoca, were present. These strains appeared with typical colonies at 37 °C, i.e. with metallic sheen on LES and pink on CCA. There were also some other small pink colonies present on CCA, making it a bit more difficult to see and count the coliform bacteria.
- Despite the background flora, the distribution of the accepted results was fairly good and the dispersion was small. Two low and 2 high outliers were present. - The average result for CCA was considerably lower than for LES according to the
table and can be seen in the histogram as the blue colour in the lower half. Mixture C
- One strain each of E. coli and E. cloacae was included together with a strain of
H. alvei as coliform bacteria. At the National Food Agency (NFA) the two first
mentioned grew with distinct colonies on the MF media at 37 °C, a typical metallic sheen on LES and "pink" on CCA. Thus, the colonies of E. coli were not blue on CCA but pink with a more or less clear hue of violet in the middle. The colonies of H. alvei were red without the metallic sheen on LES and apricot pinkish on CCA. Thus, the colonies should be counted as coliforms on CCA but not on LES. However, the results rather indicate the opposite, as they are lower from CCA in average. Which colonies are included from the two media probably differs among the laboratories.
- Two low outliers were present. The distribution was good and the dispersion low in average. 0 2 4 6 8 10 0 1000 2000 3000 4000 5000 6000 7000 8000 9000 1 104 Coliform bacteria 35/36/37 °C (MF) N o. of re sul ts
No. of colonies per 100 ml
3552↓ 0 2 4 6 8 10 0 1000 2000 3000 4000 5000 6000 7000 8000 9000 1 104 Coliform bacteria 35/36/37 °C (MF) N o. of re sul ts
No. of colonies per 100 ml
Suspected thermotolerant coliform bacteria (MF)
No evaluation in relation to performance is done for what is called suspected (not confirmed) colonies of a parameter. Therefore, no identification of outliers is done. The medians are then more robust than the means and are given in the table and in histograms.
Previously, the two most used growth media have been m-FC and LTTC. The incubation temperature is 44 or 44.5 °C. This time no result for LTTC was reported. Because all old method details were previously cleared from the database, and since it is now not mandatory to report method details for suspected organisms, very few details have been reported. This makes an evaluation meaningless and thus no grouping by method is given. The parameter is not included in the performance
assessment.
Standard, Method Tot A B C
n n Med CV F < > n Med CV F < > n Med CV F < > Total 27 27 150 – – – – 27 0 – – – – 25 2300 – – – –
Med = Median; used here instead of mean value because it describes "suspected" colonies
Mixture A
- One strain of E. coli together with a strain of A. hydrophila appears on media for coliform bacteria at 35-37 °C. Only E. coli grows with, for (suspected) thermotolerant coliform bacteria, typical blue colonies on m-FC agar at 44/44.5 °C 150 (Median) ↓ 0 2 4 6 8 10 0 50 100 150 200 250 300 350 400 450 500
Suspected thermotolerant coliform bacteria 44/44.5 °C (MF)
N o. of re sul ts
No. of colonies per 100 ml
* 2300 (Median) ↓ 0 2 4 6 8 10 0 500 1000 1500 2000 2500 3000 3500 4000 4500 5000
Suspected thermotolerant coliform bacteria 44/44.5 °C (MF)
Zero result N o. of re sul ts
No. of colonies per 100 ml C
- The distribution of the results was good in general. One high result that could be seen as an outlier was present.
Mixture B
- There were no thermotolerant coliform bacteria in the mixture. However, one false positive result was present.
Mixture C
- Three coliform bacteria were included in the mixture, of which the E. coli strain appears as a typical suspected thermotolerant coliform bacterium at 44 °C, meaning blue colonies on m-FC. Also the strain of E. cloacae may grow with small blue colonies on m-FC, which then should be added to the result.
- The analysis was without problem. One zero result was obtained.
- The distribution of the 25 results possibly seems to have two peaks. This may be an effect of that some laboratories have seen and included the colonies of
E. cloacae, while others have not done that.
Escherichia coli (MF)
To identify and quantify E. coli, confirmation is required when colonies are isolated from the primary cultivation media LES, LTTC and m-FC. Depending on the method, test of indole production and/or β-glucuronidase activity from oxidase negative presumptive strains is usually used. A violet to blue colony on CCA indicates positive β-glucuronidase activity and is reckoned as a confirmed E. coli. The primary growth media CCA, LES as well as LTTC are used at 36±2 °C and LTTC or m-FC at 44/44.5 °C. This time there were no results reported for LTTC based on the standard ISO 9308-1:2000 but instead for CCA from ISO 9308-1:2014. The results are separated in groups based on the standard that was used. For the standards from the Nordic countries (SS, SFS, NS) the majority of the results are All results Origin &Standard N n Mv CV F < > A n Mv CV F < > n B Mv CV F < > C Total 62 58 187 12 1 1 2 57 0 – 4 – – 41 2330 14 18 1 0 Colony origin 36 ± 2 °C 45 43 188 12 1 0 1 41 0 – 3 – – 30 2278 15 13 1 0 44/44.5 °C 8 7 172 7 0 0 1 8 0 – 0 – – 6 2503 12 2 0 0 36 ± 2 & 44/44.5 °C 9 8 192 17 0 1 0 8 0 – 1 – – 5 2445 11 3 0 0 Other/Unknown 0 0 – – – – – 0 – – – – – 0 – – – – – Standard ISO 9308-1:2000 0 0 – – – – – 0 – – – – – 0 – – – – – ISO 9308-1:2014 26 25 180 13 1 0 0 24 0 – 1 – – 14 2051 17 10 1 0 SS 028167 15 14 199 7 0 0 1 15 0 – 0 – – 12 2359 12 3 0 0 SFS 4088 16 16 190 16 0 0 0 13 0 – 3 – – 11 2720 12 4 0 0 NS 4792 2 2 – – 0 0 0 2 0 – 0 – – 2 – – 0 0 0 Other/Unknown 3 1 – – 0 1 1 3 0 – 0 – – 2 – – 1 0 0
Results from the analysis of coliform bacteria MF at 36±2 °C
Medium N n Mv CV F < > n Mv CV F < > n Mv CV F < > A B C Total 47# 45 189 12 1 0 1 43 0 – 3 – – 31 2269 15 14 1 0
m-Endo Agar LES 21 20 200 11 0 0 1 19 0 – 2 – – 18 2463 13 3 0 0
Lactose TTC Agar 0 – – – – – – 0 – – – – – 0 – – – – –
Chromocult C Agar 25 24 179 13 1 0 0 23 0 – 1 – – 13 2013 17 10 1 0
Other/Unknown 1 1 – – – – – 1 0 – 0 – – 0 – – 1 0 0
# Compare table above – two more laboratories performed the analysis of E. coli than of coliform bacteria
from 36±2 °C on LES but some are also from 44/44.5 °C on m-FC. The results are additionally grouped based on the reported incubation temperature.
When all results are compared for mixture A, in principle no differences can be seen between the different standards or incubation temperatures, possibly somewhat lower at 44/44.5 °C. However, for mixture C there seems to be differences between the standards. The methods both with CCA and LES have delivered several zero results, the most with CCA; see discussion below about mixture C. Even the average for accepted results is somewhat lower for CCA and the dispersion (CV) is larger.
These differences for all results of mixture C are seen also when only the results from 36±2 °C are compared. Similar differences between LES and CCA have been seen also in previous rounds and need to be further considered with different bacterial strains. 187 ↓ 0 2 4 6 8 10 0 50 100 150 200 250 300 350 400 450 500 Escherichia coli (MF) N o. of re sul ts
No. of colonies per 100 ml
* 0 2 4 6 8 10 0 50 100 150 200 250 300 350 400 450 500 Escherichia coli (MF) ISO 9308-1:2014 SS 028167 SFS 4088 NS 4792 Other/Unknown N o. of re sul ts
No. of colonies per 100 ml
* 2330 ↓ 0 4 8 12 16 20 0 500 1000 1500 2000 2500 3000 3500 4000 4500 5000 Escherichia coli (MF) Zero result N o. of re sul ts
No. of colonies per 100 ml
0 4 8 12 16 20 0 500 1000 1500 2000 2500 3000 3500 4000 4500 5000 Escherichia coli (MF) N o. of re sul ts
No. of colonies per 100 ml
B B
C C
Mixture A
- One typical strain of E. coli was present together with another coliform-like bacterium, A. hydrophila. The latter is oxidase positive, indole negative, and has no activity of β-glucuronidase and does not grow at 44° C. Thus, it cannot be taken for E. coli after confirmation.
- The distribution of the results was good and the dispersion small. One false negative result as well as 1 low outlier and 2 high outliers were present.
Mixture B
- No E. coli was included but two other coliform bacteria, out of which one was a strain of K. oxytoca. That strain is able to grow in broth at 44 °C and is indole positive. That makes a false positive result possible when colonies are picked from plates incubated at 36±2 °C and the indole test alone is used as criterion for
E. coli.
- Four false positive results were reported. Mixture C
- A strain of E. coli with weak β-glucuronidase activity was included together with two other coliform bacteria, E. cloacae and H. alvei. Sometimes small blue colonies of E. cloacae can appear on m-FC at 44 °C. The colony appearance for
E. coli is typical on LES and m-FC that are based on lactose fermentation.
However, on the chromogenic enzyme based medium CCA the colony colour is atypical for E. coli. The colonies are there pinkish with a more or less evident violet hue in the middle. It seems that these colonies are often interpreted as coming from another coliform bacterium than E. coli, leading to a zero result for
E. coli. Confirmation for E. coli is not considered necessary on CCA and is
therefore normally not used. However, confirmation is necessary to discern E. coli from other coliforms for colonies picked from LES and m-FC.
- Eighteen zero results were reported together with one low outlier. The distribution was otherwise in general fairly good with a small dispersion (CV = 18 %). The outlier could be caused by a missed calculation of the result for the volume 100 ml. In the histogram the average is given for the results except the zero results and the only outlier.
- Ten of the 18 zero results were obtained by using CCA, all but one of the other by using the Nordic standards based on lactose fermentation and confirmation.
- The strain of E. coli is producing gas in lactose broth at 44 °C, is positive when testing for indole production but show a weak β-glucuronidase activity. That the outcome is interpreted as negative is probably seen when β-glucuronidase activity is the only decisive criterion for E.coli. This is applicable to confirmation with MUG reagent in broth as well as to the use of enzyme based chromogenic media like CCA.
- Zero results obtained due to an interpretation of the β-glucuronidase activity as negative is acceptable even though they are indicated as false negative in the table and Annex A. However, zero results by other reasons should be seen as real false negative ones.
Coliform bacteria & E. coli (rapid methods, MPN)
The rapid method used for both these parameters was exclusively Colilert®
Quanti-Tray® from the manufacturer IDEXX Inc. with incubation at 35, 36 or 37 °C. Out of
the about 60 laboratories that reported Colilert some used trays with 51 wells, while others used trays with 97 wells (a few of which, probably incorrectly, have reported 96 wells). The laboratories often analysed both diluted and undiluted samples. Yellow wells (ONPG positive; β-galactosidase activity shown) will be interpreted as coliform bacteria and yellow wells also exhibiting fluorescence (MUG positive; β-glucuronidase activity shown) will be interpreted as E. coli.
The differences were small when the numbers of wells on the trays as well as different incubation times were compared. Therefore, such grouping is not shown. A difference based on the maximum incubation length is often small. However, for coliform bacteria in mixture C there might be one; the maximum 22 hours gave somewhat higher average results than the maximum 20 hours. Tendencies to similar behaviour are seen also for coliform bacteria and E. coli in mixture A. There are only few results for the group "24 hours" but the average is specified as it is low. In one case the method specified is Colilert 24. Due to the few results it is impossible to make any conclusions.
There is nothing in the evaluation that suggests that there was any problem with interpretation of the results.
Coliform bacteria, Rapid method with MPN
Incubation time N n Mv CV F < > n Mv CV F < > n Mv CV F < > A B C Total, Rapid meth. 64 64 204 13 0 0 0 64 48 10 0 0 0 55 3876 14 0 3 0
(18 –) 20 hours 36 36 202 14 0 0 0 36 47 9 0 0 0 32 3715 14 0 1 0 (18 –) 22 hours 24 24 208 10 0 0 0 24 50 12 0 0 0 20 4177 13 0 2 0
21 – 24 hours 1 1 – – 0 0 0 1 – – 0 0 0 1 – – 0 0 0
24 hours* 3 3 177 – 0 0 0 3 49 – 0 0 0 2 3101 – 0 0 0
E. coli, Rapid method with MPN
Incubation time N n Mv CV F < > n Mv CV F < > n Mv CV F < > A B C Total, Rapid meth. 64 64 204 13 0 0 0 64 0 – 0 – – 61 0 – 1 – –
(18 –) 20 hours 37 37 203 14 0 0 0 37 0 – 0 – – 36 0 – 0 – –
(18 –) 22 hours 23 23 208 12 0 0 0 23 0 – 0 – – 21 0 – 1 – –
21 – 24 hours 1 1 – – 0 0 0 1 0 – 0 – – 1 0 – 0 – –
24 hours* 3 3 177 – 0 0 0 3 0 – 0 – – 3 0 – 0 – –
Mixture A
- The strain of E. coli is the only coliform bacterium that grows in the medium and has the enzyme β-galactosidase. Therefore, it is detected as coliform bacterium by methods based on this enzyme (ONPG positive) e.g. Colilert®-18/24 Quanti-Tray® where ONPG is a substrate.
- The strain of E. coli also has the enzyme β-glucuronidase and is detected as
E. coli. 204 ↓ 0 3 6 9 12 15 0 50 100 150 200 250 300 350 400 450 500
Coliform bacteria (rapid method, MPN)
N o. of re sul ts MPN-index per 100 ml 0 3 6 9 12 15 0 50 100 150 200 250 300 350 400 450 500
Coliform bacteria (rapid method, MPN)
(18 -) 20 hours (18 -) 22 hours 21 - 24 hours 24 hours N o. of re sul ts MPN-index per 100 ml 204 ↓ 0 3 6 9 12 15 0 50 100 150 200 250 300 350 400 450 500
Escherichia coli (rapid method, MPN)
N o. of re sul ts MPN-index per 100 ml 0 3 6 9 12 15 0 50 100 150 200 250 300 350 400 450 500
Escherichia coli (rapid method, MPN)
N o. of re sul ts MPN-index per 100 ml 48 ↓ 0 3 6 9 12 15 0 10 20 30 40 50 60 70 80 90 100
Coliform bacteria (rapid method, MPN)
N o. of re sul ts MPN-index per 100 ml 0 3 6 9 12 15 0 10 20 30 40 50 60 70 80 90 100
Coliform bacteria (rapid method, MPN)
N o. of re sul ts MPN-index per 100 ml 3876 ↓ 0 3 6 9 12 15 0 1000 2000 3000 4000 5000 6000 7000 8000 9000 1 104
Coliform bacteria (rapid method, MPN)
N o. of re sul ts MPN-index per 100 ml 0 3 6 9 12 15 0 1000 2000 3000 4000 5000 6000 7000 8000 9000 1 104
Coliform bacteria (rapid method, MPN)
N o. of re sul ts MPN-index per 100 ml A C A C A A B B
- The distributions of the results were good and the dispersions (CV) were small in both cases. No outliers or false results were obtained.
- The averages with this rapid method were, as is often the case, somewhat higher than with the MF methods both for coliform bacteria and E. coli (compare p. 6). Mixture B
- Two different coliform bacteria, C. freundii and K. oxytoca, but no E. coli was included.
- The distributions of the results were good and without any peculiarities. The dispersion was small, close to very small, and no deviating results were obtained. - The average for coliform bacteria was here as in mixture A higher than with the
MF methods (compare p. 6), but only a little. Mixture C
- The mixture contained the three coliform bacteria E. coli, E. cloacae and H. alvei. All of them possess β-galactosidase (ONPG positive) and are detected as coliform bacteria. However, that activity is considerably lower for H. alvei than for the other two bacteria. To get a positive response for this strain, the trays need to be incubated for 22 hours.
- The distribution of the results for coliform bacteria was in principle good but with a strange peak in its lowest range of the accepted results. That peak is a probable outcome of the interpretation of H. alvei as negative due to a too short incubation. The dispersion was small even with this extra peak. Three low outliers were present.
- The strain of E. coli possesses β-glucuronidase but the activity is so low that the results are usually interpreted as negative. One non-zero result was present but is here in the light of all other results evaluated as false positive.
- The average result for coliform bacteria was also here only marginally higher than it was with the MF methods (compare p. 6).
Presumptive and confirmed Clostridium perfringens (MF)
The analysis of Clostridium perfringens has been performed differently in different countries and laboratories. The parameter to be analysed is the sum of spores and vegetative cells of C. perfringens. In Sweden presumptive C. perfringens are accepted, which is why that parameter is presented separately.
No international standard was stated as reference method in the European Drinking Water Directive from 1998 [4]. A specific method was instead explicitly included into the directive; the use of m-CP Agar incubated at 44 °C. The method includes a confirmation step with ammonia vapour, where a red coloration of colonies indicates
C. perfringens.
Due to the hesitation in many countries to use this method the use of a standard still under process (ISO/CD 6461-2:2002-12-20, CD = Committee Draft), based on TSC agar (TSC), was accepted as an alternative by the responsible group under the EU Commission until a finished standard was available. Adjustments in the draft approved during the standardization process have been included in the instructions for proficiency testing rounds, e.g. colour on colonies to be counted.
The standard ISO 14189 was finished in November 2013 and the identical EN ISO 14189 and its national editions were finished in 2016. The standard is basically with TSC equivalent to the CD version from 2002 after adjustments, but has a much more simplified confirmation step. In the new standard, isolated colonies are only tested for activity of the enzyme acid phosphatase. The new standard was in October 2015 included in the revised annexes to the directive text and should have been taken into use no later than in October 2017 within EU, after being implemented in the national legislations. The CD version as well as m-CP agar is invalid for use in official drinking water monitoring after that date.
Fourteen out of 58 laboratories have still used one of the older methods that are now replaced by (EN) ISO 14189. Mean values and dispersion are given also for m-CP agar, despite the few results, in order to facilitate comparison both here and with previous PT rounds.
For mixture B m-CP agar gave lower recovery, like in previous rounds, compared to TSC (which is the medium in the two other method references) both for presumptive
C. perfringens and for C. perfringens. For presumptive C. perfringens in mixture C
only 1 laboratory has used m-CP agar. The histograms show clearly that the results of m-CP agar are mainly in the lower end of the results. Lower results with m-CP agar cannot be taken to be generally valid but have been seen before when the strains of C. bifermentans and C. perfringens used here have been included.
For the two methods with TSC no difference can be seen in mixture B. In mixture C, however, the older CD version of the standard seemed to give much lower results compared to the final version of the standard.
Mixture A
- No presumptive C. perfringens was included. Yet, 1 false positive result each was present for presumptive C. perfringens and C. perfringens.
Presumptive Clostridium perfringens MF Standard/Method N # A B C n Mv CV F < > n Mv CV F < > n Mv CV F < > Total 58 44 0 – 1 – – 44 40 14 0 0 1 38 1916 55 4 0 0 (EN) ISO 14189 44 33 0 – 1 – – 33 42 13 0 0 1 29 2295 51 4 0 0 ISO/CD 6461-2:2002 10 8 0 – 0 – – 8 39 11 0 0 0 8 1110 56 0 0 0 m-CP agar, EU-direct. 4 3 0 – 0 – – 3 27* – 0 0 0 1 62* – 0 0 0 Other/Unknown 0 0 – – – – – 0 – – – – – 0 – – – – – Clostridium perfringens MF Standard/Method N # A B C n Mv CV F < > n Mv CV F < > n Mv CV F < > Total 58 36 0 – 1 – – 35 38 14 1 0 0 31 0 – 3 – – (EN) ISO 14189 44 25 0 – 1 – – 24 39 13 1 0 0 22 0 – 2 – – ISO/CD 6461-2:2002 10 7 0 – 0 – – 7 40 14 0 0 0 6 0 – 1 – – m-CP agar, EU-direct. 4 4 0 – 0 – – 4 30* – 0 0 0 3 0 – 0 – – Other/Unknown 0 0 – – – – – 0 – – – – – 0 – – – – –
* Mean values are given for comparison despite few results
# The sum of laboratories that have reported results for presumptive C. perfringens, and/or C. perfringens
40 ↓ 0 2 4 6 8 10 0 10 20 30 40 50 60 70 80 90 100
Presumptive Clostridium perfringens (MF)
N o. of re sul ts
No. of colonies per 100 ml
* 0 2 4 6 8 10 0 10 20 30 40 50 60 70 80 90 100
Presumptive Clostridium perfringens (MF)
(EN) ISO 14189 ISO/CD 6461-2:2002 m-CP agar, EU directive N o. of re sul ts
No. of colonies per 100 ml
* 38 ↓ 0 2 4 6 8 10 0 10 20 30 40 50 60 70 80 90 100 Clostridium perfringens (MF) N o. of re sul ts
No. of colonies per 100 ml
0 2 4 6 8 10 0 10 20 30 40 50 60 70 80 90 100 Clostridium perfringens (MF) N o. of re sul ts
No. of colonies per 100 ml
1916 ↓ 0 2 4 6 8 10 0 1000 2000 3000 4000 5000 6000 7000 8000 9000 1 104
Presumptive Clostridium perfringens (MF)
N o. of re sul ts
No. of colonies per 100 ml
* 0 2 4 6 8 10 0 1000 2000 3000 4000 5000 6000 7000 8000 9000 1 104
Presumptive Clostridium perfringens (MF)
N o. of re sul ts
No. of colonies per 100 ml
* B B C B B C
Mixture B
- A strain of C. perfringens was included. The colour of the colonies on TSC could vary from pale grey-brown to completely black depending on the condition and reduction potential of the medium.
- One high outlier was present in the presumptive test and 1 false negative result was present for C. perfringens.
- The distribution of the results was unusually good for both presumptive and confirmed C. perfringens, without the earlier occurring tail of low results. The reason is probably that it this time was only very few results from m-CP agar that earlier have given lower results than TSC. The dispersion (CV) was this time not higher than for other parameters, but was instead small (see p. 30).
Mixture C
- No C. perfringens was included but a strain of C. bifermentans. The strain appeared on TSC with small, black to almost transparent presumptive colonies. Confirmation reveals that they are not from C. perfringens.
- There is no tendency to Poisson distribution of the results as there are many low values. The dispersion (CV) was very large implying that no outliers could be identified. Four zero results were obtained, out of which one was from m-CP agar. - In the analyses of C. perfringens 3 false positive results were present.
Moulds and yeasts (MF)
Out of the 43 laboratories that analysed moulds and yeasts, 32 reported that they used the Swedish standard SS 028192. Besides Sweden it is used in Denmark and also in Finland and Norway under their own national designations SFS 5507 and NS 4716, respectively.
Various names, some appropriate and other probably inappropriate, were reported for the media linked to the use of SS 028192. These are "Cooke Rose Bengal Agar base", "Rose Bengal Agar base", "Rose Bengal Agar", "Rose Bengal Chloramphenicol Agar" (RBC) and "Dichloran Rose Bengal Chloramphenicol Agar" (DRBC). According to the standard, dichloran should not be an ingredient (and thus DRBC should not be used) but instead Rose Bengal and the two stronger inhibitory substances chlortetracycline and chloramphenicol. Both of them are at least used by 17 of the 24 Swedish laboratories. Here is shown what the laboratories have really stated, and a separation is made for those that have used any form of Rose Bengal Agar (RBC Agar) and those stating DRBC in conjunction with SS 028192 or SFS 5507 – or in one case "Standard methods [5] – (DRBC Water).
Two Norwegian laboratories instead used NMKL 98:2005, modified together with DRBC. This comprises the group DRBC Food in the tables. Four Finnish laboratories used "Malt Extract Agar" (ME); one in conjunction with NMKL 98:2005 and the remaining three with other non-water methods. Also a Swedish laboratory has stated ME but in conjunction with SS 028192. These 5 laboratories are placed in the group ME. Three Finnish laboratories using "Oxytetracycline
Glucose Extract Agar" based on other methods/standards are placed in the group OGYE. In several of these groups there are so few results that it is not meaningful to discuss possible differences. But the mean values are still given for comparison. RBC has given lowest results for moulds and yeasts in mixture A. However, this is not true for moulds in mixture C. In all five cases a selective substance (dichloran, chloramphenicol or streptomycin) has been added to ME, making it selective. This can explain while the ME results are not higher than for the other media.
Moulds MF Standard/Method N n Mv CV F < > n Mv CV F < > n Mv CV F < > A B C Total 43 42 220 15 1 0 0 40 0 – 3 – – 41 288 9 1 0 0 RBC 25 25 209 18 0 0 0 23 0 – 2 – – 25 290 10 0 0 0 DRBC Water 8 8 237 10 0 0 0 8 0 – 0 – – 7 305 5 0 0 0 ME 5 4 236* – 1 0 0 4 0 – 1 – – 4 252* – 1 0 0 DRBC Food 2 2 244* – 0 0 0 2 0 – 0 – – 2 254* – 0 0 0 OGYE 3 3 225* – 0 0 0 3 – – 0 – – 3 306* – 0 0 0 Yeasts MF Standard/Method N n Mv CV F < > n Mv CV F < > n Mv CV F < > A B C Total 42 40 260 11 0 0 2 41 0 – 1 – – 39 0 – 2 – – RBC 25 25 253 10 0 0 0 25 0 – 0 – – 24 0 – 1 – – DRBC A Water 8 8 271 12 0 0 0 8 0 – 0 – – 7 0 – 0 – – ME 5 4 273* – 0 0 1 4 0 – 1 – – 4 0 – 1 – – DRBC Food 1 1 280* – 0 0 0 1 0 – 0 – – 1 0 – 0 – – OGYE 3 2 270* – 0 0 1 0 0 – 0 – – 3 0 – 0 – –
* Mean values are given for comparison despite few results
220 ↓ 0 2 4 6 8 10 0 50 100 150 200 250 300 350 400 450 500 Moulds 25 °C (MF) N o. of re sul ts
No. of colonies per 100 ml
0 2 4 6 8 10 0 50 100 150 200 250 300 350 400 450 500 Moulds 25 °C (MF) RBC Agar DRBC Agar, "Water" ME Agar DRBC Agar, "Food" OGYE Agar N o. of re sul ts
No. of colonies per 100 ml
260 ↓ 0 2 4 6 8 10 0 50 100 150 200 250 300 350 400 450 500 Yeasts 25 °C (MF) N o. of re sul ts
No. of colonies per 100 ml
* 0 2 4 6 8 10 0 50 100 150 200 250 300 350 400 450 500 Yeasts 25 °C (MF) N o. of re sul ts
No. of colonies per 100 ml
*
A
A
A
Mixture A
- The mould Ph. fastigiata and the yeast C. glabrata were included in approximately the same concentrations. No apparent problem could be seen and the distributions of the results were good with small dispersion (CV) for both parameters.
- One false negative result was present for the moulds. - Two high outliers were present for the yeasts.
Mixture B
- Neither moulds nor yeasts were included. Yet, 3 false positive results were reported for moulds and 1 false positive result for yeasts. In two cases where only 1 and 2 mould colonies were found they can be contamination from the laboratory air. Such results should not be seen as false positive ones.
Mixture C
- No yeasts but the mould Ph. glomerata were included. The distribution of the moulds results was relatively good with a small dispersion.
- One false negative mould results was present as well as 2 false positive yeast results.
- The laboratory with the false negative mould result for mixture C reported the false negative result also for mixture A, and in parallel also false positive results for yeast in both mixture B and C. Further, the yeast result for mixture A was an outlier. This laboratory, as the only one, has stated the use of ME with only dichloran added as selective agent. However, this is probably not the cause. Instead the results indicate that that laboratory is unpractised in performing analyses of fungi in water.
288 ↓ 0 2 4 6 8 10 0 50 100 150 200 250 300 350 400 450 500 Moulds 25 °C (MF) N o. of re sul ts
No. of colonies per 100 ml
0 2 4 6 8 10 0 50 100 150 200 250 300 350 400 450 500 Moulds 25 °C (MF) N o. of re sul ts
No. of colonies per 100 ml
Actinomycetes (MF)
The analysis of actinomycetes is included because it is a prescribed method for drinking water monitoring according to the Swedish regulations. Therefore, it is mainly Swedish laboratories that performed the analysis according to the Swedish standard for actinomycetes in water, SS 028212 (1994). Ten Finnish laboratories that have performed the analysis based on other methods are placed in the group Other. Eight of these have stated that they used natamycin as the selective substance instead of cycloheximide. The remaining 2 laboratories also did not use cycloheximide, but did not specify beyond "Other" what they used. Probably they have used natamycin as well. The base agar medium varies also within the group Other but is in all cases different from Actinomycete Isolation Agar (ACTA) that is the base medium in the Swedish standard.
The averages of the two groups in mixture B is approximately equal but the dispersion (CV) is twice as large for the group Other compared to the group ACTA. This pertains to the strain and sample included here but cannot be considered to be generally valid. The large dispersion for the group Other is probably caused by variations in the methods used.
All results Medium/Standard N n Mv CV F < > n Mv CV F < > n Mv CV F < > A B C Total 34 34 0 – 0 – – 33 29 13 1 0 0 32 0 – 1 – – ACTA (SS 028212) 24 24 0 – 0 – – 23 29 10 1 0 0 23 0 – 1 – – Other 10 10 0 – 0 – – 10 27 20 0 0 0 9 0 – 0 – – Mixture A and C
- These mixtures contained no actinomycetes. One false positive result was reported for mixture C.
Mixtures B
- One actinomycete within the group Streptomyces sp. was included. The distribution of the results was good and the average dispersion small.
- One false negative result was present. 29 ↓ 0 2 4 6 8 10 0 10 20 30 40 50 60 70 80 90 100 Actinomycetes 25 °C (MF) N o. of re sul ts
No. of colonies per 100 ml
0 2 4 6 8 10 0 10 20 30 40 50 60 70 80 90 100 Actinomycetes 25 °C (MF) SS 028212 (cycloheximid) Other, usually with natamycin
N o. of re sul ts
No. of colonies per 100 ml
Culturable microorganisms 22 °C, 3 days
Seventy-six of the 78 laboratories performing the analysis reported EN ISO 6222:1999 as method, which prescribes the use of Yeast extract Agar. Four laboratories used Plate Count Agar instead and one used R2A agar, but they have simultaneously stated the use of EN ISO 6222:1999. One laboratory used Yeast extract Agar in conjunction with "Standard methods" [5] and stated spread plating instead of pour plating. The majority of the laboratories have claimed counting both bacteria colonies as well as fungal colonies while nine report that they don't count fungi. Three others state that they include yeasts when counting but not moulds. Since all except two laboratories refer to EN ISO 6222:1999, differences among method variants are relevant to discuss only for these. Results are shown for culture media and magnification of reading.
It is difficult to find any consistent method difference. In mixtures A and B, Plate Count Agar seems this time to give lower result than Yeast extract Agar instead of as sometimes higher. However, only 4 results make the difference uncertain. No general difference was seen in relation to magnification. There might be a tendency to results increasing with magnification in mixture C but it is weak. In this round the culturable microorganisms were easy to count in all samples and there were no small colonies present that could be difficult to distinguish. This could explain why there were no clear differences.
The distributions were good for all mixtures and the dispersions were small to very small (see p. 30). Only 2 deviating results were reported.
Group of results N n Mv CV F < > n Mv CV F < > n Mv CV F < > A B C Total, all results 78 76 56 12 1 0 0 75 57 8 0 1 0 76 45 10 0 0 0
EN ISO 6222 76 74 56 12 1 0 0 74 57 8 0 0 0 74 45 10 0 0 0
Medium
Yeast extract Agar 74 70 56 12 1 0 0 70 57 8 0 0 0 69 45 11 0 0 0 Plate Count Agar 5 4 47* – 0 0 0 4 49* – 0 0 0 4 46* – 0 0 0
Other/Unknown 0 0 – – – – – 0 – – – – – 1 – – 0 0 0 Magnification None 18 18 57 12 0 0 0 18 60 7 0 0 0 18 42 8 0 0 0 1,1–4,9× 29 27 53 15 1 0 0 27 54 8 0 0 0 28 45 12 0 0 0 5–11,9× 29 29 58 8 0 0 0 29 57 8 0 0 0 28 48 9 0 0 0 > 12× 0 0 – – – – – 0 – – – – – 0 – – – – – Other method 2 2 – – 0 0 0 1 – – 0 1 0 2 – – 0 0 0 * Mean values are given for comparison despite few results
Mixture A
- It is mainly colonies of S. maltophilia that are visible but the other bacteria and the yeasts may also appear with individual colonies.
Mixture B
- The colonies mainly consist of the strain of S. saprophyticus but individual colonies of the coliform bacteria and the actinomycete may also appear.
- The distribution of the results was good with only 1 low outlier. Mixture C
- The colonies that appear on the plates are from the three coliform bacteria E. coli,
E. cloacae and H. alvei in approximately the same numbers of each.
- The distribution of the results was generally good and without deviating results. 56 ↓ 0 3 6 9 12 15 0 15 30 45 60 75 90 105 120 135 150
Culturable microorganisms 22±2 °C, 3 days
N o. of re sul ts
No. of colonies per ml
0 3 6 9 12 15 0 15 30 45 60 75 90 105 120 135 150
Culturable microorganisms 22±2 °C, 3 days
No magnification (1×) Magnification 1,1-4,9× Magnification 5-11,9× Other method, no magnif
N o. of re sul ts
No. of colonies per ml
57 ↓ 0 3 6 9 12 15 0 15 30 45 60 75 90 105 120 135 150
Culturable microorganisms 22±2 °C, 3 days
N o. of re sul ts
No. of colonies per ml
0 3 6 9 12 15 0 15 30 45 60 75 90 105 120 135 150
Culturable microorganisms 22±2 °C, 3 days
N o. of re sul ts
No. of colonies per ml
45 ↓ 0 3 6 9 12 15 0 10 20 30 40 50 60 70 80 90 100
Culturable microorganisms 22±2 °C, 3 days
N o. of re sul ts
No. of colonies per ml
0 3 6 9 12 15 0 10 20 30 40 50 60 70 80 90 100
Culturable microorganisms 22±2 °C, 3 days
N o. of re sul ts
No. of colonies per ml A B C A B C
Outcome of the results and laboratory assessment
General information about reported results
The distributions of results for the respective analysis are shown in histograms. A box plot (see below) gives a summarizing image of all the results of a laboratory, except false results. The number of false results and outliers are given below the plot for each laboratory. These values are highlighted with bold text on yellow background in annex A. The limit values for lowest and highest accepted results are given for each analyse in the summarizing lines at the end of annex A, together with the measurement uncertainty of the mean.
Base for assessment of the performance
The laboratories are not grouped or ranked in relation to their performances. The performance can broadly be assessed by the numbers of false results and outliers given beneath the box plots.
Generally, the laboratories that did not report their results in due time, have to compare their results themselves with all other laboratory's by looking in tables, figures and annex A.
Mixed up results and other practical errors
A number of laboratories have several deviating results. When whole samples seem to have been mixed up, the corresponding sample numbers are hatched in annex A. This time no laboratory seems to have mixed up vials. One laboratory seems to have mixed up two results for presumptive C. perfringens. Four laboratories seem to have performed incorrect calculations from their colony readings to the final concentrations.
Z-scores, box plots and deviating results for each laboratory
The square root transformed results of the laboratories are calculated to standard scores, z-scores, to be comparable between analyses. They are reported in annex B but not further evaluated here. They are given explicitly to facilitate the follow-up process for laboratories using z-scores in control charts etc. For interpretation and calculation of z-scores, see the scheme protocol [1] and the explanation to annex A. The z-scores are the base for the box plots. The range of the z-scores for each laboratory is shown by a rectangle (box) and lines and/or circles above and beneath the box. The smaller the range from lowest to highest value is in the plot and the more centred around zero the values are, the better is the agreement between the laboratory's results and the means from all laboratories.
Box plots and numbers of deviating results for each participating laboratory
- z-scores are calculated from the formula z = (x – mv) / s (see annex A).
- A correct result "zero" will get z = 0 when there is no target organism present. - False results do not generate z-scores and are not included in ‘No. of results’. - The outliers are included in the plots after recalculation to standardised values
with the same standard deviation (s) as the rest of the results.
- z-scores > +4 and < −4 have in the plots been set to +4 and −4, respectively. - The numbers of false positives and false negatives are given in the table under the
plots together with the numbers of outliers.
- The horizontal red line in each box indicates the median for the laboratory.
- The box includes 25% of the results above and below the median. The lines
protruding from the box and/or the circles embrace the remaining 50% of the results, false results excluded.
- A circle is shown when a result is to a certain degree deviating* from the rest. - The background is divided into coloured fields to simplify localization of the
laboratory results.
_________________
* < [smallest value of the box - 1.5 × (largest value of the box - smallest value of the box)] or > [largest value of the box + 1.5 × (largest value of the box - smallest value of the box)]
z-scor e Lab no. 1131 1237 1545 1594 1611 1753 1868 1970 2050 2386 2637 2704 2745 2944 3055 3076 3145 3155 3159 3162 No. of results 12 15 30 24 15 27 27 21 27 21 9 20 8 12 3 3 6 14 12 21 False positive - 1 - - - 1 - - - -False negative - 1 - - - 1 - - - -Low outliers - - - -High outliers - - - 1 - 2 - - - -False negative ? - - - --4 -2 0 2 4
z-scor e Lab no. 3164 3305 3339 3415 3730 3868 3883 4015 4288 4319 4339 4343 4356 4633 4723 4889 4980 5018 5120 5128 No. of results 19 26 - 26 3 19 27 21 - - 29 21 17 24 21 16 15 29 26 14 False positive 2 - - - 3 - - - 1 False negative 2 1 - - - 1 - - - 1 - - - -Low outliers 1 - - - 1 - - - -High outliers 1 - - - 2 - - - -False negative ? - - - -RSZ 0,02 -1,34 - 0,23 -0,03 -0,06 2,3 1,61 - - 1,78 -1,73 -0,79 -0,44 1,31 1,24 -0,15 -0,25 -0,83 0,1 SD 1,86 0,98 - 0,71 0,46 0,86 1,15 0,64 - - 0,87 0,83 1,05 0,88 1,24 0,73 1,18 0,47 0,72 0,69 z-scor e Lab no. 5201 5220 5352 5447 5553 5858 5950 6175 6180 6182 6233 6253 6448 6456 6563 6686 7248 7442 7688 7728 No. of results 6 10 21 24 7 13 27 8 - 7 15 15 8 15 26 11 29 24 30 9 False positive - - - 1 - 1 1 - -False negative - - - - 2 - - - 1 - 1 - -Low outliers - - - - 3 - 1 1 - - - 1 - - -High outliers - - - 1 - - - - 1 - - -False negative ? - - - --4 -2 0 2 4 -4 -2 0 2 4
z-scor e Lab no. 7876 7930 7962 7968 8019 8068 8252 8260 8329 8380 8435 8569 8626 8628 8663 8742 8751 8766 8840 8862 No. of results 27 27 20 27 23 23 9 15 26 14 11 19 9 17 21 9 9 27 - 29 False positive - - - 1 - - 1 1 - 1 - - - -False negative - - - -Low outliers - - - 2 - - - -High outliers - - - 1 - - - -False negative ? - - - -RSZ 1,12 0,82 0,92 1 0,65 -3,04 0,26 0 0,15 2,71 -0,24 1,16 -4,37 -0,05 1,36 -0,57 -1,95 0,5 - -0,15 SD 0,46 0,69 0,83 0,55 0,79 1,01 1,27 0,25 0,83 0,83 1,47 0,76 1,85 0,56 0,92 0,77 1,09 0,52 - 0,61 z-scor e Lab no. 8898 8955 8998 9436 9524 9736 9899 9903 No. of results 27 26 - 27 21 19 27 21 False positive - 1 - - - 1 - -False negative - - - 1 - -Low outliers - - - -High outliers - - - -False negative ? - - - --4 -2 0 2 4 -4 -2 0 2 4
Test material, quality controls and processing of data
Description of the test material
This round comprised three test items with different microorganism mixtures. The test material was manufactured and freeze-dried in portions of 0.5 ml in small vials, according to the description by Peterz and Steneryd [2]. The simulated water samples were prepared by dissolving the content of the vials in 800 ml of sterile diluent. The composition and approximate concentrations in each mixture obtained at the National Food Agency are listed in table 2. The participating laboratories were assigned to perform the analyses according to the methods routinely used by them. The test material is primarily suited to the EN ISO methods for analyses of drinking water referred to in the European Drinking water directive [4] and its updates [6]. Alternative methods and other standards may usually be used without any problem. Table 2 Microorganisms present in the mixtures
Mixture 1 Microorganisms Strain collection no. cfu/100 ml 2
SLV (own) Reference 3
A Escherichia coli 165 CCUG 43600 220
Aeromonas hydrophila 533 CCUG 48892 280
Candida glabrata 052 CBS typed 270
Phialophora fastigiata 504 CBS typed 220
Stenotrophomonas
maltophilia 041 – 71
*
B Citrobacter freundii 091 CCUG 43597 34
Klebsiella oxytoca 553 From water 29
Clostridium perfringens 442 CCUG 43593 38
Streptomyces sp. 548 From water 34
Staphylococcus
saprophyticus 013 CCUG 45100 57
*
C Escherichia coli 295 From water 2100
Enterobacter cloacae 187 CCUG 43599 1700
Hafnia alvei 015 CCUG 45642 1300
Clostridium bifermentans 009 CCUG 43592 320
Phoma glomerata 543 CBS 119226 290
1 The links between the mixtures and the randomised sample numbers are shown in annex A; the analyses were performed at the times given in note 1 of table 3
2 cfu = colony forming units; * indicates cfu per ml
3 Origin or typing collection no.; ATCC: American Type Culture Collection; CCUG: Culture Collection University of Gothenburg, Sweden; CBS: Centraalbureau vor Schimmelcultures, Utrecht, Holland; – or "From water" indicate a strain from our own culture collection
Quality control of the test material
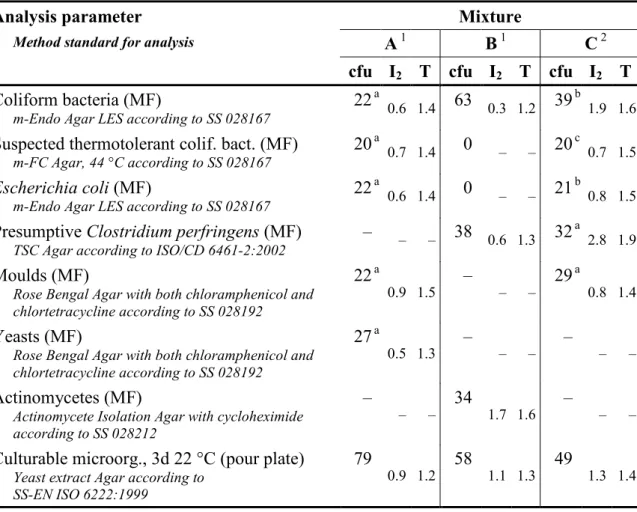
It is essential to have a homogeneous mixture and a uniform volume in all vials in order to allow comparison of all freeze-dried samples derived from one mixture. The volume was checked by weighing 2 to 3% of the number of vials produced, of the mixtures. The largest differences between vials were 8, 4 and 4 mg in mixture A, B and C respectively. The largest accepted difference is 15 mg (3%).
Table 3 Contents (cfu) and measures of homogeneity (I2 and T, see reference 1) in
relevant sample volumes for the various parameters in the mixtures
Analysis parameter Mixture
Method standard for analysis A 1 B 1 C 2
cfu I2 T cfu I2 T cfu I2 T
Coliform bacteria (MF)
m-Endo Agar LES according to SS 028167 22
a
0.6 1.4 63 0.3 1.2 39 b 1.9 1.6
Suspected thermotolerant colif. bact. (MF)
m-FC Agar, 44 °C according to SS 028167 20 a
0.7 1.4 0 – – 20 c 0.7 1.5
Escherichia coli (MF)
m-Endo Agar LES according to SS 028167 22 a
0.6 1.4 0 – – 21 b 0.8 1.5
Presumptive Clostridium perfringens (MF)
TSC Agar according to ISO/CD 6461-2:2002 – – – 38 0.6 1.3 32 a
2.8 1.9
Moulds (MF)
Rose Bengal Agar with both chloramphenicol and chlortetracycline according to SS 028192 22 a 0.9 1.5 – – – 29 a 0.8 1.4 Yeasts (MF)
Rose Bengal Agar with both chloramphenicol and chlortetracycline according to SS 028192
27 a
0.5 1.3 – – – – – –
Actinomycetes (MF)
Actinomycete Isolation Agar with cycloheximide according to SS 028212
–
– – 34 1.7 1.6 – – –
Culturable microorg., 3d 22 °C (pour plate)
Yeast extract Agar according to SS-EN ISO 6222:1999
79
0.9 1.2 58 1.1 1.3 49 1.3 1.4 1 10 vials analysed in duplicate, normally100 ml for MF and 1 ml for pour plate, analysed 21, 19 and
14 weeks ahead of the testing round for the mixtures A, B and C, respectively a Determined for the volume 10 ml
b Determined for the volume 1 ml
c Determined for the volume 1 ml; only E. coli but not E. cloacae was included – No target organism and thus no analysis
Table 3 presents the results from the organizer in the form of concentration means (cfu) and the measures (I2 and T; see reference 1) used to assess homogeneity from
duplicate analyses from 5 vials in a stability check when a mixture is used a second time. The results relate to the volume that was used for counting the colonies. The criterion used for a mixture to be considered homogenous is that I2 and T are not simultaneously higher than 2. According to that criterion, all mixtures were
homogeneous regarding the parameters that were about to be analysed.
Processing of numerical results
Most histograms have "tails" in either or both directions, due to values that do not belong to a normal distribution. Calculations are performed after square root transformations of the results that give better normal distributions by decreasing the significance of the high end "tails". Very deviating values are still present in most analyses and are identified as outliers (black bars). False negative results are presented with white bars in the histograms.
Outliers are identified by use of Grubbs’ test according to a modification by Kelly [3]. A level of 1% is set as the risk to incorrectly assess a result as being an outlier. Although the method is objective, there is a prerequisite that the results are normally distributed in order to obtain correct outliers at the 1% level. A zero result that is a low outlier is considered a false negative result. In special situations, e.g. when many zero results are reported and in some borderline cases, a few subjective adjustments are made in order to set the right limits based on the knowledge of the mixture’s contents. False results and outliers are not included in the calculations of mean values and measures of distribution.
The coefficient of variation (CV) for square root transformed results is given as a measure of dispersion. When the dispersion is <10% it is regarded as very small, 10−20% as small, 20−30 % as medium, 30−40% as large and >40% as very large. The calculation of uncertainty of measurement of the assigned value is described in the scheme protocol [1]. The assigned value for an analysis is calculated from the square root transformed results and is the square root of "Mean" in Annex A. It is there denoted as mv. Hence, also the measurement uncertainty will be expressed as a square root value. The standard uncertainty of measurement (u) correspond to the standard deviation of the assigned value (s) divided by the number of results squared-root transformed, i.e.: u = s/√nmv where nmv is the number of results in annex A,
except the deviating ones. Here is the relative uncertainty (urel) used and expressed as
per cent after division by the mean value mv and multiplication by 100.
More about result processing and recommendations on follow-up work are given in the scheme protocol [1]. A PDF of that document is available on the website www2.slv.se/absint.
References
1. Anonymous 2018. Scheme protocol, Microbiology, Drinking water & Food, 5th
ed. National Food Agency, Sweden.
2. Peterz, M., Steneryd, A.-C. 1993. Freeze-dried mixed cultures as reference samples in quantitative and qualitative microbiological examinations of food. J. Appl. Bacteriol. 74:143-148.
3. Kelly, K. 1990. Outlier detection in collaborative studies. J. Assoc. Off. Chem. 73:58-64.
4. Anonymous 1998. Council Directive 98/83/EC of 3 November 1998 on the quality of water intended for human consumption. Official Journal of the Eu-ropean Communities. 5.12.98, L 330/32-54 (national translations available). 5. Standard Methods for the Examination of Water and Wastewater,
http://www.standardmethods.org/
6. Anonymous 2015. Commission Directive (EU) 2015/1787 of 6 October 2015 amending Annexes II and III to Council Directive 98/83/EC on the quality of water intended for human consumption. Official Journal of the European Union. 7.10.2015, L 260/6-17 (national translations available).