The Influence of El Niño Phenomenon on the Climate of
Venezuela
Edilberto Guevara
Profesor of Civil and Environmental Engineering. Carabobo University
Bárbula, Valencia 2001. Venezuela
Tel: 58-241-8254892, Fax: 58-241-8239413, E. Mail: eguevara@uc.edu.ve
Abstract. Annual rainfall distribution in tropical America depends on the ITC zone, affected by factors such as Andes Mountain, tropical Pacific and Atlantic Oceans and local convergence areas. Studies have showed correlation between the ENSO Phases and hydrologic anomalies in the region. In Venezuela ENSO effects are reflected as climatic anomalies with magnitudes varying within the areas. This paper deals with the study of the effects of El Niño phenomena on the climatic variables in Venezuela. Variables affected directly by El Niño are rainfall, temperature and flows. Indirectly consequences are associated with an increase of diseases such Malaria, Dengue and Cholera. ENSO phenomena create anomalies in Hadley cells over Venezuela originating negative anomalies for rainfall during El Niño years and positive rainfall anomalies during La Niña events. Results of correlations between this anomalies and SSTA-3/4 have show negative rainfall anomalies between 8 and 20 % and positive anomalies of 14 to 30 %, depending on the region. About 85 % of ENSO years coincide with rainfall deficits bigger than 35 %. Temperature values are less sensitive to the occurrence of El Niño, varying the magnitude of the anomalies between 0.5 0C to 1 0C, high enough to increase the transmission of Dengue in a rate of 100 %. Malaria mortality and mobility increases in 37 % the year after an El Niño event. The relationship between ENSO 3/4 Indices and flow anomalies of Caroní River shows that the join occurrence of atmospheric and oceanic events exercise the biggest influence on the occurrence of flow anomalies in this basin. During the cold El Niño period in the Pacific (La Niña) flows in Caroni basin diminish affecting the storage and level of operation of Guri reservoir and the production of hydro electrical energy. In fact, 12 from the 15 El Niño events that happened during the analyzed period of flows (1950-2004) coincide with years in which mean annual flow is far smaller than the historical mean.
Keywords: Climatic anomalies; ENSO in Venezuela; effect of El Niño in Venezuela;
influence of ENSO on the Climate of Venezuela; effects of tele-connections.
1. Introduction
The global connection El Niño-Southern Oscillation (ENSO) originate climatic anomalies in other places of the world. In the case of Venezuela the results are the cold winters that affect the hydro electrical energy production, the agriculture, and increment the tropical deceases. Climatologists have already developed promising models to forecasting the onset of ENSO episodes (Guevara, 2002). For Venezuela it is necessary to establish the relationship between ENSO episodes und the effects that they cause in the national economy. The influence of ENSO events on Venezuela are manifested through the variation of rainfall and temperature anomalies, which magnitude varies according to the region affecting clime, agricultural production, health and hydroelectric energy generation.
The annual rainfall distribution in Venezuela is mainly determined by the position of the Inter Tropical Convergence (ITC) zone. Other factors are Los Andes Mountains, the Caribbean mountains and Maracaibo lake.
In this paper will be presented the results of the quantitative analysis of influence on ENSO on rainfall and temperature anomalies and the qualitative analysis on the tropical diseases. Bein the Caroni basin the source of 64 % of the energy consumed by the whole country, it is necessary to investigate the relationship between the onset of ENSO episodes and their effect over the flows of Caroní River. In this paper will be also be presented the relationship between ENSO Indices and the flow anomalies of Caroní River, using the time series of monthly mean flows observed at Guri Gauging Station during the period of 1950-2003.
2. The development of an ENSO episode
“El Niño” (EN) refers to the occurrence of abnormally high sea– surface temperature (SST) off the coast of Peru;“Souther Oscillation” (SO) refers to the accompanying low atmospheric pressure over the eastern Pacific and the high atmospheric pressure in the western Pacific. ENSO is a combine quasi-cyclic phenomenon that occurs every three to seven years, lasting 12-18 months and resulting usually in warm or cold winters in particular regions, drought in normally productive agricultural areas, and torrential rains in normally arid regions; it begins in a September, when the westward trade winds in the western equatorial Pacific are abnormally strong and SSTs in the eastern equatorial Pacific are low. In December, an anomalous eastward wind flow develops near the International Date Line, and the eastern SSTs begin to rise. Accompanying this eastward airflow, the extensive pool of high-SST water that usually exists in the far western equatorial Pacific begins to move eastward. This movement causes the sea level in the western Pacific to drop, while that along the Peruvian coast rises as much as 10 cm by April. December and January usually mark the “mature” stage of development of an ENSO episode, when low pressures exist above the widespread warm water in the eastern Pacific and the westward (easterly) equatorial winds essentially cease. Following this, SSTs in the easternmost Pacific begin to decline rapidly and are usually at below-normal levels by May. The end of an ENSO episode begins when the eastward waves of warm water are reflected off South America and, in a complicated process that involves pole ward circulation of the reflected westward-moving surface water and atmospheric processes, the SST returns to its original levels and the easterly trade-winds flow is reestablished.
ENSO involves major dislocations of the jet steams that can steer unusual weather systems into low- and mid-latitude regions around the world. The Southern Oscillation Index (SOI), defined as the normalized difference in surface pressure between Tahiti, French Polynesia and Darwin, Australia is a measure of the strength of the trade winds, which have a component of flow from regions of high to low pressure. High SOI (large pressure difference) is associated with stronger than normal trade
winds and La Niña conditions, and low SOI (smaller pressure difference) is associated with weaker than normal trade winds and El Niño conditions.
El Niño has also become synonymous with larger scale, climatically significant, warm events. There is not, however, unanimity in the use of the term El Niño. The tendency in the scientific community though is to refer interchangeably to El Niño, ENSO warm event, or the warm phase of ENSO as those times of warm eastern and central equatorial Pacific SST anomalies. Conversely, the terms La Niña, ENSO cold event, or cold phase of ENSO are used interchangeably to describe those times of cold eastern and central equatorial Pacific SST anomalies. The terms A-ENSO (Anti-El Niño) has also been applied to the cold phase of ENSO. NOAA (2004a) has developed operational definitions for El Niño and La Niña. The index is defined as three-month averages of SST departures from normal for a critical region of the equatorial Pacific (Niño 3.4 region; 120W-170W, 5N-5S). According to this definition, El Niño/La Niña is a phenomenon in the equatorial Pacific Ocean characterized by a Positive/Negative SST
departure from normal (for the 1971-2000 base period) in the El Niño 3.4 region greather than or equal in magnitude to 0.5oC, averaged over three consecutive months.
3. Metodology
A total of 12 indices were established to be correlated with rainfall ant temperature anomalies of the whole country and the flow anomalies at Guri Gauging Station of Caroní basin in the southern region of
Venezuela(Cardenas et al., 2002; Marín y Guevara, 2004; Guevara, 2005; NOA, 2004b; JISAO, 2004):
El Niño1/2 0 - 10° S; 90 - 80° W El Niño 3 5° N - 5° S; 150o - 190° W El Niño 4 5° N - 5° S; 160° E - 150° W El Niño 3/4 5° N - 5° S; 170 - 120° W ENSO1/2 = |MASOI| * MAEl Niño1/2 * 100 ENSO 3 = |MASOI| * MAEl Niño 3 * 100 ENSO 4 = |MASOI| * MAEl Niño 4 * 100 ENSO 3/4 = |MASOI| * MAEl Niño 3/4 * 100 NATL (North Atlantic) 5 - 20° N; 60 - 30° W
SATL (South Atlantic) 0 - 20° S; 30° W - 10° E TROP (Tropical Belt) 10° N - 10° S; 0 - 360 o
QBO-Index
MA means the moving average of the three months of SOI and SST in the corresponding El Niño region.
Following ranges were taken for the Intensities:
El Niño Wke (W) when: 0.65oC < SST-Anomaly < 1.0oC El Niño Moderate (M) when: 1.0oC < SST-Anomaly < 1.5oC El Niño Strong (S) when: SST-Anomaly > 1.5oC
ENSO 3/4 Wake wake (W)when: 40 < ENSO 3/4 < 85 ENSO 3/4 Moderate (M)when: 85 < ENSO 3/4 < 216 ENSO 3/4 Strong (S)when: ENSO 3/4 >216
The effect of seasonality of monthly flows was eliminated dividing each flow anomaly (Qij – Qm) by the mean flow of the corresponding month, Qm, as folowes:
QAij = 100 x (Qi j – Qm)/Qm
where QAij are the flow anomalies for year i and month j to be correlated with the above described indices; Qi j are the flow events for year i and month j; and Qm is the corresponding mean monthly flow.
4. Results
4.1 ENSO and Rainfall
General speaking the occurrence of rainfall excesses due AENSO events are more frequent than rainfall deficits due to ENSO events. The best correlations were those with one month lag for AENSO events and for the region of Guyana (southern part of Venezuela were Caroní basin is located). Table 1 shows the Percentage of monthly rainfall anomalies for all events associated with AENOS and ENOS divided in three groups: S = strong; M = Moderate; all events together. The table indicate that the anomalies are positive for AENSO and negative for ENSO events. Positive anomalies have bigger absolute values.
Table 1. Percentage of monthly rainfall anomalies for all events associated with AENOS and ENOS (S = strong; M = Moderate; all). Fuente: Cárdenas (2002b)
ENSO Events A-ENSO Events
REGIONS
F M All events F M All events
Guyana -16.03 -14.36 -13.15 20.43 18.53 18.75
Delta plains -21.60 -18.19 -16.91 28.41 22.88 20.23
Los Llanos -11.94 -12.88 -10.44 19.70 20.48 18.05
Los Andes Mountains -25.48 -24.12 -20.22 45.89 36.20 29.26
Coro Mountains -19.40 -20.20 -15.02 39.10 33.70 31.00
Maracaibo Lake Depresión
-15.06 -14.55 -9.03 31.08 21.64 14.73
Coast Mountains and Islands
Figure 1 shows the magnitude of rainfall anomalies for regions and type of event. Positive anomalies are bigger for Los Andes regions.
Negative anomalies are smaller for Guyana region.
ANOMALÍAS DE PRECIPITACIÓN (%)
-60 -50 -40 -30 -20 -10 0 10 20 30 40 50 60
GUAYANA LLANURA DELTAICA LOS LLANOS CORDILLERA LOS ANDES SISTEMA CORIANO DEPRESIÓN LAGO MARACAIBO CORDILLERA DE LA COSTA E ISLAS
Re
g
ion
e
s
% Precipitación
Niño F
Niño M-F
Niño T
Niña F
Niña M-F
Niña T
Figure 1. Graphical representation of rainfall anomalies for regions.
4.2 ENSO and Temperature
Temperature anomalies are almost always positive. There are regions with mean anomalies bigger than 0.5 ºC almost for all months of the year. The general tendency is that ENSO events increment the mean temperature all over the country, being the bigger positive temperature anomalies during the dry period: November to April. It is worth to mention
that during ENSO 1997-1998 occurred negative anomalies en some regions of Venezuela but the positive anomalies were a high as 2.0 ºC other regions.
in
4.3 ENSO and Health
Malaria: Malaria mortality and morbidity increases in following ENSO
Dengue: It has been found that the increase of one degree centigrade in the g the
lly outraces in extreme clima conditions (droughts
.4. Effect of ENSO on flows of Caroní river and the hydro electrical
he Caroní basin is located in the South-East of Venezuela (See Figure 2)
o
n
e monthly mean river flows averaged over the period
year around 37%.
temperature can increase twice the transmission of Dengue. AENSO events originate positive rainfall anomalies from 14 to 36 % increasin survival of mosquitoes
Cholera: Cholera norma
or floods). But during the ENSO 1997 the origin was socioeconomic . Infections came from sea products and very bad sanitary conditions of water supply and sewerage
4
production in Venezuela T
between 3o 40`and 8o 40´N and 60o 50´and 64o 10´W; it has an area of 96.000 km2 (10% of the country). Caroní River extends from Brazil- border to the confluence with the Orinoco River near the city of Puerto Ordaz. Orinoco River pours the waters into the Atlantic Ocean. Caroní basin is divided in two sections: the Upper Caroní Basin formed by the s called “Great Sabana” and the Lower Caroní basin until its outlet in the Orinoco River The mean annual values of the meteorological parameters over the basin are: precipitation 2.800 mm; temperature 27oC; evaporatio 2.000 mm; relative humidity 76 %.
Co mbia
Brazil Caribean Sea
Guyana
Figure 2. Location of Caroní basin. Source: EDELCA 2004
Figure 3 shows th
1950-2003, which displays a well-defined annual cycle with the maximum during the summer (9.159 m3/s in July) and the minimum in
lo Co mbia Brazil Caribean Sea Guyana lo
winter (1.404 m3/s in March). The mean anual flow for the period is 4.8 m
35
ed power capacity of the country (19.000
MW), this
s a , and
Figure 3. Historical flows of Caroní river at Guri Gauging Station. Red
Guri reservoir shows a hydrologic multi annual regulation of three years.
n forces ed
its
sure 3
/s with a standard deviation of 711 m3/s and a coefficient of variation of 0.147. (Guevara, 2005).
From the total install
60 % is hydro electrical. Caroní basin represents around 90% of hydro power and 64 % of the total annual energy production of the country (91.000 GWh/year) (EDELCA System). The energy is generated mainly by Guri Plant (Guri Reservoir) which was built on the Caroní River bed 100 Km upstream from its junction with Orinoco River. The reservoir ha total capacity of about 100 thousand million cubic meter (the eighth. biggest of the world), a water surface of 4.5 thousand square kilometer a normal operation level at height of 272 masl (EDELCA, 2004; Marín and Guevara, 2004). EDELCA System is operated by EDELCA (Electrificación Del CaronÍ) and is interconnected with the Electrical National System (SIN). 466 4552 4776 6011 4034 3899 4720 3743 4468 4774 3797 5564 4987 4936 5825 4009 5089 6235 4967 5202 5004 6305 5896 4985 4526 5400 5447 *4345 *4686 4588 4775 5674 5506 5819 5687 5728 4640 *4747 4843 20 *3698 *4584 4588 * *3502 *5188 *4620 *4375 *4401 *4949 *3852 *4389 *5396 *3513 3400 3900 4400 4900 5400 5900 6400 1950 1955 1960 1965 1970 1975 1980 1985 1990 1995 2000 Years m3 / *55 9 s Q 3684
numbers are coincident with El Niño event years.
For this reason the ENSO phenomena does not affect direct the energy production of EDELCA System but this effect is notorious in the drawdown of the operation water level of the reservoir which in tur to turbinated bigger volumes of water to keep the balance in the energy generation of the national system. Nevertheless this effect can be alleviat by a join operation of Guri and the other hydro plants locates downstream (Macagua I and II). The ENSO event of 92/93 affected the flows of Caroni River and as a consequence, Guri reservoir drawdown level to historical minimum (CAF, 2000). The 97/98 ENSO also caused a decrease in the flows of Caroni River, and obligated to EDELCA and SIN to consider an increase of vapor energy production as a preventive mea to confront the energy crisis during the period of March-May 98. Even if
the effects of this energy crisis was not noted by the energy users, indeed the volume of Guri reservoir descend during this period in about 16 thousand millions of cubic meter (20 % of its capacity) equivalent to 7 thousand GWh/year (only 12 % of the total energy generation). To cove the difference the termic plants used 7.8 % more gas (226 millions of cubi meter) and 31.7 % more fuel-oil (511.000 MT) during the same period.
The onset of the raining season was delayed in comparison with r c normal l n rmal
The flows in Venezuelan rivers rich the highest values at the end of
l rs).
5. Results of the Correlations
The results obtained by the correlation between Flow Anomalies of Caroni
rage
st
ws of Caroní river a
varianc l
NSO conditions are given when : ENSO 3/4 > 80 percentile < 80 (A-ENSO) conditions are given when: ENSO < 20 percentile (and positive) values belong to A-ENSO events, being the highest for the
years in 1997; temperatures and evaporation, as well as the dry season intensified from November to April. In January 1998 the rainfal anomaly (deficit) increased to 20 % compared with normal years. Maximu and minimum values of temperature increased between 1 and 4o C. Compared with historical data, the flows of Caroní river showed a no behavior from January to June 1997; after July of the same year, flow anomalies increased but negatively (flows decrease) until January 1998 reaching values near the historical minimum.
the summer of La Niña years and the lowest values during the winter of El Niño years (Caviedes, 1997; Caviedes y Waylen, 1997). Caroní River is not the exception. Figure 2 shows the historical flow of Caroní River in Guri Gauging Station for the period 1950-2003. From the 14 El Niño years that happened in the period 1950-2003, 12 correspond to years with flow values in Caroní River smaller than the historical mean (CONICIT, 1998;
Guevara, 2005), where the flow discharge is smaller than the historica mean (numbers with asterisk in Figure 2 correspond to ENSO event yea
river at Guri Gauging Station and the 12 Indices as described above are presented in Table 1. The best correlation is showed by the Index ENSO 3/4. This index is a composite one that includes the moving ave of the last three months of both, the SOI Index, and the SST Index in the region El Niño3/4. The fact that the best correlations are obtained with the use of composite indices (ENSO) means that the join occurrence of atmospheric and oceanic events (tele-connections) exercise the bigge influence in the occurrence of flow anomalies in the Caroní river (Cardenas, 2000, 2002; Marín and Guevara, 2004).
To evaluate the influence of ENSO on the flo
e analysis was applied to the flow anomalies dividing the historica data according to the percentile distribution of the indices capable to define the phenomena in samples corresponding to ENSO event years. The groups or cases were established as follows:
E
Normal conditions are given when: 20 percentile < ENSO 3/4 percentile
Anti-ENSO
dry per
) to efine the occurrence of El Niño cases based on the percentile distribution of El N
considering the strong ness of the henomena. The result is given in Figure 4, which shows an improvement of the s
e f
s of Caroní River it is advisable to consider also the incidence of the QBO Indices. At this respect
s
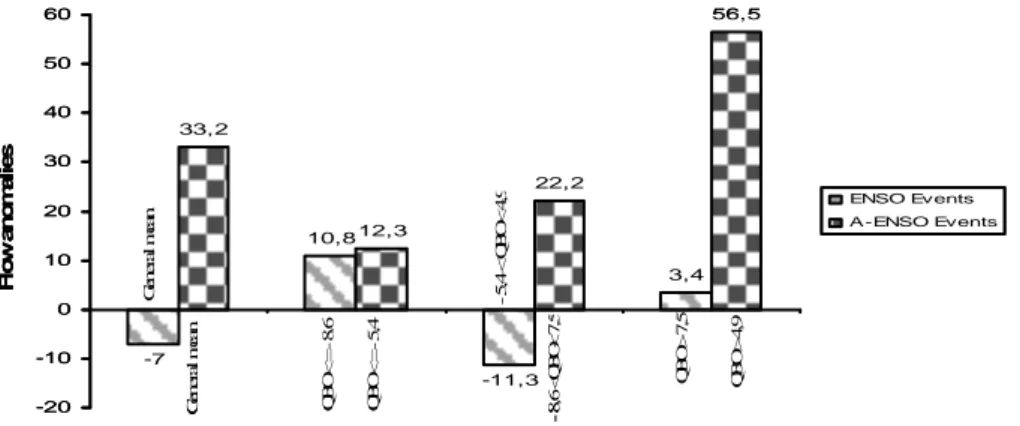
ation of flow anomalies by the QBO Indices for the case A-ENSO results in a direct relationship between QBO and Anomaly values
ow a
c ish affecting the storage and the level o
s iod of the year. For ENSO events the tendency is similar but the values are negative and smaller that for A-ENSO. This results clearly show the effect of tele-connections on the flow anomalies of Caroní River.
Analogous criteria have been used by Cardenas y Waylen (2002 d
iño3/4 and the occurrence of SO events, this last one, from the percentile distribution of SOI Indices.
An additional analysis was done p
ignificance levels as the intensity of the meteorological event increases for all analyzed cases. Here the A-ENOS is responsible for the highest positive flow anomalies, especially during the dry period of th year.. In other words, there is a direct relationship between the intensity o the phenomena and the magnitude of the flow anomalies.
When analyzing the effects of ENSO over the flow
trials were done with the cases showed in Figure 5. The results given in the Figure indicate that the Indices QBO modulate the effects of ENSO over the flows of Caroni river quite good. Qualitatively speaking, for low east and west velocities of QBO Index, the effect of ENSO over the flows increases in some degree. High east velocities of QBO, result in higher positive flow anomalies than those corresponding to west velocitie (Cárdenas, 2000)
The modul
but all of them are positive. For the case of ENSO, which general mean value of the modulated anomaly is negative, the results do not sh definite tendency and the values can be either, positive or negative. This means that there is a direct influence of La Niña (cold phase of El Niño) over the flow anomalies of Caroní river.
The conclusion is that during the cold El Niño period in the Pacifi (La Niña) the flows in Caroni river dimin
f operation of the reservoir and the production of hydro electrical energy. Knowledge of this fact can help authorities to make better decision on the operation of the National Interconnected Electrical System (SIN) when an episode La Niña (A-ENSO) is foreseen.
-7 10,8 -11,3 3,4 33,2 12,3 22,2 56,5 -20 -10 0 10 20 30 40 50 60 ENSO Events A-ENSO Events G e n er al m ea n Q BO < = 8 .6 Q BO < = 5 ,4 - 5, 4 < Q BO < 4 ,9 - 8, 6 < Q BO < 7 ,5 Q BO > 7 ,5 Q BO > 4 ,9 G en er al m ean Fl o w a n o m a lie s -7 10,8 -11,3 3,4 33,2 12,3 22,2 56,5 -20 -10 0 10 20 30 40 50 60 ENSO Events A-ENSO Events G e n er al m ea n Q BO < = 8 .6 Q BO < = 5 ,4 - 5, 4 < Q BO < 4 ,9 - 8, 6 < Q BO < 7 ,5 Q BO > 7 ,5 Q BO > 4 ,9 G en er al m ean Fl o w a n o m a lie s
Figure 4. Results of the variance analysis in % for the flow anomalies of
Caroní river using the Indices ENSO 3/4 (best correlation) for ENSO and A-ENSO (La Niña) events.
41,83 36,7 6,2 23,7 -10,5 -5,5 34,1 -14,4 32,6 -13,9 -7,4 20,1 38,2 -18,6 21,3 -14,5 -8,1 -18,1 -30 -20 -10 0 10 20 30 40 50 Wake Moderate Strong
ENSO ENSO ENSO
A-ENSO A-ENSO A-ENSO
Dry Period Wet Period Year
Fl o w a nom a li e s 41,83 36,7 6,2 23,7 -10,5 -5,5 34,1 -14,4 32,6 -13,9 -7,4 20,1 38,2 -18,6 21,3 -14,5 -8,1 -18,1 -30 -20 -10 0 10 20 30 40 50 Wake Moderate Strong
ENSO ENSO ENSO
A-ENSO A-ENSO A-ENSO
Dry Period Wet Period Year
Fl o w a nom a li e s
Figure 5. Effects of ENSO and A-ENSO events normalized (modulated)
by the QBO-Indices on the flow anomalies of Caroní river at Guri Gauging Station.
Table 1. Correlation coefficients obtained between the 12 established indices and the monthly flow anomalies (QA) of Caroni river at Gurí Gauging Station for the period 1950-2003.
Event Índice Correalation with QA
ENSO 1/2 -0.152** ENSO 3 -0.216** ENSO 3/4 -0.260** ENSO
ENSO 4 -0.251** Southern Oscillation SOI 0.217**
El Niño1/2 -0.031 El Niño 3 -0.122* El Niño 4 -0.158** El Niño El Niño 3/4 -0.192** NATL -0.060 SATL -0.103* Others TROP -0.1957**
Note: (**) significant correlations with α = 0.001 (*)s
6. Conclusions
The warming process of the equatorial Pacific water surface temperature (El Niño), as well as the ENSO phenomenon, called here El Niño 3/4 Index, cause important anomalies in the climatic parameters in Venezuela, such as in the regimen of rainfalls, temperatures and flows. The influence of the phenomenon shows up as negativ anomalies (defficit) of rainfall and flow during the El Niño, and positive anomalies (excess) of rainfall and flow during La Niña episodes, being the positive anomalies bigger than the negative ones.
The flows of Caroní River are directly inffluenced by the ENSO episodes. This effect shows up as a decrease of the flows during the winter period of North Hemisphere. In addition of ENSO, there are at least two other indices that modify or modulate the flow anomalies in Caroní river: the QBO (Quasi Biennal Oscilation) and the DPO (Decade Pacific Oscilation).
The ENSO 3/4 Idex is the one that shows the highest correlation with the flow anomalies of Caroní River in Guri Gauging Station. The flow anomalies are negative for ENSO events and posituive for A-ENSO
episodes. The values of the anomalies increase as the strength of the ENSO event increase.
For low east and west velocities of QBO Index, the effect of ENSO over the flows increases in some degree. High east velocities of QBO, result in higher positive flow anomalies than those corresponding to west velocities.
There is a strong coincidence between the occurrence of ENSO events and the occurrence of droughs in the Southern Region of Venezuela.
This affects the hidroenergy production since Caroní basin generatates more than the 60 % of the energy consumed by the whole country. Acknowledgements
The author wishes to acknowledge the financial support of “Consejo de
Desarrollo Científico y Humanistico (CDCH-UC)” of Carabobo University (Grant No. CDCH-1630-03 and Grant No. CDCH-2005-09.
References
CAF, 2000. Las lecciones de El Niño Memorias del Fenómeno El Niño 1997-1998 Retos y propuestas para la región andina. Corporación Andina de
Fomento. Serie de 6 volúmenes. Caracas. Bolivia: 288 pp., Ecuador: 312 pp., Perú: 296 pp.
Cárdenas, A., 2000. Análisis del Fenómeno ocurrido en el Litoral Venezolano en Diciembre de 1999. Revista Bibliográfica de Geografía y Ciencias Sociales. Universidad de Barcelona. Nº 213, 29 de febrero de 2000.
Cárdenas, P., García, L. y Gil, A., 2002. Impacto de los Eventos El Niño – Oscilación del Sur en Venezuela. Corporación Andina de Fomento (CAF). Caracas, 2002. 131 pp.
Caviedes, C. y P., Waylen, 1997. Respuesta del Clima de América del Sur a las Fases de ENSO. Department of Geography. University of Florida. USA. Caviedes, C., 1997. Influencia de ENOS sobre las variaciones inter-anuales de
ciertos ríos en América del Sur. University of Florida,Gainesville, USA. CONICIT, 1998. El fenómeno El Niño y su posible influencia sobre el territorio
de Venezuela. Comisión Nacional de Meteorología e Hidrología. Marzo de 1998. Caracas. Venezuela.
EDELCA, 2004. Generación. Corporación Venezolana de Guayana. Electrificación del Caroní, C.A. EDELCA.
Guevara, E., 2002. Estudio de Tormentas Tropicales y su Aplicación al Diseño Hidrológico en Venezuela. Informe Proyecto de Investigación 96-026. CDC H. Universidad de Carabobo.
Guevara, E., 2004. Inundaciones y Sociedad. Conferencia y curso sobre eventos extremos. Seminario Nacional sobre Eventos Extremos: Inundaciones y Sequías. Departamento de Recursos de Agua y Tierra. Facultad de Ingeniería Agrícola. UNALM. Perú. Noviembre 2004.
Guevara, E., 2005. Efecto del Fenómeno El Niño sobre los Caudales del río Caroní en Venezuela. Submited for publication to INGENIERÍA UC.
JISAO, 2004. The Pacific Decadal Oscillation (PDO). Joint Institute for the Study of Atmosphere and Ocean. University of Washington. NOAA. USA.
Marín, P., and E. Guervara, 2004. Evaluación de la Influencia del Fenómeno El Niño sobre Venezuela. Escuela de Ingeniería Civil, Universidad de Carabobo. Trabajo de Grado.
NOAA, 2004a. El Niño –Related Changes in Atmospheric Circulation in the Subtropics and Middle Latitudes. National Weather Service. National Oceanic and Atmospheric Administration. USA.
NOAA, 2004b. What is the Pacific Decadal Oscillation?. Western Region Headquarters. National Weather Service. National Oceanic and Atmospheric Administration. USA.