Children’s participation in everyday activities:
Differences and similarities between children with
intellectual disabilities in China and South Africa
By Sharon Eichler
Two-year Master Thesis 15 credits Supervisors: Anna Karin Andersson
SCHOOL OF EDUCATION AND COMMUNICATION (HLK) Jönköping University
Master Thesis 15 credits Interventions in Childhood Spring Semester 2020
ABSTRACT
Author: Sharon Eichler
Children’s participation in everyday activities: Differences and similarities between children with intellectual disabilities in China and South Africa
Pages: 37
BACKGROUND Children and youth with intellectual disabilities have a right to participation in life just like any other children. AIM This study aims to explore the most influential factor on the participation of a child with intellectual disability and to compare the level of participation between children with ID from South Africa and China. To this day there is still insufficient information on what can influence the participation of children with intellectually disability and how to improve their attendance in everyday activities. METHOD A cross-sectional study using secondary data was conducted. The data was collected through the ‘Picture my participation’ tool that explores the self-perceptions of children with ID in everyday activities. Study participants were 191 children and youth from South Africa and China, ages 6 to 21, who have intellectual disabilities. A multiple linear regression was conducted to find an answer to the research questions. Data of this study was retrieved from the CHILD group at Jönköping University. RESULTS The findings of this study show that children with intellectual disabilities have a lower participation rate in social and community activities than in home activities. It shows that children who live in South Africa have a higher participation mean than children in China. Within China children who live in an urban area show higher participation than the children living in the rural area CONCLUSION The level of participation of children and youth with intellectual disabilities is highly influenced by the social environmental factors in the child’s life. Cultural contexts include the country, socio-economic status, poverty, and ethnicity. A child and his environment are all part of a greater cultural context.
Keywords: child disability, intellectual disability, everyday activity, attendance, participation, low- and middle-income countries, bioecological model
Postal address Högskolan för lärande och kommunikation (HLK) Box 1026 551 11 JÖNKÖPING Street address Gjuterigatan 5 Telephone 036–101000 Fax 036162585
Table of Contents
1. Introduction ...5
2. Background ...6
2.1 Participation ...6
2.2 Cultural environment ...7
2.3 Children with disabilities in China ...8
2.4 Children with disabilities in South Africa ...8
2.5 Cultural differences China vs. South Africa ...9
2.6 The socioeconomic status in South Africa and China ...10
3. Aim ...12
3.1 Rationale ...12
3.2 Research questions ...13
4. Theoretical Framework...13
4.1 The bioecological model of development ...13
5. Method ...16 5.1 Study design ...16 5.2 Participants ...16 5.3 Data collection ...16 5.4 Instrument ...17 5.5 Data analysis ...18
5.6 Reliability and validity ...20
6. Ethical Consideration ...21
7. Results ...22
7.1 Independent Samples T-test per variable ...22
7.2 Average participation per country per activity ...24
7.3 Multiple Linear Regression...27
7.3.1 Multiple Linear Regression per country ...28
8. Discussion ...29
8.1 Participation in everyday activities for children with ID ...29
8.2 Differences and similarities in participation between China and South Africa ...31
9. Conclusion ...36 References ...38 Appendix A ...46
Abbreviations
CH China
ICF-CY International Classification of Functioning, Disability and Health- Children and Youth Version
ID Intellectual disability
PmP Picture my Participation Tool
SA South Africa
1. Introduction
In Article 2 of the Convention on the Rights of the Child (UNCRC, 1989), disability is mentioned as one of the personal characteristics on the basis of which children cannot be discriminated against. Article 23 deals specifically with children with disabilities and states the right to accurate care and protection in any situation. A child with a mental or physical disability is entitled to special care. The convention guarantees the right of a child with a disability to live a dignified and independent life. Children with disabilities should be able to go to regular schools as much as possible and live at home as much as possible. The convention also provides that a disabled child should be able to actively participate in society (Uçus & Dedeoglu, 2016). In addition, the government provides assistance to ensure access to education, recreation and healthcare. This support must contribute to the fullest possible integration of the child into society and to his / her personal functioning. In order to develop his talents, it is important that a child feels good about himself (well-being) and is captivated (involvement) in everyday activities. Everyday activities, such as going to school, brushing teeth or helping out at home require a certain level of functioning for the child and his/ her environment. When describing (problems with) functioning, the International classification of functioning, disability and health (WHO, 2007) is used to describes how people deal with their health condition in everyday life. The ICF-CY contains descriptors (regardless of cause) of human functioning. The desciptors can be viewed from three angles: the human being as an organism (functions & anatomical properties), human actions (activities) and participation in society (participation). Thus, participation is described as ‘the involvement in a life situation’ (WHO, 2007, p. xvi).
A child with an intellectual disability develops slower and different from other children. According to the definition of the World Health Organization (2020) a child with intellectual disabilities has a ‘reduced ability to understand new or complex information and to learn and apply new skills.’(WHO, 2020). An intellectual disability can be caused through many ways and the limitations of every child are different. There are children with Down’s syndrome or children with a brain disfunction. Sometimes children with an intellectual disability also have a physical disability. Children with intellectual disabilities have difficulty learning and understanding what is going on around them. They perceive the world in a different way. The perception of time of a child with ID is usually also limited. They do not know what tomorrow
or next week is. Some children cannot even imagine what will happen the next hour. They can feel very anxious and insecure, which is reflected in restlessness or unruly behavior. Playing together with peers is important for the functioning of every child, but sometimes a child with an intellectual disability is not able to play with his peers. When children with intellectual disabilities play together with others, it is important to place children with the same interests and possibilities together (King et al., 2013). One does not look at the real age of the child, but at his way of acting and playing (level of functioning).
There are different factors, such as age, gender, diagnosis and environment, that can influence participation of the child in a certain activity. The social and cultural context have a major influence on the education and functioning of children (Packer, 2017). The education and functioning of children cannot be viewed separately from the context in which these processes take place. The term childhood fits in with prosperous, western societies. In non-Western societies with a low level of functioning, children not only have psychological, but usually also important economic value for parents. Children often give to the social economic status of the family early on and form a kind of retirement provision for their parents. Children can have a different role and value in different societies (Brosinsky et al., 2018).This research explores the level of participation among children and youth with intellectual disability living in two different cultures, China and South Africa.
2. Background
2.1 Participation
The World Health Organization defines participation as a person's ‘involvement in a life situation (WHO, 2007, p. xvi). Life situations can include activities that take place at home, in the community or in a social setting. In any study with children with disabilities, improved participation is often seen as the ultimate goal of treatment or intervention (Coster & Khetani, 2008, King et al., 2013). That emphasis on participation coincides with the introduction of the ICF-CY model of the World Health Organization (WHO, 2007). In this model, participation is defined as ‘involvement in situations in daily life’. Participation is described as an outcome with two essential constructs: attendance and involvement. Attendance is defined as ‘being
while the child is present and consists of elements such as perseverance, motivation and affection, and it may also include the experience of social connections (Winswold, 2010).
The related constructs that are often measured are competence in activities, a sense of self-worth (such as, determination, self-perception) and preferences. Each of these constructs can change as a result of participation, and each of them can influence future participation, they are however not actual participation. If the goal is to improve participation, the two elements that can be considered are attendance and involvement. Motivation during attendance is more related to involvement, while the motivation to be present is more a preference. Self-efficacy is one of the aspects of the ‘self-esteem’ construct and can change due to improved competences and / or participation, but it is not part of participation (Adair et al., 2015). Consequently, this research will focus on the degree of participation of a child with a disability. Since the Picture my Participation tool (Willis et al., 2015) is designed for any cultural setting, research questions are aimed at looking at the level of participation for a child and if it depends on his surrounding and background (Hayes et al., 2017). The bioecological model of human development by Uri Bronfenbrenner (Bronfenbrenner & Morris, 2007) emphasizes the importance of the social environment on the education and development of children. The bioecological framework is thus expanded with a cultural dimension.
2.2 Cultural environment
Experience always involves interaction with a sociocultural environment. Bu having the culture as an environment the child can be influenced by its surroundings (Biesta et al., 1997). Then merely being present in a certain sociocultural environment is not enough to be able to acquire that culture for oneself. According to Bronfenbrenner (2007) the only way the child can learn about the culture, is by participating in shared practices in which social encounter plays a role. After all, it is only there that the meaning is assigned to certain things, actions or events. Only in and through social interaction and communication can the child get in touch with the culture and become familiar with it.
So, the individual factors (the continuous reconstruction of experience) and the social factors (the events developed in a culture) do not simply come together and the activities of the child itself are also insufficient to bridge this link. The connecting link between the individual and the social factors is the social interaction or communication (Biesta et al., 1997).
2.3 Children with disabilities in China
In China, discrimination against people with disabilities is unfortunately a part of everyday life. Statistics show that more than 80 million people with disabilities live in China (out of almost 1.4 billion inhabitants) (Berk, 2009). However, the social systems are not set up for this. Christian churches increased their commitment to people with disabilities, yet they did not have enough trained personnel and resources. In the rural area which is also dominated by Buddhism, many families believe that the reason for disability is a failure in an earlier life (Weller, 2006). Many parents are ashamed of their disabled child (Vygotskiĭ et al., 1993). If they learn during pregnancy that the child will not be born healthy, many will have an abortion (Xiong et al., 2011). Other parents give their child away for adoption immediately after birth. It was 30 years ago when China started to take necessary steps towards a stronger care system for its disabled people. In 2008, shortly before the Beijing Paralympic Games, the UN Convention on the Protection of the Rights of Disabled People was ratified. In the large cities there are now centers with rehabilitation measures, people with disabilities receive state social assistance and have health insurance (X. Zheng et al., 2012). However, care is still poor in the countryside, where an estimated two thirds of the disabled people live (Xiong et al., 2011). Almost 90 percent of the children in China's orphanages are disabled, but there is little therapy and medical care (X. Zheng et al., 2012). Every year, thousands of children with disabilities are abandoned in China because their parents cannot afford treatment and because they have long been considered an embarrassment. Even today, people with disabilities are hardly recognized by the Chinese society, there is a lack of initiatives that promote more equality (X. Zheng et al., 2012). There are many people who fall between two stools, including the disabled. There are almost no facilities for the physically or mentally handicapped. Mentally disabled people go to school like all other children up to the age of 17, after which there is no childcare from the government. Parents or other family members often take great care of their son, daughter, brother or sister, but struggle to combine these care tasks with work and career. This obviously has an effect on family income. These families depend on private initiatives (Eide & Ingstad, 2011).
2.4 Children with disabilities in South Africa
In South Africa, children with disabilities are often hidden in the community. A part of the population in South Africa believes that a ‘normal’ person cannot bear a child with disabilities
dead are believed to be able to return after their death and counsel or curse their family members. This is the reason these children and their families are often outcast and socially marginalized. South Africa is doing well theoretically when it comes to the rights of people with disabilities (CRPD, 2006). The constitution prohibits discrimination against people with disabilities, there are numerous laws protecting them, and South Africa has signed the United Nations Convention on the Rights of Persons with Disabilities. It says, for example, that pupils or students with disabilities must be taught at regular schools or universities. But theory is not practice, there is a lack of implementation (Eide & Ingstad, 2011). There are also no government campaigns in South Africa to educate people that disability is not a curse (Thsitake et al., 2013). In addition, many disabled children stay at home. Schools and kindergartens are not barrier-free and there is a lack of suitable staff. The Ministry of Women, Children and People with Disabilities - one of more than 40 ministries in the country - does not have the power and, above all, the budget to do anything about this situation (Lygnegård et al., 2013). South Africa faces many challenges given the country's enormous problems with poverty, unemployment, a malfunctioning education system, poor provision of services, crime and corruption. (Thsitake et al., 2013).
2.5 Cultural differences China vs. South Africa
Cultures can be compared using the framework of cultural dimensions by Geert Hofstede. This theory looks at power distance, socialism versus individualism, femininity versus masculinity and uncertainty avoidance (Hofstede, 2010). To compare two countries when analyzing data on children’s participation it is vital to be aware of the cultural differences in the country. The dimension of power distance is defined by Hofstede (2010) as ‘the extent to which less powerful members expect and accept in society a country where power is distributed unequally’ which is related to how cultures act towards the problem of inequality in society (Hofstede, 2010). China scores 80 out of 100 and South Africa scores 49, this shows a big difference in how both countries deal with the issue on inequality. China deals way less with inequalities, whereas in South Africa there is a higher expectation that everyone has a place in the system, even though it is low. China and South Africa differ most when it comes to individualism vs. collectivism. South Africa has a collective culture (Roisman et al., 2017). In this country the population is considered a group. They are almost not seen as individuals. People live, survive and share everything together. Individualism is less prevalent in South Africa than it is in China. This is because China is more prosperous and more long term
oriented than South Africa. Interestingly, the masculinity values for South Africa and China are both between 63 and 66, both of which are significantly above the global average (value: 50). Both are therefore to be seen as masculine cultures (Hofstede, 2010). A masculine culture is more focused on achievement, competition and success. This is important, because a culture that values success more than care and quality of life (feminine) is naturally less likely to be inclusive towards people with disability, since they are never truly able to keep up with the competition and achieve what the society considers success.
2.6 The socioeconomic status in South Africa and China
Both in China and in South Africa the gap between rich and poor is still present. A high level of well-being has a major influence on personal development and participation contributes positively to this. Every person wished to participate fully in life situations, regardless of their level of development (Laevers et al., 1994). Well-being and participation are therefore strongly influenced by the environment of the child. Due to its strong cultural diversity, South Africa is often called ‘A world in one country’. With the contrast between well-developed urban areas and extremely poor rural areas, South Africa faces numerous challenges, particularly with regard to children's rights (Giarelli et al., 2009). Which is also greatly the case in China. Main problems that children in South Africa and China are facing today are poverty, health, education and child abuse. The World Health Organization (WHO, 2007) sees disability as an interaction between the person and their environment. Attention to both social and environmental factors is considered important to support youth in realizing an ideal development.
Rather than 'child poverty’, a large-scale survey research refers to 'child poverty risk' or 'children with an increased risk of poverty' (Hughes, 2013). The term ‘risk of poverty’ expresses the narrowing down to ‘income poverty’. More specifically, these are children who live in a low-income family. Families with a child with a disability appear to have a weaker socio-economic profile compared to an average family (Hughes, 2013). Single-parent families are more common, mothers are less educated and less often have a paid job. The low labor participation of the mothers may have to do with the higher care costs that a child with a disability requires. However, the average standardized household income is not much lower than that of the average households, which suggests that the lower employment rates of these
2000). However, the situation changes if we also take into account childcare and medical expenditure for the children. After deduction of these costs, the family income of the families falls by no less than 24%, with medical expenses being the main factor (income drop by 15%), for families with young children (-3 years) this is 11% (mainly costs childcare), at families with children aged 3-15 years it is 4%. The poverty risk of families with a child with a disability therefore rises sharply after deduction of childcare and medical expenses: from 19% to 28%.
The apartheid regime and its abolition still play a major role in South Africa. There are major cultural and socio-economic differences at national, regional and local level (Ataguba et al., 2011). The poorest 10% of the South African population owns slightly more than 1% of the national income. The wealthiest 10% of South Africa owns nearly half. Apartheid still has a lot of influence on the difference between poor and rich South Africans. More than two thirds of black children live in low-income households. That affects the economy and business. South Africa still has a bad reputation when it comes to violence and crime (Ataguba et al., 2011). In the townships of large cities such as Johannesburg and Cape Town, violence is a daily practice. Beyond that there is still a lot of violence between the black population and white farmers. The values, norms and customs often differ per region and per population group. There are also clear regional differences: Johannesburg, Pretoria, Cape Town, Port Elizabeth and Durban are developed economic centers, but the rest of the country is underdeveloped. Because of these major differences, South Africa has a so-called ‘dual economy’: the country has characteristics of both a developed country and an underdeveloped country.
China is an emerging economy with a relatively low income per capita. The financial growth is largely the result of an economic liberalization policy. Based on data from 2012, China has a Gini coefficient of 0.55, according to researchers from the University of Beijing. With a result of more than 0.4, the World Bank (Xie & Zhou, 2014) believes that there is significant income inequality. Only South Africa and Brazil are even higher with Gini coefficient of 0.63 and 0.53 respectively. The poorest 25% of all Chinese households have only a 1% share of the country's total wealth. Despite the great economic progress, part of the population still lives in great poverty. According to the United Nations Development Program in 2014, 5.2% of the population in the People's Republic of China lived below the poverty line, comparable to more than 71 million people. This poverty mainly focuses on the countryside. Around 20% of people in work have an income of less than two dollars a day (UNDP China: Human Development Indicators, 2016).
Looking at the gross domestic product (GDP) per capita we can see that China’s GDP per capita stood at 10,098 US Dollars for 2019. South Africa’s GDP per capita stood at 6,100 US Dollars for 2019 and it is predicted to increase by 1.13 percent (International Monetary Fund, 2019). The unemployment rate can give a general overview on the participation in the labor market. In comparison, the International Monetary Fund (2019) reports an unemployment rate of 28.7 % in South Africa and a rating of only 3.8 % in China. This low employment rate in South Africa can be a key factor between the large income gap in the country, especially among black South African people.
3. Aim
3.1 Rationale
Early research shows that a growing number of children seem to experience serious problems in personal functioning due to some form of disability and as a result are experiencing obstacles in social participation (Matson, 2019). When children with an intellectual disability are compared with children without an ID, it is especially the difference in development that stands out. Children with intellectual disabilities are lagging behind in their development. Having an intellectual disability is a complex subject, which is still being researched and investigated to this day. There is an amount of information available on this subject, however more study is necessary that focusses on children living in lower-middle-income countries (Daley et al., 2013). Additionally, insufficient information is available on what can influence the level of participation of children with intellectual disability and how these environmental factors can be altered to improve everyday participation. This study aims to investigate different factors such as age, area, gender and country and to compare these with the average everyday participation of a child or youth with intellectual disability. Hence, to explore the most influential factor on attendance in daily activities of a child with ID. Research on how the child with an intellectual disability evaluates his/ her own level of attendance in participation is scarce. The picture my participation tool (Arvidsson et al., 2019) is designed especially for these children in order for them to rate their attendance. The child's voice is central to this and it should be heard (UNCRC, 1989).
3.2 Research questions
Overall, this study aimed to investigate how children with intellectual disabilities participate in everyday life activities. Data from South Africa and China will be compared with each other to discover how different factors influence a child’s participation. The purpose of this research is to see if there is any difference related to participation of a child with intellectual disabilities in South Africa and in China in everyday activities.
The study was further guided by the following research questions:
1. To what level of attendance do children and youth with intellectual disabilities in China
and South Africa participate in everyday activities?
2. What differences and similarities are there between children and youth with intellectual
disability from South Africa and China in terms of participation in everyday activities?
3. Which of the following factors most influence participation in everyday activities of
children and youth with intellectual disability in South Africa and China: age, gender, urban/rural area or country?
4. Theoretical Framework
4.1 The bioecological model of development
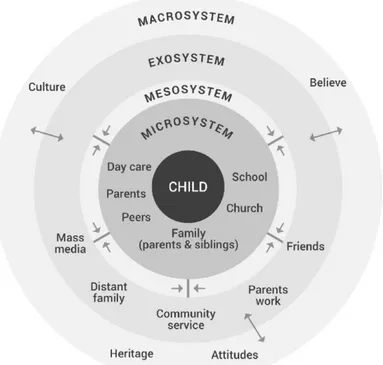
The relationship between man and environment is central in the bioecological model of Bronfenbrenner. He sees the environment as ‘the immediate space of experience that is perceived’ (Ashiabi & O’neal, 2015). In the environment, also called 'ecological space', three points of view are distinguished by Bronfenbrenner (2007). Namely 'the observed spatial or physical aspect (the psychic dimension), the persons with their different relationships that have a place in it (the social dimension) and the actions that these persons perform alone or with each other, including the social significance of the actions (Hayes et al., 2017). In addition to these three points of view, Bronfenbrenner, like other representatives of the bioecological approach, distinguishes mutually influencing concentric systems in his model (Bronfenbrenner & Morris, 2007). These systems concern the microsystem, the mesosystem, the exosystem and the macrosystem (Ashiabi & O’neal, 2015). Four systems that, as he puts it himself, have the
same kind of construction as the well-known Russian dolls where a new doll appears every time (Bronfenbrenner, 1986; Eysenck, 2004). With the bioecological model of Bronfenbrenner, a new system appears, as it were, every time. Bronfenbrenner is particularly interested in the significance of these systems for the promotion of personality development. According to him, the development-stimulating potential of every area of life is growing with the range of supporting connections with other areas (Rosa & Tudge, 2013).
In the middle of the model is the microsystem (Figure 1 below) or also called the ecological center. This microsystem consists of the direct experiences of a child in a certain setting. Children usually come into contact with different microsystems per day, such as the microsystem family and the microsystem school (Eysenck, 2004). The mesosystem is located around the microsystem. This system is described by Bronfenbrenner as follows: ‘A mesosystem compromises the interrelations between two or more settings in which the developing person actively participates’ (Bronfenbrenner, 1986, p. 25). Examples are the relationship between family and school and the relationship between school and the peer group (Bronfenbrenner & Morris, 2007).
The layer around the mesosystem is the exosystem. The exosystem consists of factors of which the young person is not directly a part, but which have an indirect influence on him (Eysenck, 2004). The school policy, the media and the work of the parents are, for example, in the exosystem (Ashiabi & O’neal, 2015). The influence of society is called the macrosystem. The word ‘macro’ comes from the Greek word ‘big.’ This was chosen because it was thought to be the most comprehensive system. This system includes cultural and social norms and values that affect the development of the individual, examples of which are religious influence and gender norms (Hayes et al., 2017). The macrosystem consists of the society and subculture to which the child belongs. This is specifically about the person’s belief system, lifestyle, patterns of social interactions and life changes (Urban et al., 2009). These systems are seen as a set of instructions for the other three systems. For example, democratic ideas influence the exosystem, such as parent’s occupation (Hayes et al., 2017).
Figure 1: Bronfenbrenner’s Bioecological model of development presenting the multiple
contextual levels. (Teigland et al., 2018)
According to this model, external environmental factors influence the development of a child (Berns, 2006). Bronfenbrenner’s model organizes these external factors in the layers of his model (Bronfenbrenner & Morris, 2007). The strongest variant of this model assumes that it is the current environment, throughout development, that has the most important influence on social-emotional functioning. If the environment changes, then the individual also changes. An example can be the Covid-19 Pandemic of 2020 which had great impact on the child’s environment, by not attending school or attending any social activities (OECD, 2020a). This would mean that every trait of a child can be adjusted, provided that the right environment is offered. This dynamic view contrasts strongly with earlier environmental models in which the environment was still seen as a factor that only applies in early childhood. The social environment in which the child grows up plays an important role in this model. These are for example the mother, father, grandparents, peers, siblings (Ashiabi & O’neal, 2015). On the basis of insights into the important role of the environment, the bioecological model of Bronfenbrenner (2007) was created. Given that environments can be changed, the clinical models have also made the clinical perspective important and various applications have been developed, behavioral therapy being an example of this (Wal & Wilde, 2017).
5. Method
5.1 Study design
This study is part of a larger study and uses the data from one of the researchers in the CHILD group at Jönköping University. This study is a quantitative-based cross-sectional design, which helps to compare the different datasets. Quantitative research involves testing a theory developed in the form of a conceptual model using hypotheses (Vogt, 2011). For the researcher, conducting quantitative research means operationalizing a theory as carefully as possible and then measuring it based on variables. The researcher is 'charged' in the way in which he did this methodically and technically, based on the triad paradigm, methodology, method and overview of the quantitative research approach.
5.2 Participants
The final participants chosen for this study were 191 children and youth from South Africa and China with Intellectual Disability. All 191 children filled in the questionnaire correctly and they were voluntarily involved. Participants included 75 females and 116 males between the ages of 6 and 21. The data of all participants in this study was part of a larger study and thus is secondary data. The data set from China included children and youth aged 5-21 years with intellectual disability, who were recruited using a convenience sampling method of outpatients of children’s hospitals and students at special needs schools and mainstream schools in Tianjin and Hebei provinces in mainland China. Data collection took place from May 2017 to January 2019. A sample of 125 children and youths with ID (intellectual disability) was used for this study. In South Africa, children and youth aged 6-21 years were selected using a convenience sampling method, with a sample of 66 children with ID. Children with ID were suitable for inclusion if they attended special education for children with ID or if they were diagnosed with mild or moderate ID.
5.3 Data collection
The data was collected in South Africa and China, in order to get a variety of participants. Data was collected by clinical researchers or specially trained people with knowledge about the target group and the Picture My Participation tool. The parent-report survey was used to collect
data set was made. This data set included the following variables: Child with ID (personal code), Country, Age, Gender, Residential area and level of attendance per activity. Within both countries all four points of the scale were used for all 20 items.
All the participants and their caregivers were educated of the purpose and processes of the study. The PmP-C (Simplified) contains 20 items and is available in a paper-based questionnaire format. Pictures are provided to support the assessment for the purposes of better understanding of the 20 items and illustrating the different possible replies for frequency of attendance (Willis et al., 2015). For data analysis, the Likert scale is presented with the following values: The four-point Likert scale for attendance (1 = never; 2 = rare; 3 = sometimes; 4 = always).
5.4 Instrument
The tool Picture My participation (see appendix A) was designed in 2014 and is intended for children and youth from 5 to 21 years. The picture my participation tool is a developing product which can measure the child’s participation in an activity. It measures participation in 20 different home, community and social activities. It is a self-rating tool that allows children to answer the questions independently through pictures (talking mats) that allow children to understand the questionnaire better. Parents were asked to fill out a consent letter and demographic information of the child. An assent letter for children was filled out. In order to conduct the interview with the child follow equipment was used: Talking Mat (Piece of carpet to display the Picture cards on), Copy of each image for each activity, Picture my Participation Response Score sheet: child (see appendix A), pen or pencil for recording. The tool has been designed for people from any background, additional training is not necessary. However, a self-directed eLearning tutorial is available for people who are new to PmP. The tool intention is to elicit the voice and perspective of children about their own participation. It can be applied to any culture as long as the 20 items are adjusted so that the child can relate to them. As stated above, the term ‘participation’ can be measured in two ways, frequency (attendance) and perceived involvement (engagement). The interview with the child has a duration of 30 minutes, considering the child’s age (Arvidsson et al., 2019). The PmP-C (Simplified) uses culturally perceptive images and organized approach to help children identify participation from four aspects:
(1) frequency of attendance of an activity
(2) level of involvement when performing an activity
(3) choice of three important activities determined independently (4) evaluation of perceived barriers to and facilitators of participation
The main focus of this study however was on the frequency of attendance, which is applied as how often a child partakes in activities through a range of life situations.
Table 1. Attendance scoring table
Score Level Definition
4 Always The child attends all of the time 3 Sometimes The child attends some of the time 2 Not really The child occasionally/ rarely attends 1 Never The child does not attend
5.5 Data analysis
The questionnaire involved four binary variables which were used for this study: age, country, gender and residential area. Data from South Africa and China was used. Two data sets were combined and filtered in order to answer the research questions correctly, using IBM Statistics SPSS version 25 (Vogt, 2011). The sample consisted of 191 children with intellectual disability and was 60 % Male and 40 % Female. Males are more likely to be diagnosed with intellectual disability than females (Johnson, 2009).
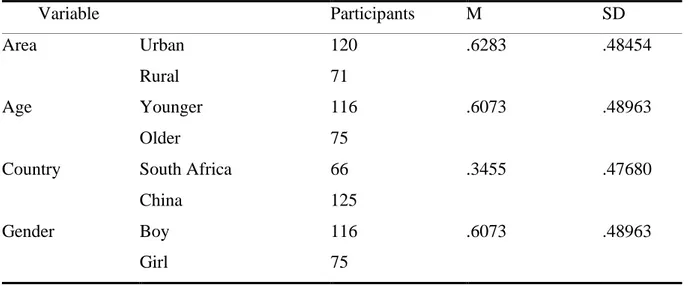
Table 2. Descriptive statistics on participants with intellectual disability (N=191). Including
mean (M) and standard deviation (SD).
Variable Participants M SD
Area Urban 120 .6283 .48454
Rural 71
Age Younger 116 .6073 .48963
Older 75
Country South Africa 66 .3455 .47680
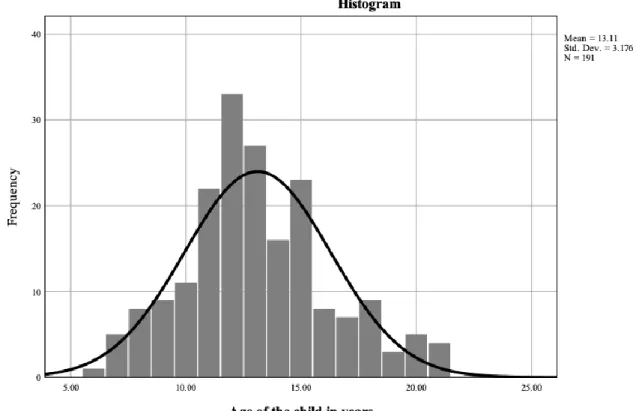
The table above shows descriptive statistics of the given data which has been collected through the PmP CHILD group. Area is coded as 0 = Rural and 1 = Urban. Age is coded as 0 = Younger and 1 = Older. Country is coded as 0 = China and 1= South Africa. Gender is coded as 0 = Girl and 1 = Boy. The variable of Age has been divided into two categories, with ‘Younger’ meaning the children aged below and equal to 13 years of age and ‘Older’ meaning the children between 14 and 21 years of age. The mean of the age of the children, which is visible in Figure 2 below, was 13.11 years (SD = 3.2) so therefore it was chosen as the dividing factor for the variable ‘age’.
Figure 2. Histogram of the age of the child (N = 191)
Note. The Mean of the Age is 13.11 with a Standard Deviation of 3.2.
The relevance and meaning of the 20 elements of Picture My Participation were assessed in frequency counts of the selection of the 20 elements of the Picture My Participation tool. Data was exported to IBM Statistics SPSS version 25 and analyzed. Both datasets were combined into one file in order to work with the data correctly. Four different analyses were conducted in SPSS: frequencies, independent sample T-test, Mann-Whitney U test and a multiple linear regression (Abbott, 2017). Research question one was answered by conducting an Independent
sample T-test. Research question two, which compares the results of an independent variable, was analyzed by using frequencies comparing means. In order to test whether the values of the ordinal variable differ between two separate groups the Mann-Whitney U test was applied (Abbott, 2017). To approach research question three, which questions what factor can have the biggest influence on the participation of the child, a multiple linear regression analysis was conducted.
The mean of participation of each child was calculated by computing a new variable and using the Function ‘Mean’ in the numeric expression box, subsequently each of the 20 activities was added and calculated. The new variable ‘Participation Mean’ showed the average data of participation. The range is between 1 and 4. So when a child would answer ‘always’ (4) for every activity the average would be calculated as followed: 4 x 20 / 4 = 4 = mean participation. Since the activity variables (Personal Care, Family mealtime etc.) were coded as 1 (never) 2 (not really), 3 (sometimes) and 4 (always) the mean was calculated.
5.6 Reliability and validity
Carrig and Hoyle (Panter et al., 2011, Chapter 5) distinguish between validity and reliability in terms of guaranteeing quality in research. The reliability of the research was increased as the questionnaire had been tested beforehand and as it showed steady results. The results can be generalized to a limited extent, because the participants form a selected sample and are thus not entirely representative of the population. However, the sample is of sufficient size, which contributes to reliability. Arvidsson et al. (2019) describe the content validity and usefulness of the tool Picture my participation to measure the attendance and involvement of a child in everyday activities. Since the tool covers a range of different home, social and community activities, for the given target group, it improves the content validity. It is also stated that it is enough to measure only attendance when it comes to exploring the overall effect of participation. However, when it is applied to individual children and used to develop a personal intervention plan, then attendance and involvement should both be considered (Arvidsson et al., 2019).
The validity concerns the influence of the research on systematic errors (Panter et al., 2011). A threat to the validity of the study may be that the respondent interprets the four points on the
approaching the results of the questionnaire. Another thing that may have had a negative impact on the internal validity of the study is the fact that the exact way the respondents were interviewed is unknown, since it is secondary data. Yet, since every participant was anonymous and he/she had just a personal code, analyzing the data occurred in an objective manner, which improved the validity of this study.
6. Ethical Consideration
Before discussing the results of the analysis in the next chapter, it is important to consider the ethical considerations of this research. Ethical considerations are important in the design and implementation of a study (Daley et al., 2013). In all social science research, it is important to adhere to basic ethical principles. This is even more important when working with children and youth, since they cannot necessarily assess possible risks associated with the research. This means that the consequences of a research must be acceptable and must not cause any damage to the participants. This was taken into account in various ways during the design and implementation of this study. Since the data is secondary data it has been approved by the Ethics Committee boards of both countries, including the relevant local department of education and hospitals (Arvidsson et al., 2019). Consent was given by the parents/caregivers through a letter of consent. The collected data is anonymized and cannot be directly traced back to the child. The respondents are numbered and labeled, excluding the name of the interviewed person.
According to Rosnow and Rosenthal (in Panter et al., 2011, chapter 3) there are three fundamental principles of research ethics that should be considered. The first principle is to have respect for the individual. The potential participants in a research project are considered to be independent agents. In order for them to be able to decide autonomously for or against participation, they must be given information that they can understand (Panter et al., 2011). Each child in this study took part in the questionnaire voluntarily. The participants were informed of the possibility to withdraw from the interview any time they wanted. The dignity of people who cannot make autonomous decisions deserves special protection; this includes children in general but especially children with a disability (Abebe & Bessell, 2014). Therefore, a letter of informed consent was sent to the parents and caretakers before conducting the interviews, asking for their approval by signature. The letter included information about the
project, the people involved, the objectives and the expected effort. It was made clear that the participation would occur without any constraint or pressure. Only then informed consent is valid. Research with children under the age of 16 is only allowed if it complies with special rules. Youth between 12 – 16 years take part with either their parents or their guardian. For children under the age of 12, both parents or their guardian must give written permission (Beazley et al., 2009). The principles of beneficence entail the responsibility not to harm other people, to minimize risks and to maximize the benefits. To ensure this, the researcher is obliged to take active action that promotes and benefits the well-being (especially life, health and quality of life) of the participant. This study aims to find possible factors that can influence the participation of a child, which can then lead to creating an intervention which can improve the participation of the child. The third principle describes the importance of justice in the researcher. The benefits and risks of research should be equally distributed and the participants should be treated fairly (Panter et al., 2011). One group should not benefit from research more than the other without good ethical justification. The selection of the test subjects should also be fair: the participants should not be selected because they are easily accessible to the researcher. The participants in this study were selected by clinical researchers or specially trained people with expertise about the target group. Every child in this study was treated equally.
7. Results
7.1 Independent Samples T-test per variable
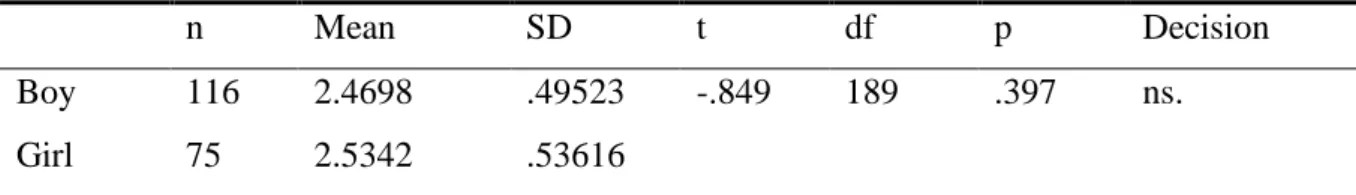
Four independent-samples T-tests were conducted to compare means of participation per child among the four main variables. The four variables were area, age, country and gender. The T-test is used to compare the averages of up to two groups. Below the average participation of all children was compared to each variable individually. There was no significant difference (ns.) in the scores for Urban (M = 2.5, SD = 0.56) and Rural (M = 2.4, SD = 0.40) conditions; t (189) = -1.8, p = 0.076 (Table 3) There was no significant difference (ns.) in the scores for Younger (M = 2.5, SD = 0.56) and Older (M = 2.5, SD =0.43) conditions; t (189) = -0.4, p = 0.695 (Table 4). There was a significant difference (S) in the scores for South Africa (M = 2.8, SD = 0.61) and China (M = 2.3, SD = 0.38) conditions; t (189) = -5.7, p = .000 (p < 0.05) (Table 5) There
Children with intellectual disabilities in South Africa have a higher participation rate on average than children with intellectual disability in China. Children in South Africa are participating more in everyday activities than children in China. This is seen in table 5 where the average is 0.4 higher for South African children than for Chinese children. All other three variables are statistically insignificant.
Table 3. T-test results comparing rural and urban area on participation mean of the child
n Mean SD t df p Decision
Urban 120 2.5456 .56217 -1.786 189 .076 ns.
Rural 71 2.4097 .40060
Table 4. T-test results comparing age on participation mean of the child
n Mean SD t df p Decision
Younger 116 2.5068 .55887 -.393 189 .695 ns.
Older 75 2.4770 .43037
Table 5. T-test results comparing South Africa and China on participation mean of the child
n Mean SD t df p Decision
South Africa
66 2.7646 .60838 -5.719 189 .000 S.
China 125 2.3528 .38397
Table 6. T-test results comparing boys and girls on participation mean of the child
n Mean SD t df p Decision
Boy 116 2.4698 .49523 -.849 189 .397 ns.
Girl 75 2.5342 .53616
7.2 Average participation per country per activity
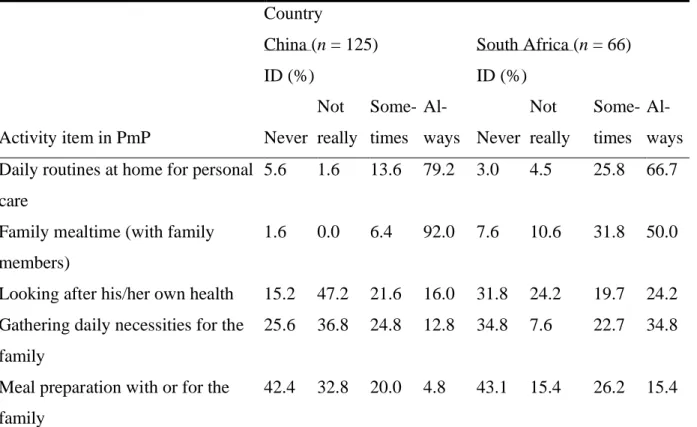
Per country the results on level of attendance of participation per activity are visible below in table 7 and table 8. Table 7 shows the exact percentage on each answer that was chosen from the attendance scale (measured from always to never). In South Africa Caring for animals and Caring for family are both higher than in China. Family mealtime however is higher participated in than in South Africa. Family time is then again higher in South Africa.
By simply looking at the averages of each country per activity one can observe some differences. For instance, attendance in Family Mealtime is higher for Chinese children (M = 3.9) compared to South African children (M = 3.2) and it is statistically significance. The variable Caring for family is higher for South African (M = 3.0) children compared to Chinese children (M = 2.2). In the ordinal variables Taking care of other family members, Family/community celebrations and Spiritual activities, children in South Africa also scored much higher than children in China. A Mann-Whitney U test was conducted to analyse the statistical significance per item for each country. The Mann-Whitney U test is a non-parametric test for comparing a (semi-) continuous variable between two independent (unpaired) groups. Out of 20 items, n = 15 showed significant differences in the mean scores.
Table 7. Proportion of children who chose level of participation in each activity
Activity item in PmP
Country
China (n = 125) South Africa (n = 66)
ID (%) ID (%) Never Not really Some-times Al-ways Never Not really Some-times Al-ways Daily routines at home for personal
care
5.6 1.6 13.6 79.2 3.0 4.5 25.8 66.7
Family mealtime (with family members)
1.6 0.0 6.4 92.0 7.6 10.6 31.8 50.0
Looking after his/her own health 15.2 47.2 21.6 16.0 31.8 24.2 19.7 24.2 Gathering daily necessities for the
family
25.6 36.8 24.8 12.8 34.8 7.6 22.7 34.8
Cleaning up at home (laundry, rubbish etc.)
17.6 33.6 25.6 23.2 10.6 21.2 40.9 27.3
Taking care of other family members
30.4 27.2 32.0 10.4 12.1 12.1 34.8 40.9
Taking care of animals 62.4 23.2 8.0 6.4 31.8 19.7 18.2 30.3 Interact with the family 22.4 26.4 29.6 21.6 6.1 10.6 43.9 39.4 Family/community celebrations 26.4 46.4 23.2 4.0 10.6 16.7 34.8 37.9 Playing with children in the
community
32.0 21.6 36.0 10.4 19.7 13.6 30.3 36.4
Organised leisure activities (sport, clubs)
23.2 30.4 31.2 15.2 18.2 15.2 33.3 33.3
Quiet leisure (listening to music, reading)
12.0 32.8 28.0 27.2 15.2 19.7 27.3 37.9
Religious and spiritual gatherings/ activities
60.8 29.6% 7.2 2.4 13.6 22.7 27.3 36.4
Shopping and errands (market) 14.4 34.4% 36.0 15.2 15.2 19.7 31.8 33.3 Taking part in social activities in the
community (parties, play group, parades)
52.8 32.8 13.6 0.8 53.8 18.5 15.4 12.3
Visit to health centre 21.6 51.2 22.4 4.8 16.7 19.7 39.4 24.2 Formal learning at school 7.2 2.4 12.0 78.4 7.6 4.5 33.3 54.5 Overnights visits and trips 32.8 37.6 19.2 10.4 15.2 19.7 37.9 27.3 Paid and unpaid employment 76.8 16.0 6.4 0.8 55.4 12.3 16.9 15.4
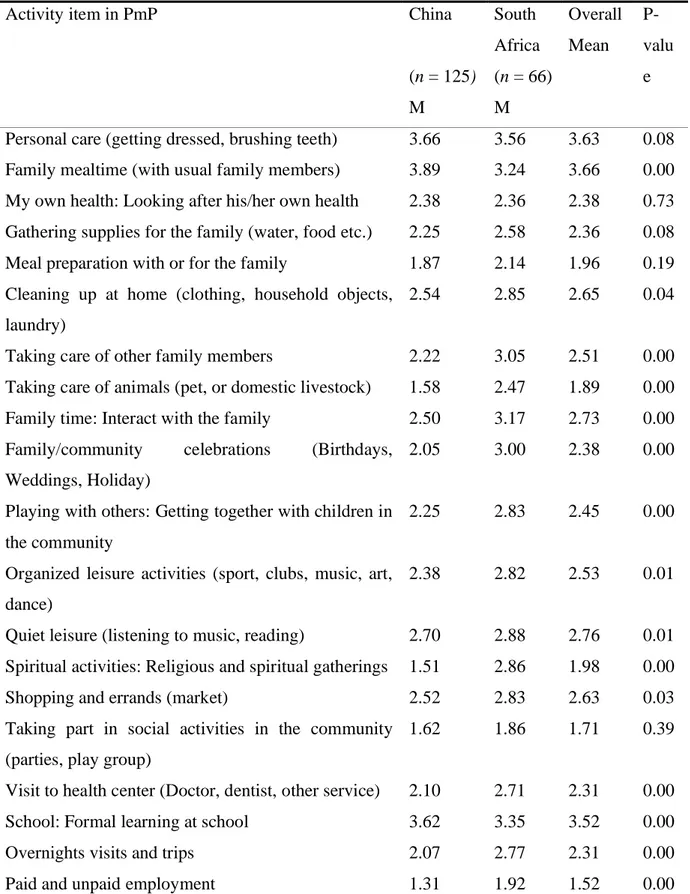
Table 8. Mean scores (M) for South Africa and China on level of participation in everyday
activities. Scale ranges from 1 (never) to 4 (always).
Activity item in PmP China
(n = 125) M South Africa (n = 66) M Overall Mean P-valu e
Personal care (getting dressed, brushing teeth) 3.66 3.56 3.63 0.08 Family mealtime (with usual family members) 3.89 3.24 3.66 0.00 My own health: Looking after his/her own health 2.38 2.36 2.38 0.73 Gathering supplies for the family (water, food etc.) 2.25 2.58 2.36 0.08 Meal preparation with or for the family 1.87 2.14 1.96 0.19 Cleaning up at home (clothing, household objects,
laundry)
2.54 2.85 2.65 0.04
Taking care of other family members 2.22 3.05 2.51 0.00
Taking care of animals (pet, or domestic livestock) 1.58 2.47 1.89 0.00 Family time: Interact with the family 2.50 3.17 2.73 0.00 Family/community celebrations (Birthdays,
Weddings, Holiday)
2.05 3.00 2.38 0.00
Playing with others: Getting together with children in the community
2.25 2.83 2.45 0.00
Organized leisure activities (sport, clubs, music, art, dance)
2.38 2.82 2.53 0.01
Quiet leisure (listening to music, reading) 2.70 2.88 2.76 0.01 Spiritual activities: Religious and spiritual gatherings 1.51 2.86 1.98 0.00
Shopping and errands (market) 2.52 2.83 2.63 0.03
Taking part in social activities in the community (parties, play group)
1.62 1.86 1.71 0.39
Visit to health center (Doctor, dentist, other service) 2.10 2.71 2.31 0.00
School: Formal learning at school 3.62 3.35 3.52 0.00
Overnights visits and trips 2.07 2.77 2.31 0.00
7.3 Multiple Linear Regression
A multiple linear regression was conducted to predict the average participation of the child based on Area, Age, Gender and Country. The results revealed that Area, Age and Gender are not statistically significant predictors to the model (p < 0.05). However, the results of the regression in table 10 revealed a statistically significant association between the participation of the Child (Dependent Variable) and the Country where the child is from.
Table 9. Model summaryb with all four predictors
Model R R Square Adjusted R Square Std. Error of the Estimate 1 .390a .152 .134 .47579
a. Predictors: (Constant), Area, Age Group, Gender Child, Country b. Dependent Variable: Average Participation
The R Squared above shows us the Goodness of fit for the model in table 8. The regression model counts for 15.2 % of the variance in the average participation, which means that 84.8 % of the variation cannot be explained by these four factors alone.
Table 10. Summary of multiple linear regression analysis for children’s average participation
Model Unstandardized Coefficients Standardized Coefficients t Sig. B Std. Error Beta 1 (Constant) 2.339 .091 25.792 .000 Gender Child -.025 .071 -.024 -.344 .731 Country .400 .074 .373 5.387 .000 Age Group -.014 .072 -.013 -.189 .850 Area .066 .073 .062 .904 .367
a. Dependent Variable: Average Participation
While Country contributed significantly to the model (B = .400, p < 0.05), Gender (B = -.025, p = 0.7), Age (B = -0.01, p = 0.85). and Area (B = 0.07 p = 0.4) did not.
Table 11. Model summaryb without the country variable Model R R Square Adjusted R Square Std. Error of the Estimate 1 .141a .020 .004 .51019
a. Predictors: (Constant), Area, Age Group, Gender Child b. Dependent Variable: Average Participation
The R square in table 11 shows us that when we take out the Predictor Country (p < 0.05) the goodness of fit is very low with R Square = 0.02. Which displays that only a small percentage of the difference can be explained by the variables.
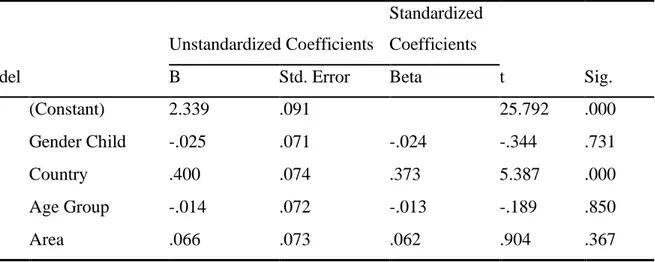
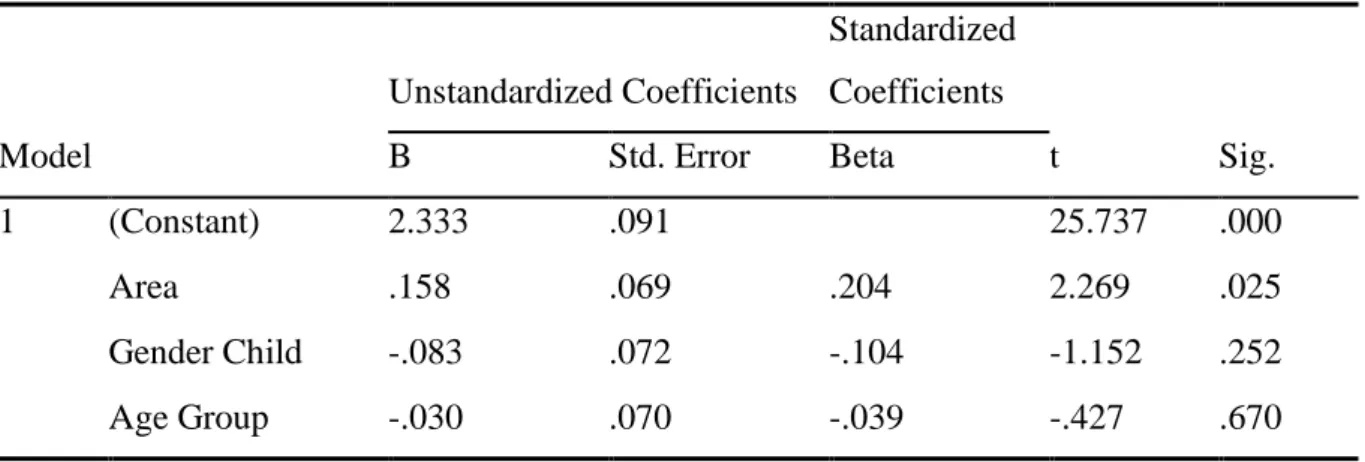
7.3.1 Multiple Linear Regression per country
A multiple linear regression was conducted to predict the effect of Area, Gender or Age on the participation of the Child per Country. The analysis with cases only from South Africa (table 12) below shows that none of the predictors are statistically significant (p > 0.05). The analysis with cases only from China (Table 13) shows that Age (Beta = -0.04, t (125) = -0.4) and Gender (Beta = -0.1, t (125) = -1.2) did not significantly predict the level of participation, Area however did significantly predicts the level of participation (Beta = 0.2, t (125) = 2.3, p < 0.05). Since Area was coded as 0 = Rural and 1 = Urban children living in an urban area have a higher level of average participation (B = 0.158).
Table 12. Summary of multiple linear regression analysis for South Africa average
participation Model Unstandardized Coefficients Standardized Coefficients t Sig. B Std. Error Beta 1 (Constant) 2.819 .194 14.538 .000 Area -.190 .174 -.138 -1.090 .280 Gender Child .095 .152 .078 .623 .535 Age Group .052 .164 .040 .317 .752
Table 13. Summary of multiple linear regression analysis for China average participation Model Unstandardized Coefficients Standardized Coefficients t Sig. B Std. Error Beta 1 (Constant) 2.333 .091 25.737 .000 Area .158 .069 .204 2.269 .025 Gender Child -.083 .072 -.104 -1.152 .252 Age Group -.030 .070 -.039 -.427 .670
a. Dependent Variable: Average Participation b. Selecting only cases for which Country = China
8. Discussion
Overall, this study attempted to investigate how children with intellectual disabilities from South Africa and China participate in everyday life activities. In this study the focus is on 191 children from South Africa and China, ages 6 to 21, who have intellectual disabilities. The results show that the country of residence is the strongest predictor to participation and the attendance in everyday activities. This brings us back to the theory by Uri Bronfenbrenner (Bronfenbrenner & Morris, 2007) who stated that the culture of a country can have a great impact on the child’s development. In comparison South Africa is a more collectivistic country (Probst et al., 1999) than China, who tends to become more and more individualistic (Steele & Lynch, 2013).
8.1 Participation in everyday activities for children with ID
Primarily, the importance of children's participation is recognized by the International Convention on the Rights of the Child (UNCRC, 1989). The right to participate is strongly related to the best interests of the child. Especially children with a disability should be participating regularly in activities that promote inclusion. The results that were collected among children with ID, show to what extend they each take part in certain activities. In order to answer this research question, each of the 20 items show the mean value per country and to what extend they participate. Table 7 shows the exact percentage of the chosen answer per activity. Looking at the first variable which describes the personal care of a child it can be seen that the attendance is very high (M = 3.63) along with the items Family mealtime (M = 3.66)
and attending School (M = 3.52). All other items score below 3.0 which stands for sometimes in the PmP questionnaire. Looking at variables that are connected with circumstances around the child happening outside of his home, we can see that the children score lower. These items can be categorized into the exosystem and the macrosystem of the bioecological model of human development. The exosystem also includes factors that affect a child's life. However, the elements of this system have no direct relationship to the child, it mainly relates to the parent’s relations which then affect the child. The macrosystem contains the cultural elements that influence the child and everyone around him. Items that score lower than 2.0 (not really) are: Taking care of animals (M = 1.89) Spiritual activities/ gatherings (M = 1.98), Taking part in social activities in the community (M = 1.71) and Paid and unpaid employment (M = 1.52). It can also be seen that the score for the variable ‘Meal Preparation’ is quite low with an average rating of ‘not really’. A possible reason for this can be that children with ID find it difficult to concentrate on one activity for a longer time. Children with intellectual problems also want to be able to do things by themselves, but that often does not work. They need help from others (Koenderink, 2018). Repetition and clear instructions are therefore necessary.
Certainly, as the restriction becomes more serious, playing is not self-evident and does not always happen spontaneously. For a child with a severe disability, the world is not an enticing, inviting world to explore. They will process the stimuli and information from their environment differently and with more effort (Koenderink, 2018). We can see in the results that children score low in Playing with others (M = 2.45) and Organized leisure activities (M = 2.53). Precisely during these situations, children can learn how to interact with others. In the microsystem of the bioecological model more extended connections and relations of the child take place, on the playground or in the neighborhood. Microsystems of younger children are dependent on the decisions of the parents and are often limited to the family, the relatives, friendships and contacts of the parents, the pediatrician and other specialists from the social or medical field or the day care center (Bronfenbrenner & Morris, 2007). However, children with intellectual disabilities and their families often live an isolated life. Social Isolation among families with children with a disability has been studied thoroughly in the last couple of years. Baumgardner (2019) notes that shame and powerlessness are factors that lead to family isolation. These families are rejected as if they were overprotective or responsible for their own suffering. They can also feel envious of parents who have healthy children. During all kinds of
Handbook of Intellectual Disabilities (Matson, 2019) mentions the importance of organizations specialized in child and youth psychiatry who should offer guidance and support to prevent problems for the child later in life (Matson, 2019). As mentioned earlier, others are ‘distressed’ by the behavior and practices of the child with ID. That is the reason that parents of these children must be helped and guided on how to deal with their child in a constructive way, while it also remains peaceful within the family. The mesosystem in the bioecological model describes the connection that takes place between the child and its environment, the child’s social network. According to Bronfenbrenner (2007), the development-promoting potential of this system increases if the activities and goals in the individual areas of life are compatible with one another (Bronfenbrenner & Morris, 2007, p. 810).
8.2 Differences and similarities in participation between China and South Africa
The current study looks at two specifically chosen countries from where the data has been collected. According to the World Bank (World Bank, 2019) both China and South Africa are considered to be Upper middle-income countries. The results of this study show that South Africa scores higher for many community focused activities than China. Taking care of other family member mainly scores ‘sometimes’ for South Africa and for China the mean is ‘not really’. Same can be seen for the item ‘taking care of animals’ where South Africa lies closer to ‘sometimes’ and China to ‘not really’. Other items that show a difference between the two countries and that tested on significance are (see table 8): Overnights visits and trips, Attending school, Paid and unpaid employment and Organized leisure activities. When comparing the two countries 75 percent of all the activities are statistically significant. Table 7 shows an overview of average responses per activity per country. This means that there is an exceptionally large effect and that this effect is very consistent across a large group of children. In relation to the unemployment rate, considering the GDP and the economic status of the country we can see that the results show a strong difference between the two countries. In this case we can recognize that Bronfenbrenner’s (2007) Macrosystem influences the child’s everyday life because it determines how the other systems can express themselves. However, this too is a case of indirect influence. Nevertheless, it affects the child's development because it changes the groups that directly affect the child. In South Africa the children with ID have a higher chance to take part in leisure activities, taking care of family member or taking care of the animals. In South Africa the social environment of the child is more visible which can carefully be traced back to the macrosystem of the country.
The Organization for Economic Co-operation and Development (2020) states that South Africa has a strong sense of community. In this country 88 % of the population has a person in mind where they know they can rely on at any time, largely in line with the OECD average of 89% (OECD, 2020b). According to the United Nations Development Program China (2016) the majority of people living in China's major cities feel lonely and overburdened. The one-child policy of China has been in place for over 30 years. These facts can be identified from the results that were measured with the PmP questionnaire. Another major difference between the two countries can be seen in the results for the item ‘Spiritual and religious gatherings’ where South Africa has M = 2.86 and China M = 1.51. According to the World Factbook (Central Intelligence Agency, 2020) around 52 % of the Chinese population is not affiliated with a religion, yet in South Africa that number lies at 5% of the population. 82 % percent of the population in South Africa are Christian. Bronfenbrenner (2007) places these characteristics of a country into the macrosystem of the bioecological model of human development. The macrosystem includes effects of migration, the school system, religion in a society, for example. It influences expectations regarding parenting style, the provision of support services or dealing with social disadvantage. Van der Weele (2017) discusses the matter that a more religious country can lead to a stronger community and less loneliness and isolation. A stronger community can therefore lead to a stronger support system and can so have a greater positive impact on the development of the child. The results above show a clear difference with South Africa having a higher attendance in spiritual activities with an average of ‘sometimes’ compared to China with an average of ‘never’.
There are also several similarities among the average participation of the child between both countries. Equally Chinese and South African children show a high rating for Personal Care (always), which shows that both groups are almost always getting dressed, brushing teeth etc. by themselves, here there is no significance present (see table 8). Other items where both countries show a similar result and no significance: Looking after his/her own health (not really), Cleaning up at home (sometimes), Playing with others (sometimes), Shopping and errands (sometimes) and Visit to health center (not really). Each item can be placed in the microsystem and the exosystem. Surprising to see is that the rating for visit to health center, playing with others and shopping is quiet low for both countries. The significance values are all above 0.05 which can be seen in table 8. All activities are in some way connected with the
countries have a certain negative way of thinking about children with disabilities. Most Chinese believe a disability is something one has to overcome or something one has to be sorry for. In the public these people are invisible (Campbell & Uren, 2011). Same can be said for South Africa, where some still believe disability comes from witchcraft (Thsitake et al., 2013). Dusseljee et al. (2011) conducted that same type of research among children with ID in the Netherlands and the results show that even though that attendance in certain activities was higher than other countries they rarely interacted with children without ID (Dusseljee et al., 2011). Without increased social protection and support, people with disabilities can face serious social barriers and remain invisible to the rest of society. It is vital to prevent this in the early stage of the child’s development, with a goal to integrate the child as much as possible in group activities and community focused events.
8.3 Influence of country and culture on child’s participation
A multiple linear regression (table 12) showed a statistical significance between the independent variable ‘Country’ and the dependent variable ‘Mean Participation. After conducting this regression with all four independent variables it can be concluded that South African children with ID rate themselves higher in attending everyday activities compared to Chinese children with ID. The two variables age and gender do not predict the level of participation of the Child with ID. From birth on children are in contact with their environment. They need that environment to grow from utter helplessness to an independent human being. The study by Baker and Donelly (2010) show that each child is oriented to the world in its own individual way. Character and temperament play a role, as do the examples that provide the environment. However, it also shows that for age and gender it does not make a difference (Baker & Donelly, 2010). Therefore, we can predict that the country where the child grows up in has a stronger influence on the participation in everyday activities, compared to the other factors age, gender and residential area. Earlier, the main differences and similarities between China and South Africa have been concluded. The influential factor ‘Country’ will be discussed with the use of Bronfenbrenner’s bioecological model of development. The macrosystem relates to the general social principles associated with the world view, religion or social vision within a country (Bronfenbrenner & Morris, 2007). It is the cultural blueprint of society, which is reflected in the institutions of that society. For example, African society has a higher value for the community living in comparison to the Chinese society (Thsitake et al., 2013). In South Africa social problems are solved together with help from the family and the neighborhood.