perspective
Kerstin Eriksson
Jönköping University School of Health and Welfare Dissertation Series No. 080 • 2017
School of Health and Welfare, Jönköping University P.O. Box 1026 SE-551 11 Jönköping Tel. +46 36 10 10 00 www.ju.se Printed by Ineko AB 2017 ISSN 1654-3602 ISBN 978-91-85835-79-9
Abstract
Background: Pain is a common postoperative experience. Guidelines recommend performing regular pain assessments, which include self-rated pain and additional communication to capture patients' experiences. During hospitalisation, pain intensity is found to be a vital factor influencing other aspects of an early physical recovery, and is consequently an important item
in questionnaires for recovery. These tools consist of extensive
questionnaires which are difficult to use in everyday clinical work. A simplified method of monitoring postoperative recovery would benefit both patients and healthcare professionals.
Aim: The overall aim of this thesis was twofold: (A) to determine the ability
of extending the use of pain ratings to reflect and predict early physical postoperative recovery and (B) to describe patients’ perspectives on pain assessments.
Methods: The studies were carried out at one (I), three (IV) and four
hospitals (II, III) involving general surgical and orthopaedic inpatients. Two quantitative methods were used based on data from questionnaires and medical records. They consisted of one cross-sectional study (I) and one study with repeated measures (IV). An association was sought between pain intensity and postoperative recovery on days 1 and 2 (I, IV), and prehospital data (IV). Two qualitative methods were used involving a
phenomenographic (III) approach and Critical Incident Technique (IV), where semi-structured interviews were performed postoperatively and analysed inductively in accordance with the approach.
Results: An association was found between moderate/severe average pain
intensity compiled from monitoring records and impact on early physical postoperative recovery on day 1 (I). Retrospective average pain intensity at rest and during activity reflected impact on recovery on postoperative day 1 (IV). Severe pain intensity at rest and during activity on postoperative day 1 predicted impact on physical recovery items on day 2 (IV).
The use of the Numeric Rating Scale (NRS 0-10) was considered to facilitate communication about pain, but to involve difficulties of interpretation and place demand on healthcare professionals and care routines (II). Patients’ descriptions of their experiences when in need of describing pain indicated two main areas: patients’ resources when needing to describe pain and ward resources for performing pain assessments (III). Descriptions of their actions
when they were in pain indicated two main areas: patients used active strategies when needing to describe pain or patients used passive strategies when needing to describe pain (III).
Conclusions: This thesis contributes to knowledge about the possibility of
using patients' self-rated average pain intensity to reflect early physical postoperative recovery on day 1 and to predict recovery on the following day. The pain scale gave patients and healthcare professionals a shared vocabulary, which facilitated communication. Furthermore, dialogue during pain assessments was described as critical in ascertaining whether pain intensity had an impact on different aspects of physical recovery. Environmental factors such as the attitude of healthcare professionals, workload and staffing influenced how pain assessments were performed.
Original Studies
The thesis is based on the following studies, which are indicated by Roman numerals in the text:
I
Eriksson, K., Wikström, L., Lindblad-Fridh, M. & Broström, A. (2013). Using mode and maximum values from the Numeric Rating Scale when evaluating postoperative pain management and recovery. J Clin Nurs, 22(5-6), 638-647. doi: 10.1111/j.1365-2702.2012.04225.x
II
Eriksson, K., Wikström, L., Årestedt, K., Fridlund, B. & Broström, A. (2014). Numeric rating scale: patients' perceptions of its use in postoperative pain assessments. Appl Nurs Res, 27(1), 41-46. doi: 10.1016/j.apnr.2013.10.006
III
Eriksson, K., Wikström, L., Fridlund, B., Årestedt, K. & Broström, A. (2016). Patients' experiences and actions when describing pain after surgery - A critical incident technique analysis. Int J Nurs Stud, 56, 27-36. doi:
10.1016/j.ijnurstu.2015.12.008
IV
Eriksson K., Wikström L., Fridlund B., Årestedt K., Broström A. Pain ratings association with the prediction of early physical recovery after general and orthopaedic surgery - A quantitative study with repeated measures. Submitted to
J Adv Nurs.
The articles have been reprinted with the kind permission of the respective journals.
Author contribution
All authors have been involved throughout the process of analysis in Studies I-IV, and have contributed to the interpretation of data, the intellectual content and finalising the manuscripts. Kerstin Eriksson took the main responsibility for Studies II, III and IV. In Study I, the main responsibility was shared equally with Lotta Wikström.
Contents
PREFACE ...1 INTRODUCTION ...2 BACKGROUND ...4 POSTOPERATIVE CARE ... 4 PAIN ASSESSMENT ... 6 POSTOPERATIVE RECOVERY ... 8 COMMUNICATION ... 10 RATIONALE... 11 AIM ... 12 CONCEPTUAL FRAMEWORK ... 13 METHODS ... 14 DESIGN ... 14PARTICIPANTS AND SETTINGS ... 14
DATA COLLECTION ... 15
DATA ANALYSIS ... 21
ETHICAL CONSIDERATIONS... 24
RESULTS ... 26
USING AVERAGE AND MAXIMUM VALUES FROM THE NRS WHEN EVALUATING RECOVERY (I) ... 26
PATIENTS’ PERCEPTIONS OF USING THE NRS IN POSTOPERATIVE PAIN ASSESSMENTS (II) ... 27
PATIENTS’ EXPERIENCES AND ACTIONS WHEN ASSESSING PAIN AFTER SURGERY (III) ... 28
ASSOCIATION OF PAIN RATINGS WITH THE PREDICTION OF EARLY PHYSICAL RECOVERY AFTER SURGERY (IV) ... 31
DISCUSSION ... 35
METHODOLOGICAL CONSIDERATIONS ... 35
DISCUSSION OF THE RESULTS ... 39
THEORETICAL REFLECTION ... 48
CONCLUSIONS ... 51
CLINICAL AND RESEARCH IMPLICATIONS ... 52
ACKNOWLEDGEMENTS ... 60 REFERENCES ... 62 APPENDIX ... 77
1
Preface
Care for patients who have undergone surgery involves working with patients in pain or at risk of experiencing pain. In my work as a pain nurse in the “acute pain service” team, I meet these patients and face the challenge of trying to understand how they experience their pain. I also meet healthcare professionals who have issues in terms of comprehending what patients are communicating in their pain assessments. Everyday clinical practice is the starting point for this thesis and it is therefore pragmatic, so the overall aim was approached by using different paradigms. These paradigms are based on dissimilar ontological and epistemological bases, which mean that the methods for carrying out the specific aims differ. Using a post-positivist paradigm implies that studies are conducted on the basis of strict rules and well-defined variables, which seek the truth with the aim of controlling or predicting something. Using an interpretive paradigm, on the other hand, means that the studies are performed on the basis of subjects’ experiences in
order to explain and obtain a deeper understanding of a phenomenon. The
results of this thesis will constitute the basis for further research in terms of identifying and eventually facilitating early physical postoperative recovery in patients. In addition, my doctoral research has given me new insights and knowledge in terms of patients' perspectives on pain assessment. This has helped me in individual encounters with patients and influenced descriptions of routines involved in my clinical work. Hopefully, other healthcare
professionals will also find that this thesis facilitates their clinical work and encounters with patients.
Kerstin Eriksson
May 2017
2
Introduction
A large number of patients undergo different types of surgery every day.
Many of them will experience pain 1, 2 where ongoing screening and
assessment is needed 3. National and international guidelines 3-5 recommend
that postoperative pain assessments are performed several times a day. These assessments consist of several parts, one of which involves a patient’s
self-rated pain intensity 3, 5. The purpose of pain assessments is to individualise
pain management and thereby reduce suffering 6. Guidelines for pain
assessments are a way of developing a shared vocabulary, regardless of the healthcare professional with whom the patient is communicating. However, even though healthcare professionals follow guidelines for pain assessment,
patients’ responses may be difficult for them to understand 7. An important
basis for pain assessments is exchange of information. Two-way communication between patients and healthcare professionals is a
prerequisite for information exchange 8. Furthermore, proficient
communication on the part of healthcare professionals allows patients to
participate in decision-making 9, and facilitates sharing information in regard
to assessing pain. However, there is few studies which describes patients’ perspectives of using a pain scale, or their perspective on how the pain assessments are performed. More knowledge about patients' perspectives could help healthcare professionals communicate appropriately with patients in terms of assessing pain.
Pain and its management are vital elements in surgical guidelines for early
and enhanced physical recovery after surgery 10-13. In addition to facilitating
mobilisation by optimising pain management, surgical guidelines focus on aspects such as gentle surgery, avoiding drainage, probes and fluid
administration 14. As well as these guidelines, validated recovery tools have
been developed using patient questionnaires, and these monitor different
dimensions which affect postoperative recovery 15, 16. The recovery tools
include physical, psychological and social dimensions15, 16, of which the
physical aspects of recovery are found to have the greatest impact in the first
days after surgery 17. The physical dimension includes pain, which is found
to be a vital aspect during hospitalisation 18,since pain negatively influences
sleep and mobilisation, for instance 3, 19, 20. Extensive questionnaires
administered soon after surgery, however, limit the number of patients who
3
manage to complete them 21. Furthermore, patients receive a great deal of
information regarding their surgery. It would be useful to avoid additional information and the requirement to fill in questionnaires. A simplified method of monitoring early physical postoperative recovery without having to complete questionnaires would help both patients and healthcare
professionals. Patients' self-rated pain is collected and monitored every day. However, no one has determined the possibility of using self-rated pain to monitor early physical postoperative recovery in individual patients.
4
Background
Postoperative care
In Sweden, postoperative care is required for about 830 000 patients every
year 22. Postoperative care is defined as the care patients receive after
surgery until discharge. The care is based on patients' needs, and may include monitoring vital signs, assessments, treatment, assistance or support
to ensure patients are fit to go home 23. Those who undergo minor as well as
major surgery usually need care afterwards, which can vary in length from a
few hours to weeks. Major surgery is defined by Weiser et al. 24 as any
surgery which takes place in a hospital operating theatre which requires regional or general anaesthesia, or sedation. In this thesis, the definition of major surgery also includes a need to stay in hospital for at least 2 days, based on the current organisational and clinical care situation in Sweden. Furthermore, as patients undergoing orthopaedic surgery are found to have higher pain intensity than those undergoing general surgery, both surgical
groups are included 25, 26. Patients face difficulties during hospitalisation, as
care is influenced not only by the surgery but also by aspects of the environment, which might include lack of continuity in healthcare
professionals’ work schedules27. This leads to an increased risk of
conflicting responses and instructions 28, and is likely to affect pain
management. Both patients and healthcare professionals describe that a
heavy workload limits dialogue and patient participation 28, 29. Furthermore,
responsibility for pain management falls on nurses, as physicians are only
present on the ward for short periods 30, 31.
The main postoperative pain experienced by patients is defined as acute, i.e. “Pain of recent onset and probable limited duration. It usually has an
identifiable temporal and causal relationship to injury or disease” 32. Another
definition, which covers both acute and chronic pain, describes it as “an unpleasant sensory and emotional experience associated with actual or
potential tissue damage, or described in terms of such damage” 33. Implying
pain is a subjective experience and cannot be directly observed by others 34 .
Furthermore, the intensity of pain is not linked to the size of the incision or
tissue trauma 35. Acute pain is common after surgery 2, 25, 35, 36 and has been
shown to restrict patients’ physical recovery 20, which in turn increases the
5
risk of a prolonged hospital stay 37. The purpose of pain management is to
reduce pain, facilitate early physical recovery 38 and reduce the risk of
complications related to severe pain 39, 40. Acute pain consists mostly of
nociceptive elements related to tissue damage, but also involves neuropathic
elements 41. Experiences of pain are affected by cognition, emotions and
behaviour. Cognition includes beliefs, attitudes and patients’ expectations of how they will experience pain. Cognition and emotions, as well as the
environment, influence patients' behaviour when they are in pain 42. Pain is
therefore affected by a number of factors, physiological, psychological and
social, which make the experience of pain complex 41.
Guidelines on pain medicine and surgical specialities provide
recommendations and instructions for pain management and advocate
multimodal treatment 4, 14, 23, 37, 41, 43. Multimodal pain management is
described as treatment involving two or more analgesics with different
mechanisms of action,possibly in combination with non-pharmacological
methods 23, 41, 44 (Table 1). Basic pharmacological treatment consists of
paracetamol and non-inflammatory analgesics, including regional block or infiltration anaesthesia, as basic or supplemental pain treatment. For
moderate to major surgery, pain treatment is complemented with opioids 4, 23,
44. Breakthrough pain is managed with analgesics on demand, according to
general directives available locally at each clinic 45. In addition,
non-pharmacological methods such as music, massage and transcutaneous
electric nerve stimulation may be used 23, 46-48. However, individual needs in
terms of pain management can vary widely between patients 49, 50, and to
capture these variations an individual pain assessment is required.
Table 1. Description of options for postoperative pain treatment inspired by Meissner et al. 37 and Gelinas et al.46.
Systemic pharmacologic
therapy Central and peripheral nerve block, local infiltration Non-pharmacological therapies
Paracetamol epidural TENS
NSAID intrathecal music
opioids peripheral nerve blocks massage
clonidine paravertebral block cooling
ketamine transversus abdominal plane block heating
gabapentin intra-articular distraction
incisional
6
Pain assessment
Patients undergoing surgery are a heterogeneous group who experience pain differently, and their pain may be affected by various factors. The patients differ in terms of age, gender, personal characteristics, comorbidities, type of
surgery 51 and education level 52. Pain intensity is perceived to be highest in
young adults and decreases gradually with age 51, 53. The role of gender in
pain intensity has been debated. Gender has no clinical significance
according to some studies 51, 54, while others demonstrate more intense pain
in females 52, 53. However, anxiety, other forms of mental distress or
pre-existing pain are clearly found to increase the incidence of higher
postoperative pain intensity 51. Comorbidity measured according to the ASA
level (American Society of Anesthesiologists’ classification of physical
status) has been shown to escalate the risk of complications 55 which may
lead to greater postoperative pain 56. Patients with lower levels of education
are found to have a higher pain intensity 57. They ask fewer questions than
those with higher levels of education, have a different communication style and are less inclined to want to be involved in decision-making in terms of
pain management 58. Furthermore, low levels of education combined with
increased comorbidity and postoperative pain increase the risk of chronic
pain 52.
Although self-reported pain intensity is highlighted in the assessment of pain, there are other components to consider, such as location, onset, the
nature of the pain, treatment and presence of chronic pain 5, 41, 43, 44. Asking
questions about where, when and how pain is experienced can provide
information about several of these elements 5. One aspect of the assessment
allows patients to describe their pain and indicate goals, beliefs and
expectations in terms of pain management 41, 43. However, where patients are
unwilling to share their experiences, healthcare professionals are unable to make a proper assessment of their pain. Another difficulty is that some patients give mixed signals, for example denying pain but behaving in a way
that suggests they are in pain 7. Furthermore, there are flaws in adherence to
guidelines as not all healthcare professionals ask patients about pain or rate
their pain on a scale 1, 59.
According to guidelines in different countries, regular pain assessments are
recommended after surgery 4, 5, 41, 43, 44, 60. The guidelines clearly specify that
7 a valid pain scale is to be used and the assessments performed both at rest
and during activity 5, 41, 43, 44. The number of assessments to be carried out
every day is less clear. Some guidelines propose that assessments are to be
performed at suitable intervals 3, 43, 60 while others note that the interval
between assessments depends on different factors (e.g. type of surgery, pain
intensity and patients’ needs) 41, 44. Swedish guidelines are distinct, however,
and suggest every four hours 4. All guidelines recommend that pain
assessments be made at breakthrough pain, and before and after additional
analgesics 5, 41, 44, 60. In Sweden, acceptable pain intensity is considered to be
three or less on an eleven-point scale 4, 5. However, a study from the
Netherlands revealed that many patients declined additional analgesics even when pain was higher than three, which meant that patients were at risk of
being over-treated by using this cut-off point 61, 62. Consequently, patients'
self-rated pain intensity, like the pain experience itself, is subjective, making it difficult to define a specific limit for pain treatment. Despite these
shortcomings, assessing pain intensity using a pain scale is recommended.
Pain scales
The purpose of using a pain scale is to develop a shared vocabulary between
patients and healthcare professionals 61. In most cases a unidimensional pain
scale is sufficient, and measures self-reported pain intensity 63, though if the
pain is complex, multi-dimensional aspects of pain are taken into
consideration (e.g. physical, functional, psychological) 63, 64. Three different
unidimensional pain scales are commonly suggested in pain medicine and guidelines: the Numeric Rating Scale (NRS), the Visual Analogue Scale
(VAS) and the Verbal Rating Scale (VRS) 4, 5, 34, 41, 43, 44, 63. The eleven-point
NRS is preferred by a heterogeneous age group of patients, regardless of the
cause of pain (i.e. acute, chronic or cancer pain) 63, and is considered simple
to use by both patients and healthcare professionals 34. The NRS is available
in different versions, from 0-10, from 0-20 or from 0-100. Zero indicates no pain, while the highest score (i.e. 10, 20, 100) is the outermost endpoint. A review of the endpoints of the NRS showed that almost all users labelled 0 as “no pain”, but the label for the outermost endpoint varied. The most common was “worst pain imaginable”. Other common labels included “maximum pain”, “unbearable pain”, “pain as bad as it could be” and “worst
possible pain” 63. The VAS consists of a plastic ruler with an unmarked 10
cm line, and it has a movable cursor. The beginning of the line is marked ‘no
8 pain’ and the outermost pain is at the other end of the scale. The back of the tool is often marked in millimetres, which means that response options can range from 0-10 or from 0-100. The VRS consists of descriptive words for varying the severity of the pain. It can involve four, five or 15 different words. One example of the VRS is a four-point scale using the words no,
mild, moderate or severe pain 34. All three pain scales (i.e. NRS, VAS and
VRS) are valid and reliable, though the VRS is less sensitive to detecting
changes 34, 65. In clinical work, the NRS 0-10 is advocated as the most
practical pain scale 34, 63-65, since it is easy to use, requires no additional
material and can be used in follow-up phone calls after discharge 34, 64.
Postoperative recovery
Postoperative recovery is defined as “an energy-requiring process of returning to normality and wholeness”, which results in “returning to preoperative levels of independence/dependence in activities of daily living”
20. A casual description of postoperative recovery involves returning to
preoperative conditions 18, 66. Recovery is usually divided into three phases:
in the recovery room, on the ward and at home 17. On the ward, pain
management is an important part of patients’ early physical recovery,
contributing to shorter hospital stays 67, 68. However, patients are rarely
recovered to preoperative level at discharge, so that their remaining recovery
period takes place at home 17, 69. Self-reporting tools have been developed to
monitor patients' recovery. The tools each have a different focus depending on the situation. They can be specific to a particular form of surgery, a
certain recovery phase, or inpatient or outpatient surgery 18.
Monitoring recovery
The recovery tools consist of extensive questionnaires containing one or
several dimensions for measuring patient-oriented outcomes 70, such as
physical symptoms and functions, psychological aspects, emotions,
cognition and satisfaction 18. However, almost all tools contain a physical
dimension, and of all items pain is considered to be of great importance in
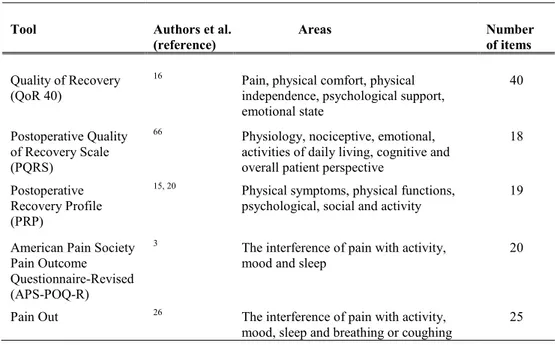
terms of recovery 70. Of 12 different tools for following postoperative
recovery, QoR 40 is recommended during the hospital stay 70. Strickland et
al. identified three tools for monitoring recovery regarding major general and orthopaedic surgery: Quality of Recovery (QoR 40), Postoperative Quality
9
of Recovery Scale (PQRS) and Postoperative Recovery Profile (PRP) 71. The
physical dimension in these tools consists of pain, appetite changes, sleeping
difficulties, mobilisation, personal hygiene 15, 16, 66, ability to breathe easily,
feeling restless, feeling dizzy, itching, normal speech 16 and vital signs 66.
The psychological dimension includes emotions and cognition, and involves
items such as feelings of anxiety, depression and loneliness 15, 16, bad dreams,
feeling in control 16, ability to concentrate 15, 16, 66 and memory tests 66. In the
early phase, in other words the first days after surgery, recovery is largely influenced by the physical dimension. The psychological dimension plays a
greater role in the following days of recovery 17. Physical items are also used
in tools which follow quality of pain management. Onecommonly-used
questionnaire is the American Pain Society Pain Outcome
Questionnaire-Revised (APS-POQ-R), developed for both medical and surgical patients 3.
Another tool is the European Registry Pain Out, an international quality improvement and registry project. The Pain Out questionnaire is partly built on the APS-POQ-R, and is aimed at both general surgery and orthopaedic
patients 26 (Table 2)
.
Table 2. Approaches to measuring recovery after major general and orthopaedic surgery; developers, areas and items in each tool.
Tool Authors et al.
(reference) Areas Number of items
Quality of Recovery (QoR 40)
16 Pain, physical comfort, physical
independence, psychological support, emotional state
40
Postoperative Quality of Recovery Scale (PQRS)
66 Physiology, nociceptive, emotional,
activities of daily living, cognitive and overall patient perspective
18
Postoperative Recovery Profile (PRP)
15, 20 Physical symptoms, physical functions,
psychological, social and activity 19
American Pain Society Pain Outcome Questionnaire-Revised (APS-POQ-R)
3 The interference of pain with activity,
mood and sleep 20
Pain Out 26 The interference of pain with activity,
mood, sleep and breathing or coughing
25
10
Communication
All carebegins with communication, verbal and non-verbal 72, and in pain
assessment communication is a key element 41, 43. Communication has been
summarised in three parts: the content of what is said, how the dialogue is
structured and the values underpinning the dialogue 73. An example of
non-verbal components which affect communication involves the way we
express ourselves with gestures, postures and facial expressions 58, 72. In
addition, when healthcare professionals focus on practical tasks, they give
patients signals about what are important 31, 74-76. Further components
influencing communication include culture 42, 77, language 77, education 78,
social background 42, 78, the generation gap, health problems 79 and workload
80. If patients are capable of communicating pain, it is easier for healthcare
professionals to recognise their problems, such as the pain itself and influences on their recovery. On the other hand, those who have difficulties describing pain, and who deny it despite having non-verbal signs of pain, require further dialogue with healthcare professionals to encourage them to
reveal their experiences and needs 7. However, one-way communication
dominates in care, since information is gathered from or given to patients 8,
75. Developing two-way communication is a more fruitful approach, leading
to greater knowledge 8, 81, helping patients deal with their own pain and
giving healthcare professionals a better understanding of patients’ current and past experiences.
11
Rationale
Pain is a common problem after surgery, and guidelines have been produced recommending regular screening and assessment of pain. These assessments involve following patients’ pain by using a validated pain scale to optimise treatment and reduce suffering. An integral part of the assessment is communication. However, patients are a heterogeneous group, consisting inter alia of different ages, personalities and experiences, which can all affect the assessment. Their views on using a pain scale and what influences their actions when they are in pain has still been insufficiently explored.
Furthermore, pain has been found to be a major cause of delayed early physical recovery, leading to increased risk of complications. Guidelines aiming at enhanced and early recovery after surgery consider pain management an essential element in enabling patients to return to their preoperative activities. Several more or less extensive recovery tools have been developed, where patients rate the impact of various items on recovery. However, not all patients will be interested in completing extensive
questionnaires, or have the energy to do it. A simplified measure, which is suitable for the majority of patients and allows daily measurement of recovery, would be valuable in clinical practice. One possible solution could be to use self-rated pain not only for pain management but also for reflecting and predicting recovery. Furthermore, predicting recovery facilitates
healthcare planning for individual patients. If self-rating is to be of a suitable quality in terms of reflecting and predicting physical recovery, it requires patients' perspectives on pain assessment to be taken into account.
12
Aim
The overall aim of this thesis was twofold: (A) to determine the ability of extending the use of pain ratings to reflect and predict early physical postoperative recovery and (B) to describe patients’ perspectives on pain assessments.
The specific aims of the different studies were:
To study the relationship between average pain values and self-assessed ability for early postoperative physical recovery (I). To describe how patients perceive the use of the Numeric Rating
Scale in postoperative pain assessments (II).
To describe patients’ experiences and actions when in need of describing pain after surgery (III).
To compare different levels of self-rated pain and determine if they predict early physical recovery in patients undergoing general and orthopedic surgery (IV).
13
Conceptual framework
Shared decision-making
The World Health Organization emphasises patients' rights to be informed
about - and participate in - care 82. Patient participation plays an important
role in healthcare organisations in different countries 22. In Sweden, patients'
rights have been strengthened in law, giving them the right to receive
adapted information and to participate in decisions about care 83.
Participation is based on mutual exchange of information between patients
and healthcare professionals, along with respect for each other’s opinions 82,
84, 85. Furthermore, participation includes the right to shared decision-making
84, an important element in person-centred care 37, 86, 87. Shared
decision-making means that, when they choose between different options, patients and healthcare professionals talk about pros and cons, an appraisal of the
options is made, and finally patients are supported in making a decision 88, 89.
Patients being involved in decision-making leads to less conflict with healthcare professionals and contribute to greater success in pain
management 37. However, preferences vary in terms of participating in
decisions 90, 91, and some patients need support to make shared decisions
based on knowledge of the consequences and their individual needs 89, 92.
Shared decision-making is encouraged through supportive communication,
trust and confidence between patients and healthcare professionals 93, 94.
However, patients have less power than healthcare professionals and power
needs to be shared to ensure participation 28, 95. Power can be given or taken
away through the way in which communication takes place. Furthermore, continuity in relationships promotes participation, as do adequate and adapted information, inviting questions and a two-way communication
process 9, 28, 96. Despite the fact that patient participation is considered vital,
healthcare professionals prioritise practical tasks rather than working
towards dialogue and consensus with patients 76, 97. In pain assessments
dialogue is necessary to reach a common understanding of the pain patients
have rated, and to share decisions about how the score is interpreted 61.
However, in practice healthcare professionals decide whether measures should be provided or not on the basis of the pain rating, without dialogue
with the patient 61.
14
Methods
Design
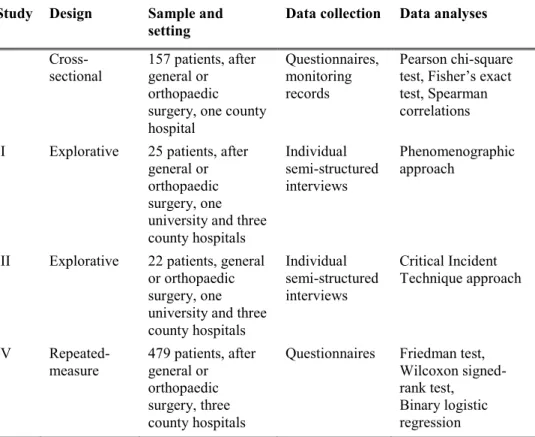
This thesis is composed of four studies involving both quantitative and qualitative approaches (Table 3). The quantitative methodology (I and IV) is based on questionnaires and data from medical records. Study I was a one-centre study performed using a cross-sectional design. A study-specific questionnaire was constructed based on previous research on pain and
recovery 4, 6, 15, 16, 67, 98-100. In Study IV, the questionnaire was based on the
NRS 4, 5, 41 and items derived from the recovery tool PRP, developed by
Allvin et al. 15, 20. The study was carried out using repeated measures, and
was extended to a multicentre study. As self-rated pain was the basis for the hypothesis of using pain values to predict physical recovery, it was relevant to explore patients' perspectives on pain assessment. This provided the aims for Studies II and III, both of which involved qualitative approaches. These studies were based on interviews which improved knowledge on how to perform good quality pain assessments. In Study II, a phenomenographic approach was chosen to explore variations in patients’ perceptions of the postoperative use of a pain scale (i.e. NRS). Critical Incident Technique (CIT) was used in Study III to identify critical incidents related to pain assessments.
Participants and settings
Data for Study I were collected at a county hospital in the south of Sweden between April and October 2009. Study IV involved three county hospitals from the same area, and data were collected between October 2012 and January 2015. Data collection for Studies II and III took place at one university and three county hospitals in the south of Sweden, with patients who had undergone major general or orthopaedic surgery. Study II was conducted between May and November 2012, and Study III between December 2013 and May 2014. Each county hospital in the studies had a catchment area of between 130 000 and 150 000, while the university hospital had about 900 000, with 300-400 and 600 beds respectively. Inclusion criteria for all studies involved patients with an expected length of hospital stay of 2 days or more, who had undergone general or orthopaedic
15 surgery, who were aged 18 years or older and who had a spoken and written understanding of the Swedish language. Exclusion criteria involved patients with cognitive impairment or in need of intensive postoperative care.
Table 3. Overview of methodological approaches in the four studies.
Study Design Sample and
setting Data collection Data analyses
I
Cross-sectional 157 patients, after general or orthopaedic surgery, one county hospital
Questionnaires, monitoring records
Pearson chi-square test, Fisher’s exact test, Spearman correlations II Explorative 25 patients, after
general or orthopaedic surgery, one university and three county hospitals Individual semi-structured interviews Phenomenographic approach
III Explorative 22 patients, general or orthopaedic surgery, one university and three county hospitals Individual semi-structured interviews Critical Incident Technique approach IV Repeated- measure 479 patients, after general or orthopaedic surgery, three county hospitals
Questionnaires Friedman test, Wilcoxon signed-rank test, Binary logistic regression
Data collection
Questionnaires
The quantitative studies (I, IV) were conducted with questionnaires and data from medical records. In Study I, an information letter was given out about the study on postoperative day 1. In Study IV, patients were asked about participation as part of the enrolment call one to two weeks prior to surgery. Consent to participate involved patients completing a questionnaire about pain and items relating to physical symptoms, physical function and activity
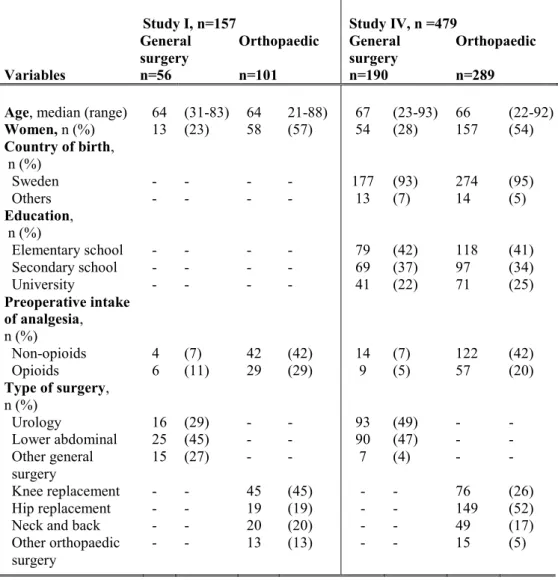
16 during the enrolment call (IV) and on postoperative days 1 and 2 (I, IV). Specific socio-demographic data were gathered from the questionnaires, and clinical data were collected from medical records by research nurses (Table 4).
Table 4. Socio-demographic and clinical data for general and orthopaedic surgery patients in Studies I and IV.
Study I, n=157 Study IV, n =479 General
surgery Orthopaedic General surgery Orthopaedic Variables n=56 n=101 n=190 n=289
Age, median (range) 64 (31-83) 64 21-88) 67 (23-93) 66 (22-92)
Women, n (%) 13 (23) 58 (57) 54 (28) 157 (54) Country of birth, n (%) Sweden - - - - 177 (93) 274 (95) Others - - - - 13 (7) 14 (5) Education, n (%) Elementary school - - - - 79 (42) 118 (41) Secondary school - - - - 69 (37) 97 (34) University - - - - 41 (22) 71 (25) Preoperative intake of analgesia, n (%) Non-opioids 4 (7) 42 (42) 14 (7) 122 (42) Opioids 6 (11) 29 (29) 9 (5) 57 (20) Type of surgery, n (%) Urology 16 (29) - - 93 (49) - - Lower abdominal 25 (45) - - 90 (47) - - Other general surgery 15 (27) - - 7 (4) - - Knee replacement - - 45 (45) - - 76 (26) Hip replacement - - 19 (19) - - 149 (52)
Neck and back - - 20 (20) - - 49 (17)
Other orthopaedic
surgery - - 13 (13) - - 15 (5)
17
Study I
A study-specific questionnaire with 11 questions was constructed by the
research team based on guidelines and previous research 4, 6, 15, 16, 67, 98-100
(Appendix I). The questionnaire was answered retrospectively for the
previous day. It consisted of questions about pain intensity (n=2), pain duration (n=2) and early physical recovery (n=7). Pain duration was measured with the NRS, and the response alternatives were divided into
three levels (i.e. 0-3, 4-6, 7-10) according to earlier studies 19, 101, in which no
pain and mild pain represented NRS 0-3, moderate pain 4-6 and severe pain 7-10. The division into three pain levels has previously shown differences in
the outcomes reported by patients 19. In the questionnaire, experiences of
pain intensity were expressed according to the response options: “more than an hour”, “less than an hour” or “not at all”. The number of patients with severe pain intensity was low, resulting in merged groups; this meant that NRS 4-6 and 7-10 were merged into one group. Implying pain intensity consisted of two levels: NRS 0-3 and 4-10, enabling analysis of the relationship between pain intensity and physical recovery.
The influence of pain on physical recovery was measured with items focusing on changes in appetite, sleeping difficulties, movement in bed, mobilisation, exercise programmes and personal hygiene. Response options for these questions were: “not at all”, “partial”, “to a large extent” and “completely”. As the proportion of patients who responded “completely” was low, the four response options for impact on recovery were
dichotomised to enable comparison between pain intensity and impact on recovery. The response options “not at all” and “partial” formed one group, while “to a large extent” and “completely” formed the second group. Association between pain intensity and impact on physical recovery was analysed with data from the monitoring records. In preparation for the statistical analysis, the questionnaire was developed in collaboration with a statistician. Content validity of the questionnaire was ensured by basing questions on previous research and subsequently having them evaluated by five patients. Face validity was assessed by five patients, two pain nurses with long experience in the field and a researcher with a PhD.
18
Study IV
The questionnaire used in Study I was modified by the research team to facilitate statistical analysis in Study IV, helping to expand knowledge in the field (Appendix II). Apart from the NRS, three of five dimensions of the recovery tool PRP were used, which meant that the questionnaire contained 11 questions: two about pain and nine about early physical recovery. The questionnaire used the continuous NRS (0-10), and pain intensity was divided during the analysis. Patients reported their average pain intensity retrospectively, pending further research on calculating average pain from monitoring records and reducing drop-outs caused by documentation deficiencies. Few patients in the general surgery group had a pain intensity of NRS 7-10, which made it impossible to compare general and orthopaedic surgery, so the two surgery groups were merged in analysing the impact of pain intensity on physical recovery.
Physical recovery was measured using three dimensions: physical
symptoms, physical function and activity 15, 20. The psychological and social
dimensions containing seven items were excluded, as according to Bowyer
& Royse 17 these have a greater impact later in the recovery. In addition, two
items focusing on sexual activity and re-establishing everyday life were
omitted as recommended during hospitalisation 20. The pain item from the
PRP was also excluded because of the aim of determining future use of an average NRS value to reflect and predict recovery. Physical symptoms consisted of four items: nausea, fatigue, appetite changes and sleeping difficulties. Physical function comprised four items: gastrointestinal function, bladder function, mobilisation and muscle weakness. Activity consisted of one item: personal hygiene. The response options used to describe perceived impact of the various recovery items ranged from 0 to 3: “none”, “mild”, “moderate” and “severe”. The physical items in the PRP were used to demonstrate the impact of pain intensity on each physical item, and no summation of scores was made. As the proportion of patients who responded “severe” for the impact on physical recovery was low, the four response options for impact on recovery were dichotomised to enable comparison between pain intensity and impact on recovery. The PRP response options “none” and “mild” formed one group, while “moderate” and “severe” formed the other group. Content validity of the PRP was ensured through collaboration between researchers, healthcare professionals
19 and patients, while reliability was assessed by test-retest of a group of
patients 20.
Interviews
The interviews took place between postoperative days one and five (II) or between days one and seven (III) in a separate room on the ward where patients were receiving care. The interviews were recorded and carried out face-to-face. They lasted up to 50 minutes and were later transcribed verbatim. Socio-demographic data for Studies II and III are shown in Table 5.
Table 5. Socio-demographic data for general and orthopaedic surgery patients in Studies II and III.
Variables Study II N=25 Study III N=22 Age, years, n 18-55 7 6 56-75 10 10 76-91 8 6 Education, n Elementary school 11 6 Secondary school 10 13 University 4 3
A phenomenographic approach was chosen to describe the perceptions of using the NRS for pain assessments (II). The approach was developed by
Marton 102, and aims to find variations in perceptions of a phenomenon,
particularly the variety of perceptions sought using this approach 103. In
phenomenography, a second-order perspective is sought on how something is perceived, while a first-order perspective describes what something is like
102. The interview guide was based on the American Pain Society’s
recommendations for improving the quality of acute and cancer pain
management 6. As in previous research using a phenomenographic approach,
data were collected using semi-structured interviews involving some key issues where the answers led to follow-up questions to clarify what was
20
meant 104. The interview began with a broader question about what pain
relief meant, before asking questions about the NRS (Table 6).
Table 6. The interview guide used in data collection with patients in postoperative care (N=25).
What does pain relief mean to you?
How do you perceive rating pain with the NRS?
How do you perceive rating pain with the NRS in relation to choice of treatment? How do you perceive rating pain on the NRS several times a day?
How do you perceive your/your healthcare professionals’ role in pain assessment?
The CIT was used to explore patients’ experiences and actions when they were in pain (III). A critical incident is an event which the person describing it believes was crucial to the continued activity and outcome of the situation
105. The semi-structured interview guide was built on a recommendation
regarding quality in interviews with the CIT 106. First of all, patients were
requested to think about a postoperative situation where they had been in need of an analgesic. Secondly, they were asked to describe this situation as thoroughly as possible, giving both positive and negative experiences. Patients were asked for their experiences of pain as well as the action they took as a result of these experiences. Probing questions were asked according to patients’ narratives (Table 7).
Table 7. The interview guide used in data collection with patients in postoperative care (N=22).
Think of a situation where you felt you were in need of an analgesic. Please describe what happened as thoroughly as possible.
What did you/healthcare professionals do during the incident?
What influenced the incident?
Probing questions such as: What happened next? What did you do next? What were you thinking? What do you mean? How did it affect you?
21
Data analysis
Quantitative method
Data were analysed using parametric and non-parametric methods depending on data level and distribution (I, IV). Descriptive statistics were used to present socio-demographic and clinical data. In Study I, associations between pain intensity and physical recovery were investigated between postoperative days 1 and 2, using the Pearson chi-square test or Fisher’s exact test. Spearman correlation was used to determine any associations between documented pain from monitoring records and patients’ retrospectively self-rated pain. In Study IV, pain intensity and impact on physical items were compared in terms of prehospital and postoperative data on days 1 and 2, using the Friedman test with the Wilcoxon signed-rank test as a post-hoc test. Association between pain intensity and impact on the different physical recovery items was investigated with binary logistic regression and presented with a 95% odds ratio and confidence interval. The three levels of pain intensity were used as the predictor variable, and the physical recovery items as the outcome variable. A P-value of <.05 overall was considered significant. The post-hoc tests used Bonferroni-corrected P-values, set at P <.017. The analyses were performed in SPSS (IBM
Corporation, Amonk, NY, USA).
Qualitative method
Data from the interviews were read several times to obtain an overall view of the material, after which they were analysed inductively (II, III). Quotes were chosen which corresponded to each aim in the two studies. Similar quotes were gathered into groups and thereafter abstracted to two (II) or three (III) higher levels. Study II used the seven steps described by Sjöström
& Dahlgren 104 to analyse phenomenography, while Study III employed the
pattern presented by Fridlund et al. to analyse CIT 107.
Data analysis using the phenomenographic approach involved both an interpretive and a descriptive part (II). During the analysis, patients' perspectives of the phenomenon were maintained, specifically in order to distinguish a variety of perceptions. The data analysis is described in Table 8.
22 Table 8. The data analysis was performed in accordance with a phenomenographic approach 104.
Familiarisation The 25 interviews (226 pages) were read and reread to become familiar with the material.
Compilation Answers belonging to a particular area were compiled. 175 quotes were obtained in total, which corresponded to the aim of the study.
Condensation Different quotes were amalgamated to obtain a representative description of pre-perceptions.
Grouping of
similar answers Similar quotes were grouped into 13 perceptions.
Comparison To set clear distinctions between the groups, comparisons were made between them in order to explore similarities and differences in perceptions of the NRS.
Naming the
categories Appropriate labels were given to the descriptive categories, which described their content. Contrastive
comparison The categories were compared so that they were clearly defined, and finally 3 descriptive categories emerged.
Analysis of data using the CIT approach aims to facilitate practical use of collected data without losing details (III). On the other hand, both positive and negative experiences are requested during the interviews, and the intention during the analytical work is to find neutral headlines in
subcategories, categories and main areas 105. However, Flanagan's
description of the analysis process is vague, which is why an analytical
model was used which has been developed in recent years 107 (Table 9). The
model involved analysing the collected data twice, once to show patients’ experiences and once to show actions taken as a result of these experiences.
23 Table 9. The data analysis was performed in accordance with the CIT approach 107.
The 22 interviews (418 pages) were read and reread to become familiar with the material.
Answers belonging to a particular area were categorised. 451 quotes were obtained in total, which corresponded to the study aim, divided into 295 experiences and 156 actions.
Comparisons were made between the groups in order to explore similarities and differences in incidents.
Similar quotes were grouped together in subcategories: 12 as experiences and 15 as actions, forming four categories focusing on experiences and four categories focusing on actions.
Appropriate labels were given to the subcategories to describe their content, and finally two main areas of experiences emerged and two main areas involving actions.
24
Ethical considerations
This thesis was guided by the ethical guidelines for nursing research in the
Nordic countries 108. These guidelines are built on the UN’s Declaration of
Human Rights 109 and the Helsinki Declaration 110, together with ethical
principles defined by Beauchamp and Childress 111. Permission for all
studies was obtained from the Regional Ethics Review Board in Linköping, Sweden (I; No M249-09, II-IV; No 2012/40-31).
The principle of autonomy
Patients in all studies were given both oral and written information to enable them to decide whether to participate. The information sheet included data about the aim of the study, the selection of patients and what participation implied for the patient. The information gave the assurance that their participation was voluntary and that they could withdraw from the study without consequences for their care. The beneficence of the study was clarified, i.e. providing knowledge for healthcare, together with information on confidentiality of data. Patients were asked to participate before surgery (IV) or after surgery (I, II, III). There was a risk patients might feel obliged to participate, but they were repeatedly informed that participation was voluntary. However, in Study IV there was no attempt to check whether all healthcare professionals in the different wards ensured that this voluntary condition was fulfilled. During the interviews, open-ended questions were asked which allowed patients to choose how to respond, and in the questionnaires they could choose not to answer a question. The fact that some patients dropped out and withdrew their consent suggests that they did not feel forced to continue to participate.
The principle of beneficence and the principle of
non-maleficence
There was no benefit from the studies for the participating patients except that some of them expressed their appreciation during the interviews (II, III) for being able to share their experiences and perceptions. In contrast to the researcher, it appeared that healthcare professionals seldom had time to listen to their narratives. To make the interviews as rich as possible, the studies were conducted while patients were still hospitalised, reducing the
25 risk of them forgetting details. On the other hand, if interviews had been conducted after discharge, patients might have found it easier to decline the invitation to participate. However, the benefit of conducting the studies while patients were hospitalised was considered to outweigh the risk of harming patients. In Studies II and III, several patients said they were happy to participate, and were pleased to contribute to improvements in
postoperative pain management. The purpose of all the studies was
ultimately to benefit other patients undergoing surgery and to help healthcare professionals improve the field in question through more efficient pain assessments and greater patient participation. There were low risks of harming patients, even though interviews and questionnaires can have an impact on integrity. None of the four studies contained obviously sensitive questions. If a patient seemed tired or appeared not to be feeling well, someone checked whether he/she wanted to continue to participate or to cancel (I-IV). The researcher had no caring relationship with the patients in the study, and all data were treated confidentially.
The principle of justice
Which patients were included (I, IV) was limited by ward resources. This meant that not all patients who met the criteria were offered an opportunity to participate, and that no attention was paid to socio-demographic
background. The interviews involved purposeful sampling (i.e. variation in age, gender, education and surgery) in order to give different groups of patients a voice (II, III). The care of those who declined the invitation to participate was not affected in any way (I-IV).
26
Results
Using average and maximum values from the
NRS when evaluating recovery (I)
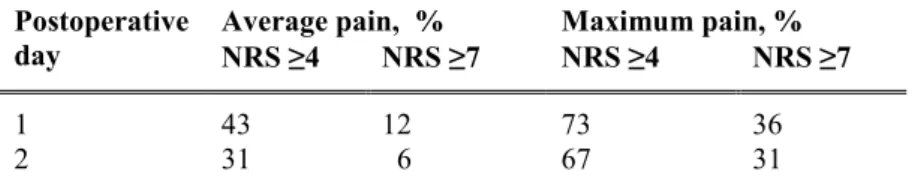
The prevalence of average pain NRS ≥ 4 on postoperative days 1 and 2 was 43% and 31% respectively. Corresponding proportions of maximum pain were 73% and 67% respectively (Table 10). The proportion of patients who reported that pain influenced physical recovery “to a large extent” or “completely” was greater on postoperative day 1 compared to day 2 (Table 11). Significant differences were found between the two days regarding sleeping difficulties, exercise programmes (P <.001), mobilisation,
movement in bed and personal hygiene (P <.01). On postoperative day 1, an association was found between compiled average pain from monitoring records and physical recovery in terms of appetite changes (P <.04), sleeping difficulties (P <.02) and mobilisation (P <.04). No significant differences were observed in any recovery item between those with prehospital pain and those without. The agreement between average pain (NRS 4-10) from
monitoring records and retrospective average pain was rs = .95 (P <.001) on
postoperative day 1. Corresponding maximum pain (NRS 4-10) from
monitoring records and retrospective reported maximum pain was rs = .95 (P
<.001) on day 1.
Table 10. Proportion of patients with average and maximum pain intensity of NRS 4-10 postoperatively.
Postoperative
day Average pain, % NRS ≥4 NRS ≥7 Maximum pain, % NRS ≥4 NRS ≥7
1 43 12 73 36
2 31 6 67 31
27 Table 11. Proportion of patients who self-rated impact on recovery “to a large extent” or “completely” postoperatively.
Recovery items Proportions of patients, % day 1 day 2 Physical symptoms Appetite changes 9 5 Sleeping difficulties 35 24 Physical functions Mobilisation* 43 25 Movement in bed 33 29 Exercise programme 20 12 Activity
Personal hygiene/ get dressed 36 16
* The question focused on walking.
Patients’ perceptions of using the NRS in
postoperative pain assessments (II)
Patients’ perceptions about the NRS showed they considered that its implementation was the healthcare professionals’ responsibility, which imposed a demand on care routines, and there were interpretation difficulties (Table 12). Nonetheless, they found using the NRS facilitated
communication about pain, though they reported that a description of the pain was also required. Employing the NRS was considered easier when both partners had the same starting point, rather than describing pain in their own words. Rating pain made it easier to participate by referring to previous assessments, but not all respondents considered that there were advantages to using a pain scale. A sincere interest in patients’ responses made patients feel secure and confident in their relationship with healthcare professionals. Although the NRS facilitated communication about pain, respondents considered that healthcare professionals needed to be responsive. Patients reported that it was difficult to know how much pain they were expected to handle, and raised the cut-off point for needing pain relief from one to six on the pain scale. The NRS was considered to support healthcare professionals
28 in selecting analgesics and dosage, as well as in terms of handing over to the next shift. Healthcare professionals were perceived to have the main
responsibility for employing the NRS correctly, giving proper information and adapting the interval between assessments based on pain intensity. Patients’ quotes are presented in Appendix III.
Table 12. Descriptive categories and perceptions from interviews with patients about their perceptions on the NRS pain scale.
Descriptive categories Perceptions
Use of the NRS facilitated
communication of pain NRS facilitated descriptions of pain NRS facilitated participation NRS facilitated confidence
NRS facilitated transferring of information between healthcare professionals
Use of the NRS put demands on healthcare professionals and care routines
NRS demanded healthcare professionals take responsibility
NRS demanded clear information from healthcare professionals
NRS demanded that healthcare professionals be responsiveness
NRS demanded attention to the patients’ needs
Use of the NRS contained interpretation difficulties
NRS alone was insufficient to describe pain NRS ratings were perceived as difficult NRS created uncertainty about how it was used by the healthcare professionals
Patients’ experiences and actions when
assessing pain after surgery (III)
Patients’ experiences when in need of describing pain were affected by their own resources, i.e. their understanding of pain and their ability to cope with the situation (Table 12). Expectations and tolerance of postoperative pain varied, and influenced patients' experiences as well as the expected effect of
29 analgesics. Patients assumed their previous experience of non-opioid agents, which are administered at most three to four times per day, covered all analgesics. Furthermore, there were patients who assumed they were receiving optimal pain treatment, and the risk of side effects affected their motivation to take analgesics. Willingness to talk about and request analgesics was affected by healthcare professionals’ attitudes. A fear of being perceived as complaining or arguing affected communication, and
long waits for analgesics reduced confidence in healthcare professionals.
Furthermore, patients described that care routines and healthcare professionals’ working conditions affected the performance of pain
assessments. Healthcare professionals asked questions about pain for one or
two days after surgery, and then the questions ceased. Information about
pain was described as deficient when healthcare professionals handed over to the next shift. Continuity in staffing facilitated communication about pain,
but the performance of pain assessments depended on who was on duty.
Patients reported that healthcare professionals’ heavy workload influenced their willingness to approach staff for help.
When they were in pain, patients’ strategies were both active and passive (Table 14). They adopted active strategies, such as informing healthcare professionals about their pain situation, and took measures to care for themselves (e.g. they avoided mobilisation). Active patients described their
pain as well as requesting analgesics. Furthermore, they sought information
from both fellow patients and healthcare professionals, adapted their activities in relation to the pain and took an active part in the treatment of pain. On the other hand, passive patients put up with pain until they were given the next dose of analgesics, and refrained from informing healthcare professionals. Patients described that lack of knowledge about pain management and their confidence in the competence of healthcare
professionals meant they relied on the latter’s judgement. Patients’ quotes are presented in Appendices IV-V.
30 Table 13. Descriptive main areas, categories and subcategories from interviews with patients regarding experiences when in need of pain assessment.
Main area Category Subcategory (Number of quotes)
Patients’ resources when needing to describe pain Patients’ understanding of
pain Patients’ expectations of pain (19)
Patients’ expectations of pain treatment (30)
Patients’ awareness of analgesics side effects (5)
Patients’ ability to cope
with their pain situation Patients’ tolerance for pain (32) Patients had difficulties describing their pain (12)
Patients were influenced by healthcare professionals’ attitude when assessing their pain (35) Ward resources for performing pain assessments Healthcare professionals’ routines when assessing pain
Patients were asked about their pain (51)
Patients were invited to get in touch when in pain (11)
Patients were informed about pain and treatment (29)
Healthcare professionals’ working conditions affected patients’ possibility to describe pain
Healthcare professionals’ different procedures affected patients’ ability to describe pain (24)
Healthcare professionals’ had different roles (24)
Healthcare professionals' workload affected pain assessment (20)
31 Table 14. Descriptive main areas, categories and subcategories from interviews with patients regarding actions when in need of pain assessment.
Main area Category Subcategory (Number of quotes)
Patients used active strategies when needing to describe pain Patients informed healthcare professionals about their pain
Patients told healthcare professionals they had pain (10)
Patients described their pain in detail (17)
Patients requested pain management (24)
Patients performed self-care
when in pain Patients asked questions about pain and treatment (14) Patients distracted themselves from their pain (8)
Patients avoided activity (9) Patients changed their position (8) Patients adjusted their treatment (9) Patients used passive strategies when needing to describe pain
Patients endured pain Patients “bit the bullet” (10) Patients waited for the pain to subside spontaneously (5)
Patients waited for the next dose of analgesics (5)
Patients hesitated to disturb
overstrained healthcare professionals (6)
Patients refrained from notifying healthcare professionals when in pain
Patients awaited to see the need for analgesics (13)
Patients left the responsibility for their pain management to healthcare professionals (13)
Patients take responsibility for shortcomings in pain management (5)
Association of pain ratings with the prediction of
early physical recovery after surgery (IV)
The prevalence of average pain intensity NRS ≥4 during activity was high on postoperative days 1 and 2, at 72% and 61% respectively (Table 15). Differences in recovery were shown across the three time points (i.e.
32 prehospital, and postoperative days 1 and 2). Consistently, at all time points there was a greater impact on the three dimensions (i.e. physical symptoms, physical functions and activity) for orthopaedic patients compared to general surgery patients. The impact on recovery was greatest on postoperative day 1 for the two surgical specialities and lower for most items on day 2 compared to day 1. Furthermore, pain intensity was consistently higher in patients undergoing orthopaedic compared to general surgery at the three time points (P <.001).
Table 15. Proportion of patients who retrospectively reported average pain intensity as “moderate” or “severe” on postoperative days 1 and 2.
Postoperative
day Pain at rest, % NRS ≥4 NRS ≥7 Pain during activity, % NRS ≥4 NRS ≥7
1 42 9 72 36
2 28 4 61 20
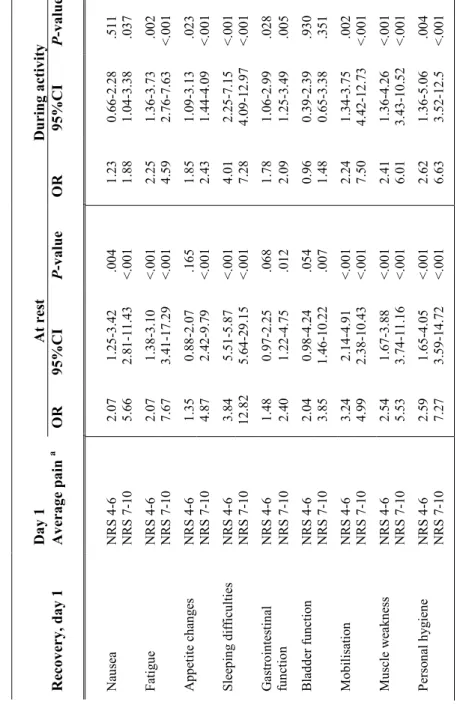
Average pain intensity at rest on postoperative day 1 significantly reflected all measured items of recovery for the same day (Table 16). Pain intensity at rest predicted physical recovery on day 2, especially in terms of fatigue, sleeping difficulties and mobilisation, but also in terms of appetite changes, muscle weakness and personal hygiene (Table 17). Average pain intensity during activity on day 1 reflected all measured items except bladder function, and predicted physical recovery on day 2 except for nausea, appetite changes and bladder function. Severe pain intensity at rest and during activity (NRS 7-10) was shown to reflect and predict recovery better than moderate ratings (NRS 4-6) on both postoperative days 1 and 2, as it significantly reflected and predicted more physical recovery items. No change in results was found between average pain intensity at rest or during activity and recovery on postoperative day 2, excluding patients with moderate or severe prehospital impact on physical items.
T ab le 16 . A ss ociatio ns b et w ee n patien ts ' r etr os pec tiv ely s tat ed av er ag e pain in ten sit y on d ay 1 an d rec ov Da y 1 At re st Rec ov er y, da y 1 Av er ag e pa in a OR 95 %CI P -v alue OR Na use a NRS 4-6 2. 07 1. 25 -3 .4 2 . 00 4 1. 23 NRS 7-10 5. 66 2. 81 -1 1. 43 < .0 01 1. 88 F ati gu e NRS 4-6 2. 07 1. 38 -3 .1 0 < .0 01 2. 25 NRS 7-10 7. 67 3. 41 -1 7. 29 < .0 01 4. 59 A pp eti te ch an ge s NRS 4-6 1. 35 0. 88 -2 .0 7 . 16 5 1. 85 NRS 7-10 4. 87 2. 42 -9 .7 9 < .0 01 2. 43 S lee pin g dif ficu lt ies NRS 4-6 3. 84 5. 51 -5 .8 7 < .0 01 4. 01 NRS 7-10 12 .8 2 5. 64 -2 9. 15 < .0 01 7. 28 G astro in tes ti na l fu nc ti on NRS 4-6 1. 48 0. 97 -2 .2 5 . 06 8 1. 78 N RS 7 -10 2. 40 1. 22 -4 .7 5 . 01 2 2. 09 Blad de r fu nc ti on NRS 4-6 2. 04 0. 98 -4 .2 4 . 05 4 0. 96 NRS 7-10 3. 85 1. 46 -1 0. 22 . 00 7 1. 48 M ob ili sa ti on NRS 4-6 3. 24 2. 14 -4 .9 1 < .0 01 2. 24 NRS 7-10 4. 99 2. 38 -1 0. 43 < .0 01 7. 50 M usc le w ea kn ess NRS 4-6 2. 54 1. 67 -3 .8 8 < .0 01 2. 41 NRS 7-10 5. 53 3. 74 -1 1. 16 < .0 01 6. 01 P erso na l h yg ien e NRS 4-6 2. 59 1. 65 -4 .0 5 < .0 01 2. 62 NRS 7-10 7. 27 3. 59 -1 4. 72 < .0 01 6. 63 a NRS ra ti ng s 0 -3 u se d as ref ere nc e ca te go ry . 33