VTI särtryck
Nr 232 ' 1994
Solving Problems with Tyre/Road Friction and
Safety in ABS Evaluation
a Friction Test
Trailer, a Tyre Test Facility and Hardware in
the Loop Simulation as Possible Tools
Olle Nordström
Paper presented at Intertruck '94, XI International Heavy
Vehicle Conference in Budapest, Hungary, 29 30
September, 1994
SEP/PAR! UDOMANYOS£313
Qup l er GE
EG YFSULETullfl'f,(ftf([L((N:[l l' , !
IIILl(.(L(((l,(L(FJAll! 3111WIT-VT .. _ IILE'L'P'LLL(langa;
' '(, ' _ (- (|.L_ _ ; » (_ ,
"H LULLUL'NL'_££Q_'__Ih mhi&£ E£EEäL£Ä1så?
' BUDAPESTI MUSZAKI EGYETEM . "TECHNISCHE UNIVERSITÅT BUDAPEST
TECHNICAL UNIVERSITY OF BUDAPEST
transport-V'" särtryck
Nr 232 ' 1994
Solving Problems with Tyre/Road Friction and
Safety in ABS Evaluation - a Friction Test
Trailer, a Tyre Test Facility and Hardware in
the Loop Simulation as Possible Tools
Olle Nordström
Paper presented at Intertruck '94, XI International Heavy
Vehicle Conference in Budapest, Hungary, 29 30
September, 1994
cc!»
Väg- och
transport-farskningsinstitutet
'
Olle Nordström, MME, SAE, SVEA
Swedish Road and Transport Research Institute, Linköping, Sweden
Solving Problems with Tyre /Road Friction and
Safety in ABS Evaluation - a Friction test trailer, a
Tyre test facility and Hardware in the Loop
Simulation as possible Tools.
HUNGAROCAMION- Conference, Budapest. Hungary Sept. 29-30 1994.
Introduction
Antilock braking systems (ABS) for heavy vehicles have to be evaluated both by the manufacturer and the type approval authorities. International braking regulations developed by the United Nations organisation ECE in close co-operation with EEC, USA and Japan include such evaluation test procedures. They are continuously being improved but still more needs to be done.
In this paper some de ciencies will be discussed and possible methods for
improvement proposed. As tools in this process methods and equipment developed at the Swedish Road and Transport Institute (VTI) will be described brie y.
These de ciencies are
1. Lack of minimum deceleration requirements on low friction surfaces based on a common reference which means that on a given surface different deceleration levels are accepted if the tyres are changed. This problem is discussed and the use of a standardised test tyre on a fixed slip friction test vehicle is proposed.
2. Only two types of tyre/road friction characteristics are tested during type approval which are not very well de ned.
Special tyre test equipment can be used for ef cient study of the characteristics of existing tyres on different types of road surfaces. In Sweden icy roads are considered to be an important safety problem. The braking and steering characteristics of truck tyres on ice are vital in this connection. At VTI a tyre test facility with ice testing capability has been developed on which both truck and passenger car tyres can be tested. This equipment and some results are brie y presented.
3. The number of test types are too limited. Particularly stability and steerability is hardly evaluated at all. Cost, time and safety for the test drivers are major problems.
With knowledge of tyre characteristics the problem remains to test the performance of
ABS equipped vehicles for all tyre/road characteristics of interest. Hardware in the
loop computer simulation is a technique well established in aerospace industry but till now not used in official type approval procedures for evaluating braking, steering and stability performance of road vehicles. At VTI a system for hardware in the loop computer simulation testing of ABS both straight ahead and during combined steering and braking on high and low friction surfaces was developed about ten years ago. with promising results. Since then driving simulator development at VTI opens newpossibilities with or without actual use of the driving simulators. The paper gives a review of the work done at VTI and proposes continued development towards systems and methodology that can be used for expanded evaluation of ABS and other
electronic devices for improving braking steering and stability of road vehicles. This evaluation applies both to type approval and industry development.
Full scale performance criteria based on a standardised fixed slip
friction test trailer.
Present ECE/EEC brake regulations are inconsistent insofar that the requirements at
high friction are absolute and depending on the tyres as well as on the brakes while at
low friction the required performance is related to the friction of the tyres used on the vehicle.As there is no friction requirement on tyres on low friction surfaces such as smooth wet roads or ice there is in practice no common deceleration requirements for these road conditions. This is in a way not very logic as when the braking distances get longer even small differences in friction make a large difference in braking distance. Furthermore the vehicle performance gets more important compared to the reaction time of the driver .
At high friction the difference in minimum levels between vehicle categories is limited to the ratio 5:6 or with other words the heavy vehicles are required to perform about 80 percent of the minimum level for passenger cars.
On the type of smooth wet surface used on ABS low friction test tracks the
performance of heavy vehicles is generally only 50 % of that of the passenger cars. Measurements on smooth ice performed by VTI shows that the friction range for heavy vehicle M+S tyres on the market is of the same order. The best heavy vehicle tyres tested have come close to passenger car tyre performance.
The worst ones are however more frequently used probably due to better wear resistance and perhaps also lower purchase cost which further adds to the economy. A further weakness in the present method is that in spite of the endeavour to evaluate only the braking system and not the tyre the result may depend signi cantly on the type of tyre as the shape of the friction slip curve on a given surface can vary considerably even if the peak value is the same for different tyre types. Strictly speaking the type approval result is valid only for the tyre type used at the test.
A method for getting a common performance reference for all road vehicles would be to use a standardised friction test trailer with a standard test tyre as a reference vehicle. The performance requirements could then be expressed in terms of friction utilisation as today but with the difference that the reference friction is the value measured by the trailer at the time of the test as a mean value of measurements immediately before and immediately after the test.
As the road authorities also monitor the road friction by means of friction test trailers or equivalent vehicles equipped with test wheels the type approval results could be used for an improved translation of road friction to vehicle mean deceleration in road traffic simulation and to a certain extent for accident reconstruction.
A friction test method that has closerelation to ABS braking is the xed longitudinal
slip method. The slip on existing machines is in the range of 10 to 17 %.and most commonly 14 to 17%. The values will be close to the peak friction. On certain low friction surfaces with a rapid and large drop in friction after the peak, the fixed slip friction value will be significantly but not dramatically lower. On such surfaces the ABS also will encounter ef ciency problems as it is very dif cult to control the brakes fast and precisely enough. The xed slip reference trailer automatically reduces the ef ciency requirement on dif cult surfaces which for technical reasons will be necessary anyhow.Also on surfaces where the peak friction occurs at very high slip values, in some cases even at locked wheel, the fixed slip around 15 % gives a good reference value. The reason for this is that for steerability and stability reasons the slip on ABS controlled wheels should have an upper slip target limit not far from 15%.
The fixed slip machine also has the advantage of giving the mean friction value over the entire braking distance in one run and a graphic and statistic picture of the
uniformity of the friction along the track which can be used for maintenance purposes. The Swedish Road authorities are using this method for approval and monitoring of road friction. The reference tyre is a high speed trailer tyre smaller than ordinary car tyres.
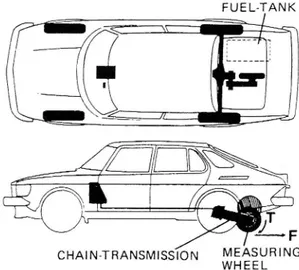
Two types of test equipment are currently used in Sweden. One of these, called Skiddometer BV 11(see Figure 1), is a relatively cheap small trailer towed by an ordinary passenger car. The other one is integrated in a SAAB passenger car and
called SAAB Friction Tester (see Figure 2). Both were developed for air eld runway
friction testing and are also currently used for this purpose not only in Sweden. The BVll is considerably cheaper but not quite so comfortable to use being a vehicle combination. A further advantage with the trailer is that any towing vehicle can be used. Also the use of the towing vehicle for other purposes does not need to be restricted for economic reasons.
ISO/TC22/ SC9/WG3 is currently preparing a draft friction measurement standard containing the method proposed here which is expected to be presented to SC9 in October 1994. This proposal also contains a somewhat reworded version of the ASTM peak friction method using a standard test tyre which is used as reference in the new FMVSS 135 braking regulation for passenger cars in USA but so far only for de ning
high friction surfaces. The method could also be used in this context but existing equipment is more expensive and the influence of the non uniformity of the track is not very well controlled as a limited number of spot measurements are used.
FUEL-TANK
CHAIN-TRANSMISSION MEASURING
WHEEL Loading weight
Figure 1 Friction test trailer BV11 Figure 2. SAAB Friction Tester
The BV11 which is developed by VTI has also been used by VTI in parallel with ABS testing of both heavy vehicles and passenger cars on a variety of surfaces. The BV11 values are normally very close to high performance passenger cars with standard tyres. On wet basalt used for ABS testing at Lelystad in the Netherlands about 10 % lower values were obtained compared with a passenger car. This car performed twice the deceleration of a truck tested at the same occasion. Similar results have been reported by UTAC in France.
A dif cult question that remains to be studied further is what efficiency is reasonable to require from heavy vehicles compared to passenger cars. The main dif culty is to optimise economy and safety considerations involving also the technological level variations between tyre manufacturers.
The VTI tyre test facility with ice testing capacity
The facility has a stationary tyre test rig and a moving at test road surface. The equipment is enclosed in a special climate controlled building, The road surface is separately refrigerated. A general view of the facility is given in Figure 3.
Tyre test rig - The tyre test rig that is shown in Figure 4 and consists of a steel frame with double wishbone wheel suspension resting on a large central roller bearing. This enables the test wheel to be rotated around a vertical axis for steering tests. The motion is computer controlled by a hydraulic motor.
The side slip angle - The side slip angle can be controlled from 90° right hand to 30° left hand steering angle at angular velocities up to 30 degrees per second
The camber angle - The camber angle can be adjusted manually 10 °in both directions by tilting the frame including the force transducer system relative to the plane of slip angle rotation.
Wheel load - Wheel loads up to 100 kN are applied by means of a computer controlled hydraulic cylinder.
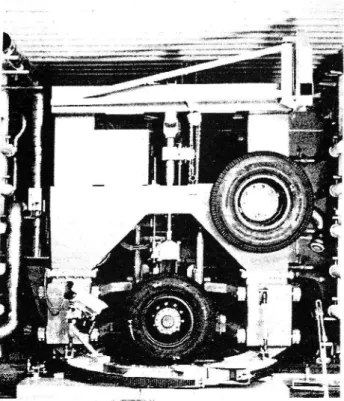
Braking system - Two disc brakes can be used for truck tyre testing (Figure 5). One is more powerful than the other. The most powerful brake ampli es its braking torque 4 times in a gear box and transmits this braking torque via a shaft to the wheel hub. The maximum braking torque is about 35 kNm.
When car tyres are tested a special wheel suspension and hub with a standard car disc brake is used with a torque capacity of about 10 kNrn.
Wheel force and moment measurement - The forces and moments acting on the test
wheel are measured by means of a triaxial force and moment transducer consisting four triaxial KISTLER piezoelectric transducers prestressed in compression between two stainless steel plates. The test wheel hub is mounted on one of the plates and the other is attached to a sub frame carrying the main braking system (Figure 5). The measuring ranges for the forces are from 0 to 100 kN vertical load and up to 70 kN for the lateral and longitudinal forces.
Moving atbed test && system - (See Figure 3 ) The road surface is represented by a flat steel beam test track with a length of 55 m and a width of 0.6 m. The beam which is supported by small steel wheels travels along an approximately 130 m long steel rail track.
The test wheel load is supported by three steel rollers contained in the base of the test rig. These rollers can be driven by an electric motor at a speed of 30 km/h for
conditioning of the test tyre when the track is run to an end position which leaves the rollers free to support the test tyre directly.
The test track is pulled by a electro-hydraulic winch with accumulators. A traction or braking force of 70 kN can be applied at speeds up to 10 m/s. The maximum speed is presently limited to 11 m/s (40 km/h).
The accumulator power is only used in one direction. For returning the track to starting position the pumps are feeding the motors directly which results in a track speed of about 0.3 m/s. The return travel time is about 3 minutes. The charging of the accumulators normally takes 2 minutes
Refrigeration and ice generation system The cooling of the test track is achieved
with a refrigerator system where a glycol refrigerant is pumped to a pipe with nozzles in a channel below the test track and sprayed directly on the bottom surface of the test track when it is in its starting position.. Ice temperatures down to about - 20 degrees centigrade can be produced also in summertime.
Nordstrom St at io na ry te st ri g Hy dr au li c a n d pn eu ma ti c eq ui pm en t Se lt pr op el le d wa te r ta nk tr ol le y fo r ic e co at in g
M Hy dr os ta ti c tr ac ti on un it $1 23 ,1 30 Pn eu ma ti c pu ug y wi th em er ge nc y hy dr au li c ca bl e te ns io n co nt ro l
%. o: 2°}
.%
'='
05 s l l$'llHHF' å = £ -u -. -_ . . . ' . » . . . 1 n . . . . -a 1 c o I . » I , n ä ä ä ' > ' ? » . I' ;' : l : :' a :" : I' J' :" 'l -. l' .n yl '. -[ '. ~, ~/ ,~ y. om n
-. -¢ -v ~ » . -.. u . » . ' " få -' .: ' a ' r . . ? >.!
v -v .. 15 5 44 f9 ?4 ?$ 5 I vf fl ov ov "4v .. -¢ n, v-na nv -aq ua )( DQ -D l .. .. .. . o , l.. ('| '.7 '1' PAC ,. 3, ". :/ . v- o-p. -; vi ! "% 'f 'i 'P C' S I' Ä' Zn yo u vn tr nv t v-4~ .. , % ( V . U T ? ., . .. ; .
.". . . we
;
ll 'r ' .". » * .'.? »_. u q .
. a: '+ '/ y' : a'4 .( -. )'-un a o.
4 , . 3 3 1 "
_ 4. 3, -'g '-_. »
Re fr ig er at or bu il di ng Co nt ro l ro om Fi gu re 3 Th e VT I fl at be d ty re te st fa ci li ty .
The air temperature is controlled by several smaller refrigerator systems One of the systems can also be used for heating the air if the outside temperature is lower than the desired temperature. Water for making ice is added successively to the steel track from a self propelled battery powered trolley (Figure 6 and Figure 7 ) which runs from one end of the track to the other using the edges of the test track beam as rails.
.-)~14};/1/- )l///.//.A, //"lI . W f/quywmw' '
Force transducer
Figure 4 Tyre test rig. Front view Figure 5. Sub frame with test wheel hub,
force transducer and brake system
a? . ..,
Figure 6. Ice laying machine in rest Figure 7. The ice laying machine
Braking friction - The braking friction of a tyre is characterised by the peak friction
value for the rolling tyre and the friction value at locked wheel. The test speed is
normally 30 km/h, although low speed measurements at about 2 km/h are also used in special cases. At a predetermined point of the test track the brake is applied at a rate that produces wheel lock in about 0.5 seconds. The wheel remains locked for the rest of the test run.The results are documented in tabular form, specifying the maximum (peak) friction and the locked wheel friction calculated according to a slightly modi ed version of the US ASTM Standard E 1337-90. The results are also shown graphically both in the form of friction as a function of time and in the form of friction as a function of
longitudinal slip (M).
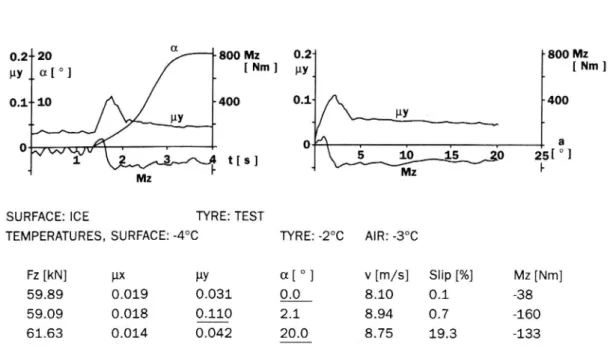
Lateral friction - The lateral friction is measured in order to describe the steerability of the tyre. The maximum lateral friction and the lateral friction at 200 side slip angle are used as characteristic values. The justification for the last mentioned value is that it indicates the violence of a lateral break away if the peak friction is passed. For optimum safety the 200 value should deviate as little as possible from the maximum value.
The measurements are carried out at the same speed and in a similar manner as when braking but steering the wheel instead of braking. The 50 side slip angle is reached after 1 second and 20O after 2 seconds. .The results are documented in tabular form specifying speed, wheel load, maximum lateral friction and the associated slip angle and the lateral friction at 20O side slip angle. The results are also shown graphically in the form of lateral friction and side slip angle as a function of time and in the form of lateral friction as a function of side slip angle (Figure 9)
ux 1 ux *
0.2- 0.2
0.1:wa oa- N
G . . . . t c . . . , , Slip
0 1 2 3 4[s] 0 20 40 60 80 100 [%]
SURFACE: ICE TYRE: TEST
TEMPERATURES, SURFACE: -5°C TYRE: +2°C AIR: +1°C
FZ [kN] ux uy a [ °] v [m/s] Slip [%] 19.31 0.016 0.006 0.0 8.44 (_)._0_ 18.63 g.1_4_7 0.004 0.0 8.37 4.8 19.00 0.058 0.000 0.0 8.36 100.0
Figure 8, Example of result from measurement of braking friction on ice with a 295/75 R 22.5 truck tyre at 19 kN wheel load and 6.5 bar in ation pressure at 30 km/h.
rsoo Mz 0.2- -800 M1 [ Nm] _ _ [ Nm] _400 0.1 ~4OO _ uy , ., . . 0 . . . . a MW?) W tls] 4 5 10 15 0 25V] * M2 M1
SURFACE: ICE TYRE: TEST
TEMPERATURES, SURFACE: -4°C TYRE: -2°C AIR: -3°C
Fz [kN] ux uy a[ ° ] v [m/s] Slip [%] Mz [Nm]
59.89 0.019 0.031 0.0 8.10 0.1 -38
59.09 0.018 0.110 2.1 8.94 0.7 -160
61.63 0.014 0.042 20.0 8.75 19.3 -133
Figure 9 Example of result from measurement of lateral friction on ice with a 315/80 R 22.5 truck tyre at
60 kN wheel load and 8 bar inflation pressure at 30 km/h
Friction measurement during simultaneous steering amd braking - This type of measurement is used to study the interaction between lateral and longitudinal friction. Each test is run at a constant side slip angle and the braking force is gradually applied so as to reach the maximum longitudinal friction in about 0.5-1 second. By stepwise increasing the side slip angle, the lateral friction can be described both as a function of longitudinal slip at different side slip angles and as a function of slide slip angle at different levels of braking friction utilisation.
The results are presented in a similar way as in the case of braking friction, but with the addition of data on lateral friction. An example of graphic presentation is shown
in figure 10.
Friction coef cients uy
uy ux px " 0.8 ~ ux 0.8 ~ 0.4 -0.4 ' py 0 . . . slip 0 . . . 0 20 40 60 80 100 i % l 0 1 2 3 4 [ s ] uy = Lateral friction px : Braking friction
Figure 10. Example of result from measurement of combined lateral and braking friction at 4.5O side slip angle with a 315/80 R 22.5 truck tyre on the high friction test track steel surface at 40 kN wheel load and 8 bar in ation pressure at 30 km/h.
10
Results on ice - Measurements with truck tyres have been made on smooth ice and on ice roughened with a fine toothed scraper. Tyres of standard type with dimension 315/80 R 22,5 tested with a wheel load of 40 kN on smooth ice polished by locked wheels at -30 C have produced maximum values for braking friction down to 0.05 and locked wheel friction down close to 0.02 i. e. extremely low values. In these cases a minor roughening of the ice with the fine toothed scraper increased the maximum friction to about 0.2 and the locked wheel value to about 0.05. More typical maximum friction for standard tyres on ice is 0.12 and for locked wheel 0.04. Good winter tyres have substantially higher values especially for locked wheel with 0.07 as a typical value on smooth ice at -50C.
Lateral friction measurements have shown similar results. On smooth ice maximum lateral friction down to 0.08 and 200 side slip angle friction down to 0.04 has been obtained. Roughening of the ice in this case increased the lateral friction to 0.25 and 0.1 respectively.
High friction test results - Tests have been carried out on the steel surface of the moving track with truck tyres of the dimensions 315/80 R 22.5 and 275/70 R 22.5 Braking tests with wheel loads between 10 and 40 kN at 30 km/h showed a decrease in friction with increasing load . The maximum braking friction decreased from 0.9 to 0.7 and the locked wheel friction from 0.7 to 0.4. Lateral friction was measured in the load range from 10 kN to 80 kN. The maximum lateral friction decreased with
increasing wheel load from 1.0 at 10 kN to 0.56 at 80 kN. At 40 kN the maximum value had already been reduced to 0.6.
Reliability and validity - On ice the repeatability of locked wheel braking friction is regarded as good. The repeatability of the maximum values is more variable
depending on temperature and the type of tyre.
Repeatability on the steel surface was in all cases good despite tangible tyre wear and rubber deposits on the track.
Concerning validity the results of the tests with truck tyres on lightly roughened ice agree well with the results from the full scale field tests with trucks carried out by VTI. In these tests the maximum value for braking friction was between 0.09 and 0.23 and the friction at locked wheel between 0.07 and 0.09. The maximum lateral friction obtained in full scale experiments is between 0.12 and 0.32 on smooth ice. The highest outdoor values were obtained at -200 C.
The results from measurements on the steel track are about equal to the average of what has been reported from measurements on dry asphalt and concrete roads. The results from car tyre testing also show good correlation with outdoor vehicle test
results ( Nordstrom,Samuelsson 1990).
ll
Test facility data
Maximum test speed 11 m/s
Test wheel load 0 100 kN
Braking force 0-70 kN
Lateral force 0 70 kN
Side slip angle 0-90O
Camber angle 100
Side slip angular velocity
0-30 0/s
Ice temperature range
O- -200 C
Maximum wheel size approx. 1.3m diameter.
Ice coating capacity approx. 6 mm/h at
-10 0 C track temp Effective measuring
time at max speed about 4 sec
VTI experience with hardware in the loop simulation
In 1980 VTI started a large research program on heavy vehicle ABS-braking comprising full scale experiments with single vehicles as well as truck trailer combinations and the development of a hardware in the loop simulation system by means of which the full scale experiments could be simulated. A rst report was presented at the 1983 IAVSD Symposium (Palmkvist, Nordström 1983)
During the operation of this simulation system the ABS equipped vehicle is stationary and a set of electric wires connect the vehicle with the computer via an interface. The wheel speed sensor wires of the ABS are disconnected from the controller and replaced by wires to a computer which generates simulated wheel speed signals. Pressure transducers are installed in each brake cylinder in order to measure the brake cylinder pressure at the wheels. These pressures are used as input to the simulation program in the computer. A brake actuation switch is mounted on the brake pedal in order to register the onset of the braking .
The computer programme produces a real time simulation of the brake
pressure/torque characteristics, tyre / road characteristics and vehicle motion dynamics including wheel rotation dynamics and wheel speed sensor signals. The simulated wheel speed signals are transmitted through the wires and received by the ABS controller as in the real situation. During the test the vehicle is stationary in the
laboratory with the engine running. The test engineer has only to apply the brakes after starting the computer program. When the computer program simulation is started the simulated vehicle accelerates to a pre-set initial speed for the braking test.. This starting procedure ensures that the real ABS runs through a normal starting procedure.
The simulation is ended when either vehicle speed or test time has reached a pre programmed value.
After the test a list of vehicle data and test results is printed out. Graphic presentations are also given that illustrates the time histories of vehicle variables e g
12
- Vehicle speed
- Longitudinal and lateral acceleration
- Side slip angle
- Yaw velocity
- Vehicle position and direction of motion relative to a xed co-ordinate system
- Wheel slip and brake pressure for the different wheels.
A digital minicomputer SEL 32 with 0.5 Mb semiconductor memory plus 100 Mb hard disc memory was used for the simulation.
The equipment for communication between the computer and the vehicle to be tested consists primarily of two modules. One module is situated at the computer and converts the simulated wheel speed by means of D/A converters into a pulse train with a frequency defined by the wheel speed and the number of pulses per revolution for the antilock system. The module also contains lters and amplifiers for the adaptation of transmitted brake pressure signals to suitable levels for the A/D converters.
The module at the converter is connected to a second module placed in the vehicle by a 60 m long electric cable. The module in the vehicle converts via opto couplers the transmitted wheel pulse trains into signals which are equivalent to the real wheel speed signals with respect to level and impedance. Each simulated sensor signal is galvanically isolated .from the other sensor signals.
The system is equipped for a vehicle with four wheels. The four wheel mathematical vehicle model was basically the same as the one at that time used at a vehicle driving
simulator developed by VTI.(Nordmark 1984).
The model allows cornering and runs on a at horizontal road surface. The suspension has been assumed so stiff that roll, pitch and vertical motions can be neglected. The wheel reaction forces to the ground are calculated with consideration to the load transfer during cornering and velocity changes based on roll stiffness distribution , roll centre heights and the centre of gravity location. The friction forces between the tyres and the ground determine the motion of the vehicle.
The following input data are required for the vehicle model
- vehicle mass - wheel base
- track width front/rear
- static load distribution front axle/rear axle - roll stiffness ratio front] rear
- moment of inertia around the vertical axis through the centre of gravity (z- axis)
wheel radius
- wheel moment of inertia around the axle of wheel rotation
- tyre rolling resistance coef cient
The limitation to one vehicle made it impossible to simulate a complete vehicle combination. As a substitute a model was made for separate testing of a trailer. The hitch point at the motor vehicle for the drawbar is in this model following a predetermined path at a predetermined deceleration, independent of the forces that arise at the hitch point.
13
The brake pressure signals are converted into corresponding brake torque by means of a brake model that includes pushout pressure and hysteresis. It is also possible to set different gradients when pressure is rising and decreasing.
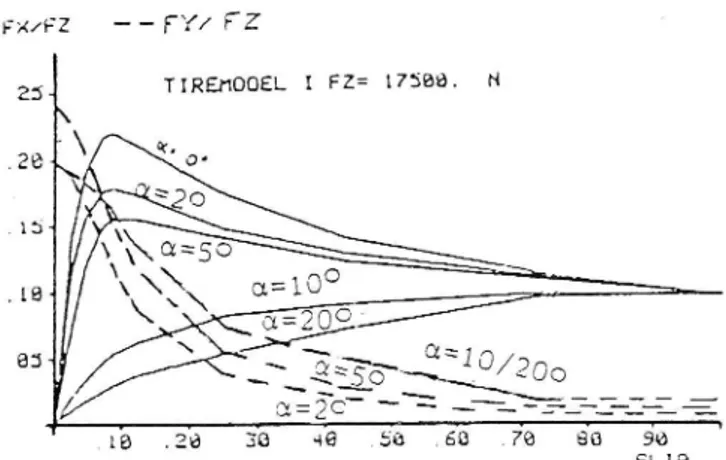
The tyre model which is of a matrix type allows close adaptation to measured tyre data. An example of a data matrix used in the validation simulations is shown in Figure.11.
Fx/FZ - ry/ rz 25% TlREnOOEL I FZ: 17368. H \ .ze Q , =20** o. 154 ' \ \\\\\O£:SO .l.8< 851
Figure 11. Tyre data matrix for combined braking and cornering used in simulation Longitudinal and lateral friction force numbers are read into the matrix as follows
X: f(a SaFZ)
uy: f(oc,s,FZ)
CL = tyre side slip angle s = longitudinal tyre slipFZ: normal wheel reaction force
Both |le and Hy are de ned in distinct points. Between these points the friction force numbers are calculated by means of linear interpolation. The calculation time limits the number of elements in
the matrix . The matrix that was used at the simulation had the dimension f(5,10, 3).
The interaction between left and right drive wheel due to the differential gear is described in the model.
With the computer programme it is possible to simulate:
- Straight braking on a homogeneous surface
- Straight braking on a split friction surface with steering corrections based on
yaw motion feed back.
J turn braking with constant steer input applied at he same time as the brakes. Braking on a surface with changing friction can also be simulated as the
computer programme contains two tyre models for each wheel.
Validation simulations have been performed with a two axle truck with an unladen weight of 6500 kg and a laden weight of 13000 kg . The vehicle was equipped with three different types of antilock systems . This vehicle was also used in the already
14
mentioned tests on real ice tracks, split friction tracks as well as on high friction tracks. The following test were used for the validation:
- Straight braking on homogeneous ice . Initial speed 10 and 20 m/s
- Straight braking on a split friction surface . Initial speed 10 m/s
- J - turn braking on ice with constant steering input corresponding to 100 m
radius steady state cornering. Steering is applied at the same time as the brakes. Initial speed 11 m/s
- Straight braking on a high friction surface with the peak friction coefficient 0.6.
Initial speed 20 m/s
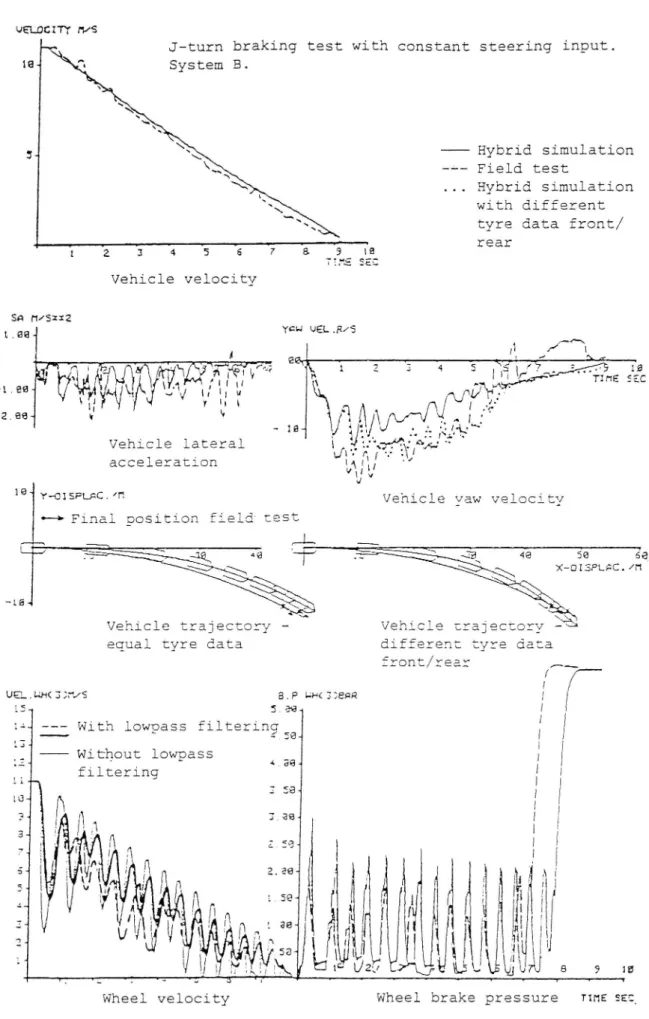
In all the tests the ranking order in performance of the antilock systems was the same in simulation and real test. The general characteristics in terms of deceleration, lateral acceleration and yaw behaviour over time were also quite well reproduced. This also applies to wheel speeds and brake pressures. Examples of test results are given in Figure 12. Tests were made both with identical tyre data on front and rear wheels and with somewhat reduced friction on the rear wheels.The best results were obtained in the latter case. This is in line with the fact that ice friction is reduced by the polishing effect of slipping tyres . In this case the front tyres polish the ice for the rear tyres. New soft and hardware with a specially designed parallel processor system has recently been developed at VTI (Palmkvist 1991). The purpose was to reduce the
computing time for wheel velocities and tyre forces from 5 to 1 ms and at the same
time allow for more wheels and more detailed tyre data. The system is however not yet incorporated in the hardware in the loop ABS simulation program.A new real time computer program for simulating complete heavy vehicle
combinations such as truck full trailer and tractor semitrailer combinations is now available at VTI that is suitable for expansion to a hardware in the loop simulation system. This program was developed for a moving base truck driving simulator described in the following. VTI has asked for funding for development of a new generation hardware in the loop simulation system based on this program.
Driving simulators developed by VTI suitable for hardware in the loop simulation research and development of ABS and electronic
braking-In 1984 a large moving base driving simulator with a passenger car cabin developed entirely by a VTI team , ( Nordmark, 1984 and 1990) became operational and has since then been successfully used in human factors research as well as for evaluating vehicle simulation models and car handling characteristics.
In 1991 a second generation moving base driving simulator with a complete truck cabin also developed by the same VTI team and ordered by the Swedish ensurance company Trygg Hansa was completed and taken into operation at the demonstration and test facility Protectum owned by Trygg Hansa. The general design of the simulator is shown in Figure 13.
The moving base of the driving simulator is powered by servo hydraulic cylinders. It has a large lateral motion of about +/- 3 m and in addition lateral tilt motion for simulation of steady state lateral acceleration. The simulation of longitudinal acceleration
15
uancnmrvs
constant steering input.
J turn braking test with
194 System B. Hybrid simulation gi Field test Hybrid simulation with different
tyre data front/
. ~ rear 1 lG se: Vehicle velocity Sn n/szxz L,68 You UEL.R/3 AK ,i J/a 1 ÖfÄ , A
. 7; * E if
H Sig ?
-1 . es fr.U j M/(yxlVal,/711! :: 1:, t' x17 UD. FM ' & _ 134 -/1A/X/%.].ånfå*ä -2.88 Vehicle lateral acceleration Jak;v ( I V 191 Y OISPLFC.
***Final position iieiu
_ ' 46 56 äe
X DISPLQC./n
Vehicle trajectory Vehicle trajecto
equal tyre data different tyre data
front/rear ,___ 8.P L4H<338QF2 UEL.uH(33 /S 5 .eg 4 I |. su
With lowpass filteringQQ
1 f
'#
l
) U l U | _ - -Without lowpass *_g .;< .d 4 V filtering f ' in 359 ; f * i 34 P 4 3394 l i 34 ~ i! 1.3 l ; -7 I: . i'll I, I 2 S*? ; | ' ff' n a' ': Vil ' ' l
: i ' _ * I2'98 ! ; i
7 r '|
!
s1! N i
1 ! w m . _ _ c r *i f * , . . . ä n * i ) , I aiwptas ;:., II,-1] m [ ' 153ser? ..
&/L
| 1 l t: & * : : T SJ 4 1 1 . i | 43 U, i: h ? - I) i |Y 1 in låg? vi!& &I )!\J\4Aj8 9 ie
Wheel velocity Wheel brake pressure iwnssze
A 'lglq 'i l i! lf H*
Figure 12. Examples of validation test results from (Palmkvist, Nordström, 1983)
16
is also achieved by a combination of linear and tilt motion. In this case the linear motion is however quite short. The roll and pitch motion of the cabin relative to the computer simulated visual world as well as road and engine induced vibrations is achieved by
means of separate hydraulic cylinders. The visual system consists of three video _
projectors covering a 120 ° wide angle screen of the dimensions of approximately 2x 5 m. The cabin is fully instrumented and equipped with an advanced audio system and a real air brake system. Single trucks as well as truck semitrailer and truck full trailer combinations can be simulated under different road and traf c conditions. Professional truck drivers have found the simulator very realistic. It has been described more in detail at the AVEC'92 conference in Yokohama, (Nordmark, 1992).
The simulator is already being used for special education of truck drivers in matters like overturning risk and braking behaviour on slippery surfaces. As a future
development the simulation of vehicle behaviour at antilock braking and acceleration with antispin regulating devices using real system hardware in the loop is envisaged.
Figure 13. The Trygg Hansa truck driving simulator
Summary and conclusions
Present ABS evaluation methods and requirements in ECE/EEC regulations need further improvement.
Friction values measured with a standard test tyre on a standard friction trailer using xed longitudinal slip braking of the test wheel is proposed to be used as normalising reference value for braking performance requirements.
Truck tyre characteristics on low friction surfaces such as ice are still not very well known but important for ABS performance evaluation in terms of stability, steerability
17
and brakeability. The VTI tyre test facility is a a tool for investigations on ice
independent of weather conditions open for use by both authorities and manufacturers. Full scale testing of electronic braking systems under all desirable conditions is
difficult for reasons of safety, time and economy.
Hardware in the loop simulation is a promising possibility. Advanced driving simulators are now available with suitable software for this technique. They are also useful for validation of simulation test methods without a human driver such as open loop tests or tests where some kind of driver model is used. This is done by means of similar tests driven by real drivers in the simulator as a substitute for full scale tests that for cannot be done for safety reasons.
References
Nordmark, S. (1984), VTI driving simulator. Mathematical model of a four wheeled
vehicle for simulation in real time. VTI Report 267A. Linköping, Sweden ,VTI
Nordmark, S. (1990)VTI ' The VTI driving simulator. Trends and experiences. VTI
Report 362A. Proceedings ofROAD SAFETY AND TRAFFIC ENVIRONMENT IN EUROPE in Gothenburg, Sweden, September 26-28, 1990. Linköping, Sweden ,VTI pp 125-137
Nordmark, S. (1992).'The new Trygg Hansa diving simulator. An Advanced Tool for Research and training. Proceedings of the International Symposium on advanced vehicle control 1992. AVEC'92 in Yokohama, Tokyo, Japan, JSAE pp 475-480. Nordström, O , Samuelsson E.(1990) Road grip of winter tyres on ice. VTI Report No 354 (in Swedish with extensive English summary) Linköping, Sweden, VTI Nordström, O. (1993) The VTI atbed tyre test facility - A new tool for testing commercial tyre characteristics. SAE technical paper series 933006. Reprintedfrom: The in uence of Tire, Axle and Brake Characteristics on truck braking and steering
performance.(SP 1003). Warrendale, USA, SAE
Palmkvist, G., Nordström, 0. (1983) 'Hybrid Laboratory Test Method for Antilock
Systems.'Proceedings of 8th IA VSD-Symposium on the Dynamics of Vehicles on Roads and Railway Tracks Mass USA 1983. Lisse ,Holland Swets & Zeitlinger . Palmkvist, G.(1989)'Parallel Processor System for Real Time Simulation.' Automotive Simulation. Proceedings of the 2nd European Cars/Trucks Simulation Symposium, Schliersee, FRG, May 1989. Berlin, Germany, Springer-Verlag . pp 23-33