VTI särtryck
Nr 226 ' 1994
Laboratory Evaluation of Rutting Potential
of Pavement Layers
Safwat F. Said, VTI
Svante Johansson, Swedish National Road Administration
Prepared for presentation at the Road Safety in Europe
and Strategic Highway Research Program (SHRP)
Conference, Lille, France, 26 28 Sept. 1994
Väg- och
transport-farskningsinstitutet
VTI särtryck
Nr 226 0 1994
Laboratory Evaluation of Rutting Potential
of Pavement Layers
Safwat F. Said, VTl
Svante Johansson, Swedish National Road Administration
Prepared for presentation at the Road Safety in Europe
and Strategic Highway Research Program (SHRP)
Conference, Lille, France, 26 28 Sept. 1994
(db
Väg- och
transport-farskningsinstitutet
,
ROAD SAFETY IN EUROPE
AND
STRATEGIC HIGHWAY RESEARCH PROGRAM (SHRP)
LILLE, FRANCE26 - 28 SEPTEMBER
Laboratory Evaluation of Rutting Potential of Pavement Layers
By
Safwat E. Said Svante Johansson
Road and Transport Res. Institute (VTI) National Road Administration (VV)
Linköping Sweden Borlänge Sweden
Abstract
Rutting of bituminous pavement layers has often been observed in recent years. This is particularly due to increased maximum allowed axle loads from 10 tons to l 1.5 tons in 1993 and due to overlaying on existing wearing courses which are primarily not mix designed for rut resistance.
This paper presents a laboratory procedure for localizing the highest rutting potential of bituminous layers in a multi-layer pavement by using a static creep test. Cores with more than one layer have been tested at 60°C. The procdure has been evaluated by testing each layer by the dynamic creep test at 40°C and a newly developed shear test.
&)
Background
Permanent deformation of bituminous pavement layers has often been observed in recent years. Increased traf c volume, increased maximum allowed axle loads from 10 tons to 1 1.5 tons in 1993 and the tendency of higher tire pressure have accelerated the rutting on the road network. An indirect cause is the overlaying of existing wearing courses which are primarily not mix designed for rutting resistance. For instance, in the early 805 mixes with chippings, which require higher binder content than normal mixes, have been used in order to increase the wear resistance of surface layers against studded tires which was a big problem then. Before maintaining a rutted road section, it is valuable to know which layer has a high rutting potential, otherwise the overlay surface may be rutted very soon after overlaying due to continuous deformation in the lower layers. Normally the uniaxial creep test is conducted to find mixtures with low resistance to permanent deformation. However, in many roads thin bitumen-bound layers, about 20 mm, are not unusual. These thin layers make it unpractical to use the normal creep test which needs a 60 mm thick specimen.
Furthermore, it is expensive, complicated and time-consuming to use more than one core in order to reach the recommended specimen thickness.
This paper presents a laboratory procedure for localizing the highest rutting potential of bituminous layers in a multi-layer pavement by using a static creep test. Cores with more than one layer have been tested at 60°C. This procedure has been evaluated by testing each layer with a dynamic creep test according to normal procedure at 40°C and a recently developed
shear test.
Laboratory evaluation of bituminous pavement layers
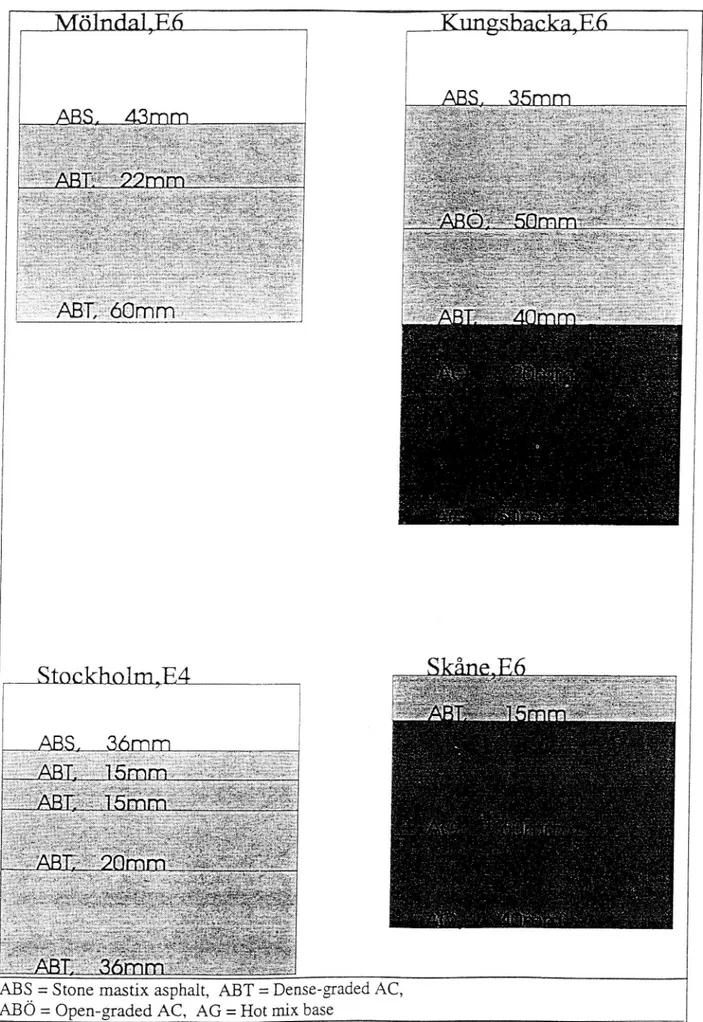
Cores from four road sections with rutting damages located throughout the country have been taken for laboratory analysis. About 20 cores from each road section were taken through the pavement layers. They were taken outside the vehicle wheelpaths from the least trafficked area. The thickness of the cores was at least 120 mm with a diameter of 100 mm. The number of layers and type of mixtures are determined for each core by visuell inspection and available documents. Figure 1 shows the type and the number of pavement layers in studied sections. Specimens were tested by the following methods:
0 Uniaxiai, uncon ned compressive static creep test at 60°C on multi-layer specimen. o Uniaxial, unconfined compressive dynamic creep test at 40°C on single-layer specimen. 0 Shear modulus over a range of frequencis at 40°C on single-layer specimen.
Uniaxial static creep test
The minimum of one specimen from each road section has been tested by the uniaxial unconfined compressive static creep test at 60°C. The thickness of the specimens varied depending on the number and the thickness of the pavement layers. Specimen preparation before testing was as follows:
o Cores were sawed at both ends. The saw gig in Figure 2 has been used to get parallel ends. o The ends of the specimens were polished by a polishing apparatus (Planopol-B) with a 250 micron diamond pad (Figure 3).
0 The specimens were painted (Figure 4) in order to make it easy to detect the deformed layer. o The ends of the specimens were lubricated with silicon grease and graphite powder to . minimize friction.
Parallel sawing, polishing and lubricating the ends of specimens are important to guarantee the uniaxial condition during testing. In addition to the specimen s thickness this testing procedure differs from the usual static creep test (1) by testing with 0.2 MPa loading at 60°C
instead of 0.1 MPa loading at 40°C and the deformation is not measured here. The test is
finished in a few minutes. The first deformed layer is examined by ocular inspection during testing. Figure 4 illustrates an example of the tested specimens and Table 1 shows the results. Table 1. The most potential layer for permanent deformation.
Road section Specimen s height (mm) No. of layers Firstly deformed layer
Mölndal,E6 1 18 3 2
Kungsbacka,E6 182 5 2
Stockholm,E4 107 5 2,3&4
Skåne,Eö 109 3 1&2
Two specimens were tested from the Stockholm road section. ln both cases the 2nd, 3rd, and 4th layers were deformed almost at the same. time during testing. Three specimens were tested
from the Skåne section. The thickness of the lst layer varied between 5 and 14 mm after
sawing.
Dynamic creep test
To verify the conclusions from the static creep test on multi-layer specimens the usual
dynamic creep test (l) was conducted in this investigation with 0.1 MPa compressive stress at 40°C. Each cycle consists of 1 sec loading and 1 sec unloading time. Each pavement layer has been tested separately. The specimens should be 60:t5 mm in thickness why we had to put the same layers from different cores together in order to be close to 60 mm in thickness.
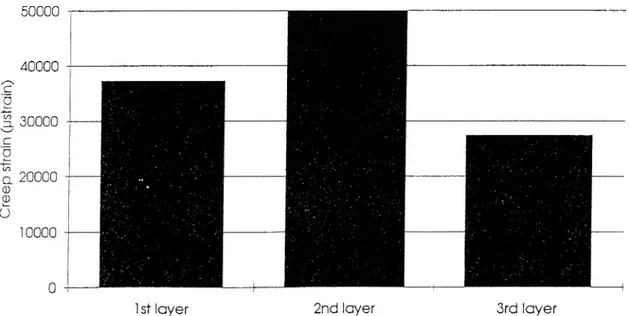
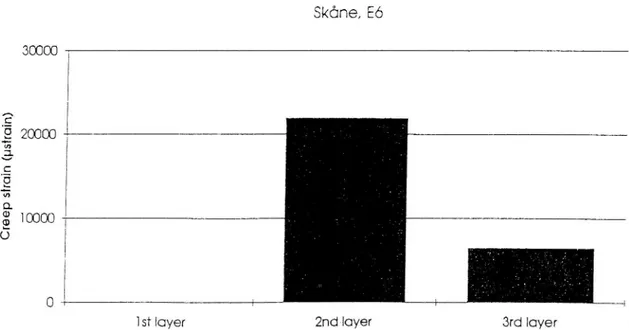
Figures 5 to 8 show the results of the dynamic creep tests. The upper layer from the Skåne road section was impossible to test as it was too thin. In the specimen from Stockholm E4, the
2nd, 3rd, and 4th layers have been tested together as one layer because they were to thin and
had been deformed at the same time during the static creep test. In three of four cases the conclusion is in accordance with the results from the static creep test in arranging the most potential layer for permanent deformation. _
The vertical strains for the tested layers at 3600 loading cycles are relatively high (20000
-50000 ua) except the 3rd layer from the Skåne section. The corresponding values for normally performed wearing and base course layers are less than 20000 its. Tested specimens are from rutted areas therefore high strains were expected. The results of tested specimens from the Skåne road section are relatively good. The 2nd and 3rd layers have a strain of 21000 ue respectively 1 1000 ue (Fig.8) after 3600 loading cycles. Indeed the bitumen bound layers, in this section, are laid on an old concrete pavement which makes the asphalt layers more sensitive to permanent deformations.
Shear test
Pavement deformation in bituminous layers is mainly caused by shear deformations. There is a need for a simple test method which can be used to evaluate the shear properties of
bituminous layers, particularly for thin pavement layers (20 - 40 mm). The usual uniaxial
creep test needs specimens with a thickness of 60 mm. This is unpractical for thin pavement layers which are very common in Sweden.
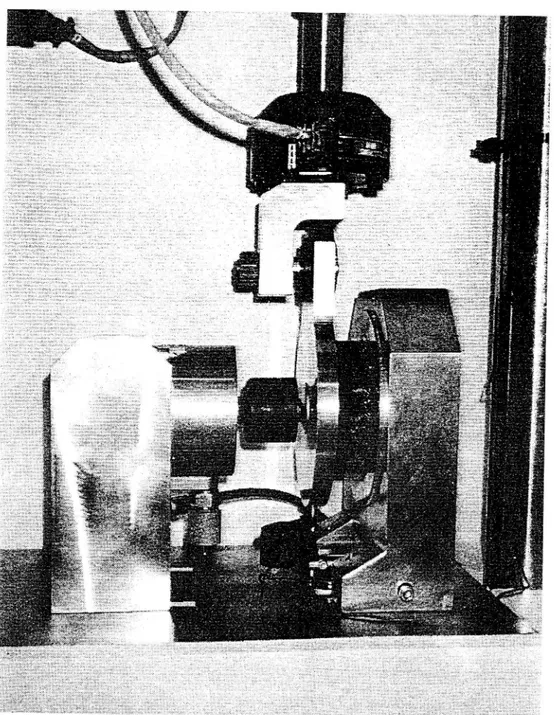
Figure 9 shows a recently built shear test device fitted for asphalt concrete specimens which is in principal similar to the shear test for unbound materials (2). A cylindrical specimen is glued
between two steel plates with epoxy glue. One of them could be exposed to a different type of
loading, in this case sinusoidal loading, over a range of frequencies. A normal constant
compressive stress is applied parallel to the axis of the specimen (0.31 MPa). Briquet
specimens, 100 150 mm in diameter, may be tested. The thickness of the specimen should be less than % of the diameter in order to be close to pure shear state (3). Therefore it is possible to test thin specimens with actual pavement layer thickness.
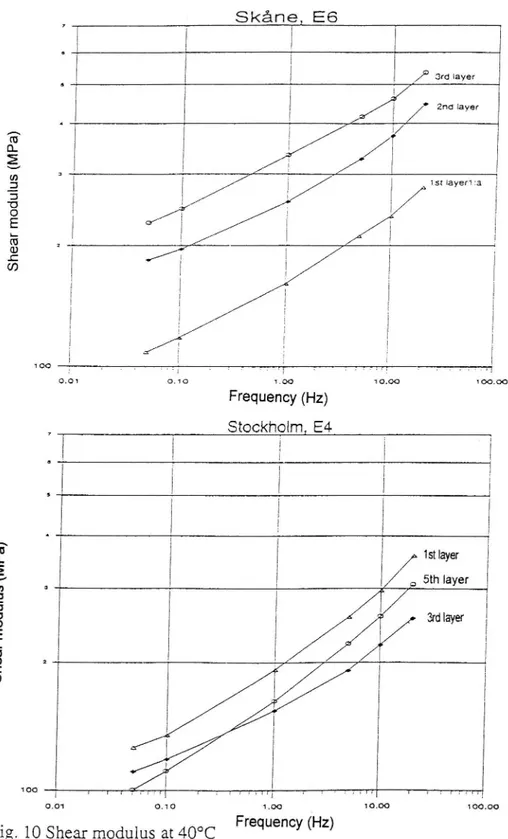
Specimens from three upper layers of the Skåne and Stockholm road sections have been tested by this method. Figure 10 shows the shear modulus of tested pavement layers at different frequencies. Each curve is an average of two Specimens tested at 40°C. Tested layers from the
Skåne section have shown that the lst layer is most sensitive to permanent deformation (low
shear modulus). When comparing the results from the static creep test, it is not obvious that the corresponding layer is the most sensitive to deformation. This is probably due to the fact
that the layer is very thin and the stress condition at the ends of the specimen is not dominated
by uniaxial state stress. Otherwise the rank of pavement layers in respect of resistance to permanent deformation is in agreement with the rank from the static creep test with multi layer specimen and dynamic creep test. Only the 2nd layer from the Stockholm road section
has shown a higher shear modulus at low frequencis, less than 0.3 Hz, which is in
contradiction to creep test results.
Summary
With the increased rutting observations on the road network, the ability to quantify and compare bituminous pavement layers, including asphalt mixtures, are of great importance when evaluating existing pavement layers and developing a reliable mix design method. The widely used creep test using specimens with a thickness of 60 mm is unpractical for
characterizing asphalt mixtures using cores from thin pavement layers (20-40 mm) which are common in Sweden.
In this investigation, cores from four severely rutted road sections have been tested by three methodsThe results have shown that it is possible to test a multi-layer specimen taken from the field by the static creep test for localizing the highest deformation potential of bituminous layers. This procedure has been veri ed by testing specimens from each layer using the
dynamic creep test and measuring the shear modulus over a range of frequencies. However, care should be taken when there is a thin layer at the end of specimen and it needs more research to quantify the rutting behaviour of pavement layers for example by coming to some limit value for rutting resistant pavements. It is also clear that additional tests are needed before a generally valid evaluation of this procedure.The shear test has shown very practical
for testing thin specimens, an advanced test system is, however, required.
References
1. Said SF. and Karlsson L. Creep characteristics of asphalt concrete using uniaxial test - test procedure VTI notat nr 41-1994, Linköping, Sweden. In Swedish.
2. L. Bjerrum and A. Landva Direct Simple Shear Tests on a Norwegian Quick Clay Geotechnique, vol. XVI. The Institute of Civil Engineers, London 1966.
MÖlndaLEö
Stockh01m3E4
= Stone mastix asphalt, AB = Dense-graded AC, : Open graded AC, AG = Hot mix base
;oa oåi ,ms äää mw aEm mom m. mE x») . n .. v$. gl ba ph ? & .)) v? Lvo &». ..t h . sue .;:
ss. , erk;(.( iJa? u»...».vät. . ._. ,_ ..(% fon..,
hle oQJ NMs Wo tws % vw .. kw .. . w.» , ...( / wua .hw AK. . s . LN .u..»ot...;___troo 94 .4i... . nu» kv. .., vv? » ny/ %%
Fi g. 4 Ex am pl e of de fo rm at io n de ve lo pm en t by st at ic cr ee p te st at 60 °C
Mölndal, Ea 50000 40000 30000 20000 C r e e psl ra in (p slra in ) l 0000
lst layer 2nd layer Bra layer
Fig. 5 Dynamic creep of pavement layers, Mölndal, after 3600 loading at 40°C
Kungsbacka, Eö 50000 40000 30000 20000 Cr ee p sl raln (p sl ra ln ) l 0000
lsl layer 2nd layer Bra layer
Stockholm, EA 70000 60000 50000 40000 30000 Cr eep st ra in(p sl ra in) 20000 l 0000
lsl layer 2na 3rd & 4th layers öm layer
Fig. 7 Dynamic creep of pavement layers, Stockholm, after 3600 loading at 40°C
Skane, Eo 30000 , 20000
Cree p sl rain (p sl rain )
lst layer anlayer 3rd layer
Fig. 9 Shear test x: .EZ )i _» ' ') . ZSJJ ZÄ ÄÄ ?! ; , m m '> ' tW/n fk » 10
Fig. 10 Shear modulus at 40°C Frequency (Hz) 0.01 10.00 100.00 100 Shea r modu lu s(M Pa ) Frequeucy (Hz) Stockhglml E4 1st layer Sth layer 3rd layer