Licentiate Thesis in Civil and Architectural Engineering
Investigation of the structural
response of pavements in cold region
using instrumented test site data
DENIS SALIKO
Stockholm, Sweden 2021
kth royal institute of technology
Investigation of the structural
response of pavements in cold region
using instrumented test site data
DENIS SALIKO
Licentiate Thesis in Civil and Architectural Engineering KTH Royal Institute of Technology
Stockholm, Sweden 2021
Academic Dissertation which, with due permission of the KTH Royal Institute of Technology, is submitted for public defence for the Degree of Licentiate of Engineering on Wednesday the 24th March 2021, at 14:00 in M108, Brinellvägen 23, Stockholm.
© Denis Saliko
© Sigurdur Erlingsson, Paper 1, 2, and 3 ISBN 978-91-7873-807-6
TRITA-ABE-DLT-2034
Investigation of the structural
response of pavements in cold
region using instrumented test
site data
Denis Saliko
Licentiate Thesis, 2021
KTH Royal Institute of Technology
School of Architecture and the Built Environment Department of Civil and Architectural Engineering Division of Building Materials
TRITA-ABE-DLT-2034 ISBN 978-91-7873-807-6
Printed in Sweden by USAB, Stockholm, 2021 © Denis Saliko, 2021
Akademisk avhandling som med tillstånd av KTH i Stockholm framlägges till offentlig granskning för avläggande av teknologie licentiatexamen inom byggvetenskap, byggnadsmaterial, onsdagen den 24:e mars kl. 14:00.Avhandlingen försvaras på engelska.
iii
Abstract
The structural behaviour of pavement structures is known to be affected by the traffic-related loading and by the ambient factors to which the structure is subjected. A new mechanistic-empirical (M-E) pavement design method is under development in Sweden with the main purpose to adequately predict pavement structural response and performance. An M-E design method for a flexible pavement means application of the principles of engineering mechanics to evaluate the response of pavement structure to traffic loading and much improved design methods to carry out distress prediction or how performance changes with time. This would ensure a fundamental understanding of how the pavement structure responds to a certain action or loading conditions.
The mechanistic-empirical approach is more flexible as it is able to adapt to new situations such as new pavement materials and loading situations. It is important to take into account the real loading and climatic conditions and predict the resulting changes in material properties and structural behaviour at the time of loading as well as in the long-term. New models are therefore required for the further development of pavement design method, and it needs to be validated through reliable data obtained through realistic measurements.
In this licentiate thesis, the effects of the environmental factors and loading by heavy vehicles in pavements are investigated. The results of the study are based on environmental data from multiple locations in Sweden and on measurements from two instrumented road sections located near the village of Långträsk in the northern part of Sweden. Both roads consist of
ABSTRACT
iv
thin flexible pavements, the behaviour of which is highly dependent on the variation of the temperature of the asphalt layer, the moisture content in the unbound granular layers, and frost depth conditions.
The licentiate report consists of three scientific publications.
Paper 1 presents a country-specific case study in which the frost penetration depth in various Swedish roads is predicted by a statistically derived empirical model that uses the air freezing index calculated from the air temperature as an input. The model correlation is based on meteorological data from 44 meteorological stations and pavement cross-sectional temperature distribution data from 49 road weather information system (RWIS) stations over all five climatic zones throughout all of Sweden.
Paper 2 focuses on the response of an instrumented test section subjected to loading by falling weight deflectometer (FWD) and heavy vehicles. The mechanical response instrumentation consisted of asphalt strain gauges (ASG), strain measuring units (εMU), and soil pressure cells (SPC) installed at different locations in the structure. The layer stiffness values were obtained via backcalculation based on the FWD surface deflections bowls. The recorded values of the mechanical response were compared against calculated values by multilayer elastic theory (MLET) based software. Three different heavy vehicles weighing from ~64 tons to ~74 tons were compared in terms of damage caused to the pavement structure. It was found that if the number of axles was increased and dual tyres were used, longer heavier vehicles were not more destructive to the pavement structure than shorter vehicles with fewer axles and higher axial load and tyre pressure.
In paper 3, the effect of the seasonal variation of the environmental factors on the behaviour of an instrumented road test section was investigated. The same loading configuration described in paper 2 was used on four different measurement campaigns in different seasons over the span of 1 year. The environmental variables were monitored throughout the year by asphalt thermocouples, a frost rod, and time-domain reflectometer (TDR) probes. The mechanical response sensors and the environmental sensors were found to be a reliable data collection method throughout the entire year. By comparing the recorded response values to the MLET calculated
ABSTRACT
v values, it was shown that it is possible to model the mechanical behaviour of pavement structures using linear-elastic MLET if the temperature variations in the asphalt layer and the moisture variations in the granular layers are taken into account.
Keywords:
Flexible pavement, Environmental impact, Seasonal variation, Heavy loading, Non-destructive testing, Instrumented section.
vii
Sammanfattning
Utvecklingen av det strukturella tillståndet av vägbyggnader är beroende av trafikmängd samt vägkonstruktionens omgivningsfaktorer. En mekanistisk-empirisk dimensioneringsmetod för vägkonstruktioner är under utveckling i Sverige med huvudsyftet att på realistiskt sätt kunna förutsäga vägens respons och tillståndsutveckling. En M-E dimensionering betyder att man applicerar mekanistiska grundprinciper för att bestämma vägkonstruktionens respons under trafikbelastning och tillämpar sedan överföringsfunktioner för att förutsäga nedbrytningsförloppet. Att använda en mekanistiskt baserad metod innebär att man får en grundläggande förståelse av hur vägkonstruktionen svarar på en specifik påverkan eller belastning. Detta mera realistiska tillvägagångsätt ger dessutom ökad flexibilitet och gör att metoden kan appliceras vid nya belastningsfall eller under nya klimatförhållanden. Det blir därför möjligt att ta hänsyn till det riktiga belastningsfallet under de rätta klimatförhållandena. Detta gör att nya modeller för vägkonstruktionens respons behövs och att dessa måste valideras för realistiska trafikbelastningsfall.
I denna licentiatavhandling undersöks hur omgivningsvariabler och trafikbelastning från tunga lastbilar påverkar vägkonstruktioner. Resultat från denna studie bygger på omgivningsdata från ett stort antal mätstationer i Sverige och från mätningar från två instrumenterade vägsträckor nära byn Långträsk i Norrland. Båda vägkonstruktionerna består av tunna vägöverbyggnader och därför är responsen starkt beroende
SAMMANFATTNING
viii
av beläggningstemperaturen och fuktinnehållet i vägbyggnadens obundna lager samt frostdjupet.
Rapporten bygger på tre publikationer.
Första artikeln presenterar hur frostdjup i svenska vägar kan förutsägas utifrån en statistisk modell som använder ett frostindex beräknat från lufttemperaturen. Modellen bygger på en anpassning av data från 44
meteorologiska väderstationer och 49 av Trafikverkets
väderinformationsstationer distribuerade över alla fem klimatzoner i Sverige.
Den andra artikeln fokuserar på responsmätningar från en instrumenterad vägtestplats där både fallvikt samt tunga lastbilar har använts för lastgenerering. Den vägtekniska instrumenteringen bestod av asfalttöjningsgivare (ASG), trycktöjningsgivare (MU), och jordtyckceller (SPC) installerade på olika djup. Styvhet av de olika lagren bakberäknades baserat på data från fallviktsmätningarna. De registrerade värdena från de vägtekniska givarna jämfördes med desom beräknades med hjälp av beräkningsverktyget ERAPave. Tre lastbilar med den totala tyngden mellan ~64 – ~74 ton användes sedan för att jämföra deras relativa nedbrytningseffekt. Slutsatsen är att om antal axlar ökas med ökad tyngd och om parmonterade däck användes är nedbrytningseffekten från 74 ton lastbil inte större än från en lättare lastbil med färre axlar.
I artikel tre fokuseras det på effekten av hur klimatfaktorer påverkar vägkonstruktionens respons. Samma lastbilar som i den andra artikeln användes under fyra mätkampanjer vid olika tidpunkter på året. Omgivningsparametrarna registrerades i form av beläggningstemperatur och fukt i de obundna lagren samt frostdjupet. Vägens mekaniska respons
beräknades genom att uppdatera styvhetsmodulerna utifrån
beläggningens temperatur och de obundna lagrens med fuktkvoter och jämföra med de uppmätta responsvärdena. Beräkningsmetodiken visar sig ge bra överensstämmelse med det om uppmättes.
Nyckelord
Flexibla vägkonstruktioner, Omgivningspåverkan, Säsongvariation, Tung trafikbelastning, Oförstörande provning, Instrumenterade teststräckor.
ix
Preface
The research presented in this licentiate thesis was carried out at the Swedish National Road and Transport Research Institute (VTI) under the framework of a project funded by the Swedish Transport Administration (Trafikverket).
I would like to thank Trafikverket and VTI for the financial support and Prof. Sigurdur Erlingsson for his guidance throughout the study.
Linköping, December 2020
xi
Contents
Abstract ... iii Sammanfattning ... vii Preface ... ix Contents ... xiList of figures ... xiii
List of appended papers ... xvii
Terminology and abbreviations ... xix
1. Introduction ... 1
1.1.GENERAL OVERVIEW ... 1
1.2.OBJECTIVES AND SCOPE ... 4
2. Cold region pavement behaviour ... 5
2.1.FAILURE MODES ... 5
2.1.1. Rutting ... 6
2.1.2. Fatigue cracking ... 8
2.1.3. Failure modes typical to cold region pavements ... 8
2.1.4. Other failure modes ... 10
2.2.SEASONAL VARIATION OF TEMPERATURE ... 10
2.3.FROST PENETRATION ... 12
2.4.SEASONAL VARIATION OF MOISTURE ... 13
CONTENTS
xii
3.1.MECHANICAL BEHAVIOUR MONITORING ... 17
3.2.TEMPERATURE DISTRIBUTION MONITORING ... 19
3.3.MOISTURE DISTRIBUTION MONITORING ... 20
4. Modelling and validation of pavement behaviour .... 23
4.1.MECHANICAL MODELLING AND VALIDATION ... 23
4.1.1. Loading by falling weight deflectometer ... 25
4.1.2. Loading by heavy vehicles ... 27
4.2.STIFFNESS CHANGES DUE TO SEASONAL VARIATIONS ... 29
4.3.MODEL FITTING ... 30
5. Summary of the papers ... 33
5.1.PAPER 1: ... 33
5.2.PAPER 2: ... 37
5.3.PAPER 3: ... 43
6. Discussion and recommendations ... 47
xiii
List of figures
Figure 1: Typical mechanistic-empirical pavement design procedure flowchart (Ahmed, 2014) ... 2 Figure 2: Typical flexible pavement distress modes (Papagiannakis and Masad, 2008) ... 6 Figure 3: Air temperature, precipitation and the moisture content of different layers for a pavement located near Svappavaara, northern Sweden (Erlingsson and Ullberg, 2018) ... 11 Figure 4: Trumpet diagram of pavement temperature variation over 3 months (Feb-May) for a station located in southern part of Sweden (Salour, 2015) ... 11 Figure 5: Interpolated frost penetration depth for a RWIS station located near Buskhyttan for the period 2006-2018 ... 13 Figure 6: Gravimetric moisture content registrations within unbound granular layers over 1 winter season (Erlingsson et al., 2009a) ... 14 Figure 7: The distribution of moisture in the pavement cross-section by zone and the relation to subsurface water (Erlingsson et al., 2009b) ... 15 Figure 8: Mechanical behaviour monitoring instrumentation ASG (left), SPC (middle), εMU (right) (Erlingsson and Carlsson, 2018) ... 18 Figure 9: Distribution of mechanical behaviour monitoring sensors within a pavement structure's cross-section (Erlingsson and Ullberg, 2018) .... 19
List of figures
xiv
Figure 10: In-situ installation of 20 cm long TDR probes mounted on a 200 cm moisture rod (Erlingsson and Carlsson, 2014) ... 20 Figure 11: Schematic illustration of a multilayer system subjected to a circular load and the state of stresses on a structural element subjected to loading (Huang, 2004) ... 24 Figure 12: Schematic illustration of the components of a falling weight deflectometer (Doré and Zubeck, 2009) ... 26 Figure 13: Long heavy vehicles (LHVs) passing on top of the sensors of an instrumented test section in road 515 near Långträsk ... 28 Figure 14: Structural response registrations under LHV loading and the comparison to MLET modelled values a) longitudinal strain and b) vertical stress ... 28 Figure 15: Temperature registrations and calculated freezing index for meteorological station 326 located near Uppsala for winter 2010-2011 (Erlingsson and Saliko, 2020)... 34 Figure 16: Pavement cross-sectional temperature registrations for 3 different stations in Sweden for a winter season 1 October – 31 May (Erlingsson and Saliko, 2020)... 35 Figure 17: Freezing index - frost penetration depth empirical correlation (Erlingsson and Saliko, 2020)... 36 Figure 18: Instrumentation of the pavement cross-section in roads 515 and 373 ... 37 Figure 19: Measured and calculated FWD deflection bowls and EMU vertical strain ... 38 Figure 20: Schematic illustration of the half-axial configurations of the LHVs used ... 39 Figure 21: Structural response recorded by longitudinal ASG, transversal ASG, SPC, and εMU under loading by LHV1 ... 40
LIST OF FIGURES
xv
Figure 22: Comparison between the measured and calculated axial peaks ... 41 Figure 23: Variation of the AC temperature and UGM moisture in road 515 over one year ... 43 Figure 24: Cross-sectional temperature variation and frost penetration in road 515 over one winter season ... 44 Figure 25: Adjustment of AC layer stiffness according to temperature, and the UGM stiffness according to moisture content ... 44 Figure 26: Measured and MLET calculated deflection bowls for the a) August 2018, b) May 2019, c) June 2019, and d) August 2019 measurement campaigns ... 45 Figure 27: Measured against calculated response values for ASG longitudinal strains during the a) August 2018, b) May 2019, c) June 2019, d) August 2019 measurement campaigns ... 46
xvii
List of appended papers
This licentiate thesis is based upon the following scientific articles:
Paper 1
S. Erlingsson and D. Saliko (2020) “Correlating Air Freezing Index and
Frost Penetration Depth: A Case Study for Sweden”, In Proceedings of the 9th International Conference on Maintenance and Rehabilitation of Pavements—Mairepav9, Springer, Volume 76, pp. 847-857.
doi: 10.1007/978-3-030-48679-2_79
Paper 2
D. Saliko and S. Erlingsson (2021) “Damage Investigation of Thin Flexible
Pavements to Longer Heavier Vehicle Loading through Instrumented Road Sections and Numerical Calculations”, submitted to Road Materials and Pavement Design.
Paper 3
D. Saliko and S. Erlingsson (2021) “Seasonal Variation of the Structural
Response of a Thin Instrumented Flexible Pavement under Heavy Vehicle Loading”, accepted to TRB2021.
xix
Terminology and abbreviations
AC Asphalt Concrete
APT Accelerated Pavement Testing
ASG Asphalt Strain Gauge
BC Boundary Condition
EU European Union
FEM Finite Element Method
FI Freezing Index
FWD Falling Weight Deflectometer
GHG Greenhouse Gas
GPR Ground Penetrating Radar
GWT Ground Water Table
LHV Long Heavy Vehicle
MDAT Mean Daily Average Temperature
MEPDG Mechanistic Empirical Pavement Design Guide
MLET Multilayer Elastic Theory
PMS Pavement Management System
R2 Coefficient of Determination
RMSE Root Mean Square Error
RWIS Road Weather Information System
SMHI Swedish Meteorological and Hydrological Institute
SPC Soil Pressure Cell
TDR Time Domain Reflectometry
1
1. Introduction
1.1. General Overview
Road transport is a major transport mode accounting for 50.1% of the transport of goods in the European Union (EU) in 2018 (European Commission, 2019) and 88% of the goods transport in Sweden in 2014 (Trafikanalys, 2016). In terms of energy consumption, the transport sector accounted for 30.8% of the total energy consumption in the EU in 2018 (European Commission, 2019). The transport sector was the sector with the largest amount of greenhouse gas emissions (GHG) in Sweden in 2018 accounting for 32% of the total GHG emissions, with road transport being the main contributor (Naturvårdsverket, 2020). An increase in the quality of roads may contribute to higher safety due to a reduction in traffic accidents. The number of road fatalities from 2005 to 2015 has been reduced by 43.2% in the EU and by 41.1% in Sweden (EURF, 2017). Thus, the general aim of road-related research is to reduce the costs, energy consumption, and emissions of road construction and maintenance while maintaining the same or improving the quality of roads.
The majority of the roads in Sweden consist of flexible pavements. Pavement structures are required to be designed to support the loads to which they are subjected, provide a smooth surface, and to drain moisture away from the surface throughout their entire service life.
The current pavement design procedures used in most countries worldwide employ conservative design principles and typically consist of
1. INTRODUCTION
2
catalogues and charts based on a step-by-step build-up of knowledge and experience gained through years of research, lab experiments, and field experiments. Recently, newer mechanistic-empirical methods that aim to be more accurate at predicting the pavement behaviour and more flexible to changes in the initial assumptions are being developed by researchers (Ahmed and Erlingsson, 2013; ARA Inc., 2004). At the moment, the pavement design is in a state of transition between the traditional empirical and the newer mechanistic-empirical pavement design. One of the future goals of the pavement design community is to develop new mechanistic methods, validate them, and later implement them into the existing design guidelines. The new guidelines are predicted to offer methods that are more accurate, efficient, and based more on mechanistic principles.
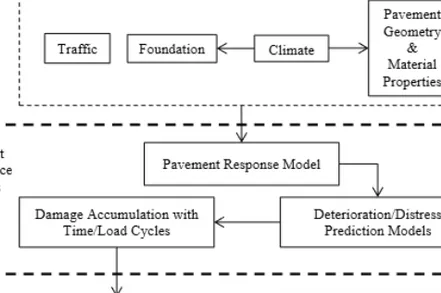
Figure 1: Typical mechanistic-empirical pavement design procedure flowchart (Ahmed, 2014)
Methods for the design of pavement structures typically require the definition of loading by traffic, material and geometric properties, and the effect of climatic factors. Based on these inputs, mechanistic-empirical methods should be able to predict the response of the structure and apply
1. INTRODUCTION
3 models or performance criteria to theoretically determine the service life of the structure and ensure usability during that time. A typical flowchart indicating the steps involved in mechanistic-empirical pavement design is shown in Figure 1. Mechanistic-empirical pavement design methods are required to consider the possible changes in the input values such as the increase of traffic with time, the changing environmental conditions, and new innovative material technologies.
To further develop such design methods, accurate models calibrated by using reliable data are required. Such data may be collected either in the laboratory or by full-scale field testing which typically consists of deflection measurements or road test sections (Pereira and Pais, 2017). The measurements in a full-scale field operation are typically performed while reflecting the real-life conditions to which the pavement is subjected as closely as possible, which makes it a reliable method to collect response data (Lukanen, 2005; Saevarsdottir et al., 2016; Timm et al., 2004). The response measurements from instrumented test sections may be used to evaluate the bearing capacity of the structure (Hugo and Epps-Martin, 2004; Swett et al., 2008), investigating the possible use of new materials (Blanc et al., 2019a), validating existing models (Al-Qadi et al., 2004), and monitoring the changes in a pavement structure over a predefined time (Blanc et al., 2019b).
1. INTRODUCTION
4
1.2. Objectives and scope
This study aims to contribute to the understanding of the effect of environmental variables such as temperature, moisture, and freeze-thaw cycles, as well as loading in the behaviour of flexible pavement structures. The investigation of the possible use of instrumented road sections in the response monitoring of thin flexible pavement structures located in cold regions is also of interest. The specific objectives of the research presented in this licentiate can be summarized as follows:
• Development of a country-specific empirical chart that correlates the freezing index based on air temperature to the frost penetration depth in various roads based on historical data from the past 10 years.
• Estimating the accuracy of modelling the mechanical behaviour of flexible pavements located in cold regions by linear elastic MLET based on stiffness values obtained through FWD backcalculation by comparing with stress and strain values recorded by ASG, SPC, and εMU sensors on an instrumented road section.
• Quantifying the damage caused in a thin flexible pavement structure by long heavy vehicles and comparing between different vehicle types.
• Investigating the suitability of thermocouples, frost rods, and TDR probes in monitoring the seasonal variations of temperature and moisture, as well as freezing-thawing cycles in thin flexible pavement structures located in cold regions.
• Analysing the influence of seasonal variation of environmental variables in the structural behaviour of thin pavement structures by evaluating stress and strain response data from an instrumented road section.
• Modelling the mechanical behaviour of a flexible pavement structure throughout different seasons by using MLET-based software while considering the changes in asphalt layer stiffness due to temperature variations and the stiffness changes in granular layers due to variation of the moisture content level
5
2. Cold region pavement behaviour
Pavements located in cold regions are subjected to low temperatures and frost for long time periods. Their behaviour is heavily influenced by the environmental factors to which the structure is subjected and may be characterized by the temperature, moisture, and pressure regimes within the layers of the system (Doré and Zubeck, 2009). Frost is caused due to low temperatures continuing over a long period of time combined with the presence of moisture in the pavement layers. For any pavement structure, the boundary conditions of the system govern the distribution of temperature and moisture content within the pavement layers (Dysli et al., 1997; Hermansson, 2004). The daily and seasonal variations of the environmental factors to which pavement structures are subjected lead to significant changes in their material properties and structural behaviour.
2.1. Failure modes
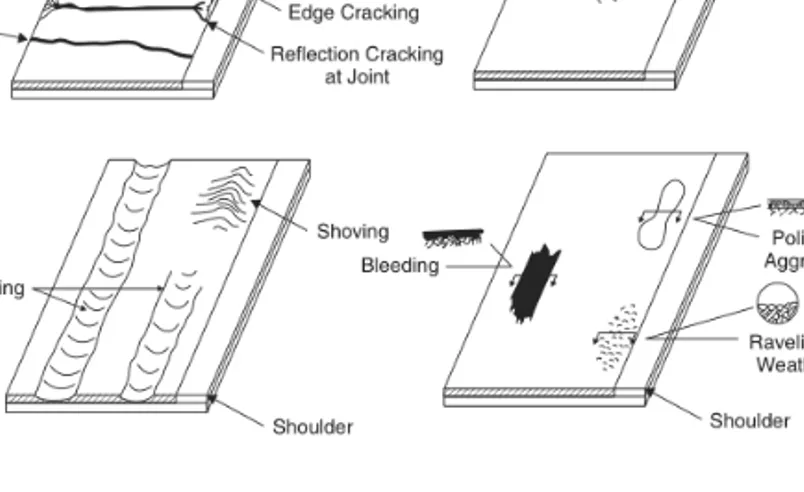
Rutting and fatigue cracking are common modes of failure for pavement structures. For pavements located in cold regions, failure modes such as frost heaving, spring thaw weakening, and low temperature thermal cracking are common as well. Other failure modes include disintegration, ravelling, stripping, and potholes. Figure 2 illustrates some of the typical distress modes for flexible pavement structures.
2. COLD REGION PAVEMENT BEHAVIOUR
6
Figure 2: Typical flexible pavement distress modes (Papagiannakis and Masad, 2008)
2.1.1. Rutting
Rutting may occur due to the accumulation of permanent deformation in any of the pavement layers or by material lateral movement when traffic loading is applied (Roberts, 1996). Rutting typically occurs parallel to the road direction as depression along the wheel path and uplift on the sides. Hydroplaning may occur due to rutting as the depressions may be covered by water in the case of precipitation. Rutting is more common for pavements subjected to high temperatures due to the loss of bearing capacity of the AC layer. For pavements located in cold regions, rutting due to studded tyre wear may occur due to mechanical displacement of the surface material by tire studs. Several models exist for the prediction of the rutting depth-based primarily on an energy approach or a plastic strain approach.
The accumulation of permanent deformation in the AC layer may be calculated using a model that uses temperature and the number of load cycles (ARA Inc., 2004) given in Equation 1.
2. COLD REGION PAVEMENT BEHAVIOUR
7
where T is the temperature in °C, N is the number of standard axles
accumulated, εr is the resilient strain in each loading cycle, and a1, a2, and
a3 are laboratory determined parameters (Ahmed and Erlingsson, 2015).
The accumulation of permanent deformation in the subgrade is based on a model by Tseng and Lytton (Tseng and Lytton, 1989) given in Equation 2.
where ε0, ρ, and β are regression parameters depending on the material
type.
Another approach for the modelling of the accumulation of permanent deformation in UGM is the model by Rahman and Erlingsson, based on repeated loading triaxial testing and adapted for full-scale field use (Rahman and Erlingsson, 2015) given in Equation 3.
where α and b are regression parameters, N is the number of load cycles,
εr is the resilient strain which may be determined using response
calculations.
To add together axles of different sizes the time hardening approach may be used (Erlingsson and Rahman, 2013; Lytton et al., 1993).
Following this method, a physical layer j is divided into i virtual sub-layers
and the surface rutting is calculated by accumulating the permanent deformation for each layer using Equation 4.
where εp,ij is the average plastic strain of the ith sub-layer of layer j, zij the
thickness of the ith sub-layer of layer j, n the number of layers, and i the
number of sub-layers. The time t is defined as a function based on the
number of applied load repetitions.
𝜀𝑝(𝑁) = 𝜀0· 𝑒−( 𝜌 𝑁) 𝛽 · 𝜀𝑟 (2) 𝜀𝑝(𝑁) = 𝛼 · 𝑁𝑏𝜀𝑟· 𝜀𝑟 (3) 𝜀𝑝(𝑡) = ∑ ∑ 𝜀𝑝𝑖𝑗(𝑡) · 𝑧𝑖𝑗 𝑚 𝑗=1 𝑛 𝑖=1 (4)
2. COLD REGION PAVEMENT BEHAVIOUR
8
2.1.2. Fatigue cracking
Fatigue cracking occurs as a result of the failure of the AC due to repeated loading. Under fatigue cracking, smaller cracks develop and extend with time after each loading cycle propagating in a pattern similar to alligator skin. The weakening of the base course due to increased moisture content may increase the tensile deformation of the AC layer and thus accelerate fatigue cracking which typically starts at the bottom of the AC propagating upwards called bottom-up cracking (Roberts, 1996).
For the calculation of the maximum number of cycles to failure due to fatigue, Shell’s equation given in Equation 5 may be used.
where f1, f2, and f3 are constants, εt is the tensile strain at the bottom of the
AC layer calculated by the response model, and E is the stiffness of the AC
layer.
Another approach for evaluating the fatigue cracking criteria is the damage calculations based on Miner’s law given in Equation 6 (Huang, 2004).
where DR is the calculated damage ratio (DR≤1), p the considered period, s
the total number of periods, and m the total number of load groups.
2.1.3. Failure modes typical to cold region pavements
For pavements located in cold regions, frost heaving is a result of upward movements due to expansion of accumulated soil moisture as it freezes. The movements manifest as an irregular pattern of the surface and can cause cracking. The severity of the frost heave depends on the duration and intensity of freezing, water availability in the cross-section, and the frost susceptibility of the layer materials (Caicedo, 2019). A larger frost heave occurs in the case when a pavement structure is subjected to a low-intensity frost propagating slowly over a longer period of time compared to a high-intensity frost with a short time duration. Proper drainage decreases the
𝑁𝑓= 𝑓1(𝜀𝑡)𝑓2𝐸𝑓3 (5) 𝐷𝑅= ∑ ∑ 𝑛𝑖,𝑝 𝑁𝑓𝑖,𝑝 𝑚 𝑖=1 𝑠 𝑝=1 (6)
2. COLD REGION PAVEMENT BEHAVIOUR
9 amount of available water available to travel to the freezing front, therefore reducing the severity of the frost heave. Different soil types have different frost susceptibilities depending on the moisture conductivity of the soil during freezing conditions with silty soils and fine sands being frost susceptible. The underground water table depth affects the severity of the frost heave with decreasing damage reported for pavements in which the water located is located at larger depths (Croney and Croney, 1991). The thawing period which occurs after the freezing stage leads to increased moisture content and weakening of the unbound granular layers (Salour and Erlingsson, 2013). Large moisture increases within a short time are observed due to the phase change of the ice in the frozen part of the pavement cross-section into the water due to the positive temperatures applied from above. The blocking of the drainage path by the ice lenses in the partially frozen part of the cross-section leads to even further moisture content increases at a specific part of the cross-section (Simonsen and Isacsson, 1999). When traffic loading is applied during the thaw weakening, a build-up of hydrostatic pressure in the pores of UGM, pumping of fines with the moisture flowing from the sides, and loss of support may occur. A recovery period usually follows the thaw weakening in which the bearing capacity of the structure is restored over an extended time which is typically shorter for base course materials and longer for the subgrade materials especially if the content of fines is large (Salour, 2015). Low-temperature thermal cracking is typically observed as cracks occurring transversally on the surface of pavements. Cracks may further form in the direction parallel to the road and join the existing transversal cracks forming block cracking. Thermal cracking typically starts from the asphalt concrete layer due to the shrinkage of the AC surface but may also start from the unbound granular layers or subgrade in case of frost due to binding by ice in the pores (Doré and Zubeck, 2009). Lower quality of ride due to the roughness created and infiltration of water which shortens the lifespan of the pavement may occur due to thermal cracks.
2. COLD REGION PAVEMENT BEHAVIOUR
10
2.1.4. Other failure modes
The failure mode in which the surface AC breaks up and loses material is commonly known as pavement disintegration. The most common types of pavement disintegration are stripping, ravelling, and potholes (Roberts, 1996). Ravelling is defined as the disintegration from the surface of the AC directed downwards as the AC aggregate particles get displaced due to the aggregate-binder bond loss. Segregation of aggregates, insufficient compaction, and displacement of aggregates by applied mechanical action may be further causes of ravelling. Stripping is defined as the loss of the bond between aggregates and the binder; however, unlike ravelling, the failure starts at the bottom of the AC due to poor aggregate-binder surface chemistry or moisture presence and propagates upwards (Roberts, 1996). Potholes are defined as bowl-shaped cavities that penetrate the entire thickness of the AC layer and reach the base course. The typical cause of potholes is the combination of fatigue cracking with the disintegration of the AC surface parts located between the alligator-skin shaped cracks.
2.2. Seasonal variation of temperature
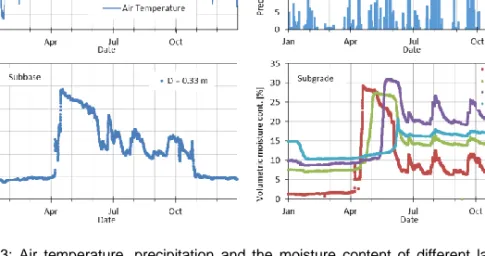
The temperature to which a pavement structure is subjected varies within a day and within a season. The main environmental factors attributing to these temperature changes are solar radiation, geothermal heat flowing from the earth to the surface, emitted radiations from the surface to the sky, convection by air movement at the surface, precipitation such as rain or snow, evaporation in the case of high temperatures, and latent heat of fusion occurring during phase changes such as freezing and thawing (Doré and Zubeck, 2009; Pavlov, 1976). The seasonal variations of air temperature, precipitation, and the resulting moisture content for different layers are shown below in Figure 3.
2. COLD REGION PAVEMENT BEHAVIOUR
11
Figure 3: Air temperature, precipitation and the moisture content of different layers for a pavement located near Svappavaara, northern Sweden (Erlingsson and Ullberg, 2018)
The temperature distribution in the cross-section of the structure depends on the environmental factors and the material properties of each layer such as thermal conductivity defined as the ability of the material to transfer heat by conduction, heat capacity defined as the required heat to increase one unit of material by 1°C, porosity, mineral content and frost susceptibility (Hermansson, 2000). The temperature variation within the pavement cross-section at selected times over approximately 3 months for a station located in southern Sweden is shown in Figure 4.
Figure 4: Trumpet diagram of pavement temperature variation over 3 months (Feb-May) for a station located in southern part of Sweden (Salour, 2015)
2. COLD REGION PAVEMENT BEHAVIOUR
12
The temperature variations are larger near the surface of the structure due to the proximity to the boundary conditions. The temperature variations decrease deeper in the structure until they become constant at a significantly large depth depending on the subsurface conditions roughly equal to the mean annual air temperature (Doré and Zubeck, 2009). The variations at the top and almost constant temperature at the bottom of the cross-section lead to a trumpet temperature profile. A system is considered to be in steady-state thermal balance when all the physical factors are considered and there are no immediate changes (Cengel, 2014). However, the steady-state is rarely reached as pavement structures are in constant interaction with their environment.
2.3. Frost penetration
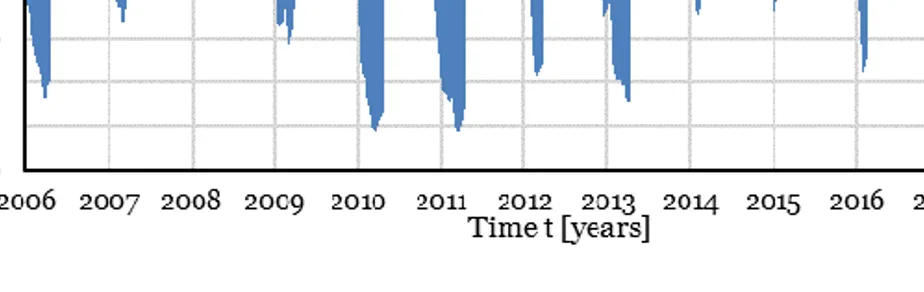
Frost is caused due to low temperatures continuing over a long period of time combined with the presence of moisture in the pavement layers. In cases of sustained low temperatures for extended periods of time, the frost may penetrate the entire pavement cross-section and reach the subgrade generating cryogenic suction which moves water towards the upper part of the structure. Three separate zones can be observed in a pavement structure subjected to freezing, namely the completely frozen area in the upper part of the structure, the partially frozen part in which ice and water are simultaneously located, and the unfrozen zone at the bottom of the structure (Hermansson and Guthrie, 2005). The depth of the frost penetration with time over multiple winter seasons is shown in Figure 5. The penetration of frost begins with the formation of ice lenses at small depths close to the surface where the freezing front is located. The freezing of the water located in the spaces between the aggregates causes expansion due to the phase change into ice and loosening of the existing layer material (Doré and Zubeck, 2009). Additionally, the frozen fringe is formed, which may be defined as a thin layer of a few millimetres thickness located between the freezing front and the ice lenses (Andersland and Ladanyi,
2. COLD REGION PAVEMENT BEHAVIOUR
13 2004). The frozen fringe enables the movement of water to the ice lenses within the partially frozen zone.
Figure 5: Interpolated frost penetration depth for a RWIS station located near Buskhyttan for the period 2006-2018
The movement of water within the partially frozen zone is limited as the formation of ice generates latent heat and lowers the hydraulic conductivity within the zone. In case there is no external source, the water movement is limited within the zone (Doré and Zubeck, 2009). With the further penetration of frost new ice lenses continue to form. If water is available between the old and new lenses, the old lenses continue to grow (Hoekstra, 1966; Jame and Norum, 1980). In case the negative temperatures continue over long periods of time, the frost continues to penetrate however with a slower penetration rate and with wider spacing between the lenses until nearly steady-state conditions are reached. The frost penetration continues as long as it is possible to further lower the temperature in the frozen fringe.
2.4. Seasonal variation of moisture
As in the case of temperature, the moisture content distribution in the cross-section of pavements is governed by boundary conditions, varies largely in the upper part of the structure, and tends to become approximately constant at sufficiently large depth (Erlingsson et al., 2002). During the construction stage, the compaction of unbound granular
2. COLD REGION PAVEMENT BEHAVIOUR
14
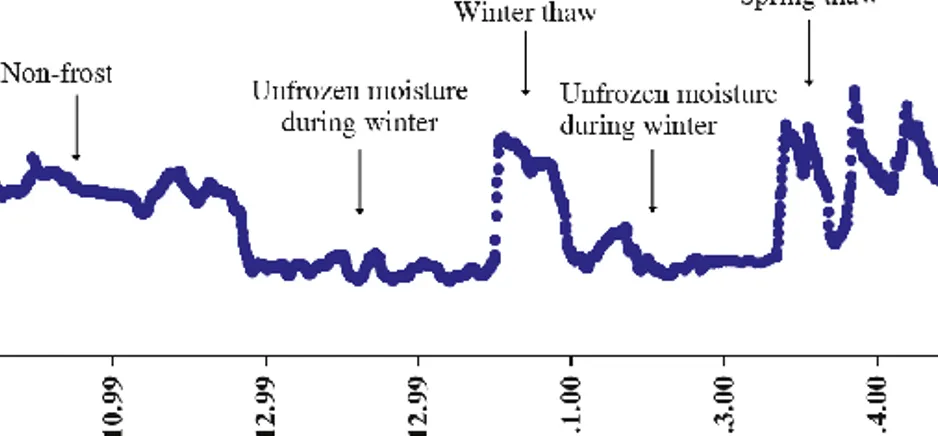
materials leads to a moisture content which is close to optimum which later changes approaching a natural state of equilibrium (Zapata et al., 2009). The main factors which are considered as moisture content input are the infiltration of precipitation water, lateral transfer of moisture, capillary rise, thawing of frozen material, while drainage and evaporation contribute to the extraction of moisture in the cross-section (Doré and Zubeck, 2009). The gravimetric moisture content registration at a specific depth of a pavement cross-section over an entire winter season and the following thawing period are shown in Figure 6.
Figure 6: Gravimetric moisture content registrations within unbound granular layers over 1 winter season (Erlingsson et al., 2009a)
For the non-asphaltic part of the pavement cross-section and the underlying subgrade, two separate zones are observed, the vadose zone located in the upper part of the cross-section and the saturated phreatic zone located below, as illustrated in Figure 7.
2. COLD REGION PAVEMENT BEHAVIOUR
15
Figure 7: The distribution of moisture in the pavement cross-section by zone and the relation to subsurface water (Erlingsson et al., 2009b)
Within the vadose zone, the moisture content depends on the type and properties of the material located in its upper part and increases with increasing depth getting closer to the saturation point. The capillary fringe, the intermediate vadose zone, and the surface water zone are the three sub-zones located within the vadose zone. Depending on the soil type and material porosity, water is drawn upwards within the capillary fringe by surface tension. Fine-grained soils exhibit a thicker capillary fringe compared to coarse-grained soils (Gillham, 1984). In the case of uncracked pavements, moisture content within the surface water sub-zone is approximately stable throughout the year except for the spring thaw period in which the moisture content increases significantly in a short period of time (Salour, 2015). At the boundary between the vadose zone and the saturated phreatic zone, the groundwater table (GWT) is located which is defined as the point at which the pores of the material are fully saturated (Das and Sobhan, 2013). In the unsaturated zone, the groundwater flow is directed approximately vertically, while in the saturated zone it is approximately horizontal (Charlier et al., 2009).
Surface water Intermediate Vadose Zone Capillary water Ground water V a d o s e Z o n e S a t. Z o n e Dry wet Water content E l e v a t i o n
17
3. In-situ flexible pavement monitoring
Monitoring the conditions of pavement structures by continuous data collection through built-in instrumentation could be used in pavement management systems (PMS). The data could be used for pavement response modelling, performance evaluation, and definition of required changes in case the performance criteria. Verification of newly developed mechanistic design approaches could be made by full-scale in-situ tests (Kolisoja et al., 2013), in which built-in instrumentation could be used. The information could aid in the decision-making processes related to road asset management plans and maintenance related decisions which could result in improvement of safety and extended service life for roads (FHWA, 2013).
3.1. Mechanical behaviour monitoring
A typical configuration of sensors for in-situ mechanical behaviour monitoring may consist of asphalt strain gauges (ASG), soil pressure cells (SPC), and strain measuring units (εMU) (Barriera et al., 2020; Selvaraj, 2012).
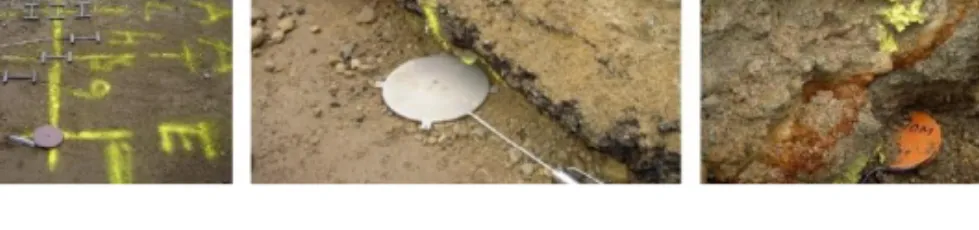
ASGs are commonly placed underneath the AC along the wheel path and perpendicular to it and are used to measure the longitudinal and transversal strains at the bottom of the layer. Typical ASGs during the installation stage are shown in Figure 8. They consist of 12cm long electrical resistance gauges placed within glass-fibre-reinforced epoxy with anchoring at each end, resulting in an H-shaped sensor.
3. IN-SITU FLEXIBLE PAVEMENT MONITORING
18
εMUs are used to measure the vertical strain in unbound granular layers. They consist of 2 coils placed together with a predefined spacing. Alternating magnetic flux is generated when the current passes through the first coil. The second coil generates a current proportional to the magnetic flux at its position. The signal can be converted to the distance between the first and second coil which can be used to calculate strains when loading is applied. A typical εMU manufactured in-house at VTI is shown in Figure 8.
Figure 8: Mechanical behaviour monitoring instrumentation ASG (left), SPC (middle), εMU (right) (Erlingsson and Carlsson, 2018)
For the measurement of vertical stresses in unbound granular layers, SPCs are used. The cell consists of 2 steel plates with a radius of 11 cm welded to each other at the edges and the spacing filled with liquid. The pressure applied to the fluid between the plates is measured by an electrical transducer mounted in the outer part of the cell and connected to the inner liquid by a steel tube. The applied vertical pressure due to loading is then calculated based on the measured pressure inside the liquid. A typical SPC placed inside the cross-section of a test section during the installation phase is shown in Figure 8. A typical configuration of mechanical behaviour monitoring sensors placed inside a pavement cross-section is shown in Figure 9.
3. IN-SITU FLEXIBLE PAVEMENT MONITORING
19
Figure 9: Distribution of mechanical behaviour monitoring sensors within a pavement structure's cross-section (Erlingsson and Ullberg, 2018)
3.2. Temperature distribution monitoring
Various types of temperature sensors and different configurations can be used to monitor the variation of temperature with time in pavement structures in-situ. The recorded values may aid the transportation authorities of different countries in the decision-making processes related to both maintenances of existing pavements and the construction of new ones.
The Swedish Transport Administration regularly monitors the temperature distribution and frost penetration in Swedish roads. The monitoring system for the temperature variation in the granular layers consists of frost roads called VTI Tjälstav 2004 consisting of temperature sensors placed every 5 cm along a 2-meters placed in various pavements in the Swedish road network. The temperature is measured and recorded every 30 minutes by each sensor. The configuration makes it possible to evaluate the temperature variation with time at a specific depth where an individual sensor is located as well as the variation of temperature with
Emu - Vertical strain
ASG – Horizontal tensile strain SPC – Vertical stress 0.0 Depth [cm] Binder Course Road Base Subbase 2.0 8.0 30.0 60.0 Wearing Course
Unbound Base Course
Subbase
Natural sandy gravel (Old existing road) 20.0
3. IN-SITU FLEXIBLE PAVEMENT MONITORING
20
depth at a specific time. Based on the temperature data, the frost penetration depth can be calculated by interpolation assuming that the location of the frozen layer is at the same depth as the 0°C isotherm. For the monitoring of the temperature variation in asphalt concrete, individual thermocouples embedded within the layer may be used.
3.3. Moisture distribution monitoring
Data collected when monitoring the variation of moisture distribution may be used to assist with the design of pavement maintenance strategies, modelling the moisture and contaminant distribution throughout the cross-section, and to predict the variation of stiffness in unbound granular layers. To monitor the moisture distribution in-situ for unbound granular layers, time-domain reflectometer (TDR) probes, ground-penetrating radar (GPR), and capacitance measurement techniques are typically used. TDR uses electromagnetic technology to measure the dielectric constant of porous materials (Erlingsson et al., 2009b; Topp et al., 1980). The dielectric number of a multiphase material depends on the dielectric number of its constituents. Unbound granular materials and soil are multiphase materials composed of water, air, and solids, and the dielectric constant of water is significantly larger than the dielectric constant of solids and air (Erlingsson et al., 2009b; Fredlund and Rahardjo, 1993), thereby making the conversion from dielectric number to volumetric moisture content possible. The installation of 20 cm long TDR probes mounted on a 200 cm long rod with a centre to centre spacing of 35.5 cm is shown in Figure 10.
Figure 10: In-situ installation of 20 cm long TDR probes mounted on a 200 cm moisture rod (Erlingsson and Carlsson, 2014)
3. IN-SITU FLEXIBLE PAVEMENT MONITORING
21 A TDR probe typically consists of a wave transmitter that generates waves of up to 1 GHz frequency and multiple metallic rods of length L which act as waveguides. An electromagnetic field surrounding the probe is generated due to the pulse transmission, and the pulse is reflected back to the source. It is therefore possible to calculate the pulse transit time t and
the dielectric constant κr by rearranging the expression below.
where ce is the electromagnetic pulse velocity, L is the length of a rod of the
metallic probe, t is the time of transit, c0 is the velocity of light, μr is the
relative magnetic permeability, and κr is the dielectric constant.
After calculating the dielectric constant, the conversion into volumetric moisture content is typically done using existing third order polynomial empirical equations (Jiang and Tayabji, 1999; Topp et al., 1980). The monitoring of moisture content of soils and granular materials using TDR probes is possible only for unfrozen soils. The technique may be also used to monitor the thawing of the structure which should correspond to sudden increases of the moisture content at the specific depth in which a TDR probe is located. . 𝑐𝑒= 2𝐿 𝑡 = 𝑐0 √𝜅𝑟· 𝜇𝑟 (7)
23
4. Modelling and validation of pavement
behaviour
Several methods exist for the modelling of the mechanical behaviour of pavement structures, with the most popular methods being Odemark’s method of equivalent thickness (Ullidtz, 1987), multilayer elastic theory (MLET) (Burmister, 1945), and finite element method (FEM) (Cho et al., 1996). Among the abovementioned methods, FEM currently offers the highest accuracy and the ability to model complex cases, however, MLET is the most popular method of choice due to its fast computation times (ARA Inc., 2004; Loulizi et al., 2006).
4.1. Mechanical modelling and validation
When using MLET-based software several inputs such as material
properties including the layer stiffness E, Poisson’s ratio ν, layer
dimensions z, and loading specifications such as load magnitude q and
contact area are required to calculate stresses, strains, and deformations throughout any point in the structure (Burmister, 1945; Maina and Matsui, 2005). Multiple initial assumptions should be considered when using MLET.
Pavement layers are assumed to be homogenous and isotropic exhibiting the same behaviour in all directions and homogenous extending infinitely in the horizontal direction and downwards, which are simplifications of the real-life conditions. Limitations also apply in the
4. MODELLING AND VALIDATION OF PAVEMENT BEHAVIOUR
24
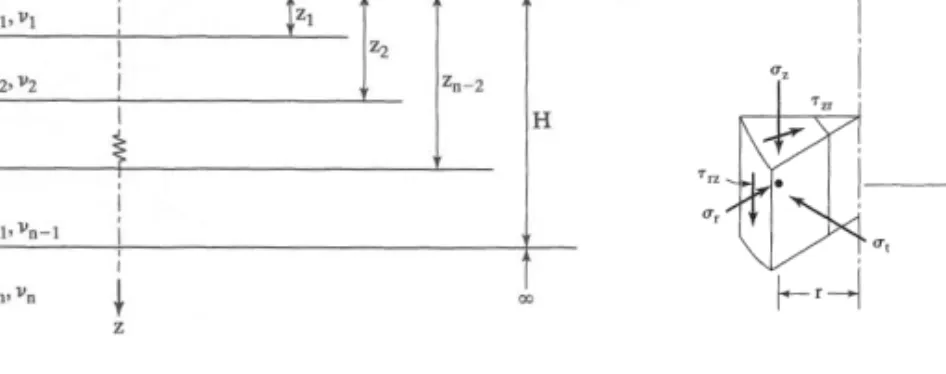
definition of the applied loading as it is assumed that it applies constant pressure and has a circular contact area. A schematic illustration of a multilayer system subjected to a circular load, and the resulting stresses on an axisymmetric element are shown in Figure 11.
Figure 11: Schematic illustration of a multilayer system subjected to a circular load and the state of stresses on a structural element subjected to loading (Huang, 2004)
The governing differential equation for the axisymmetric solution of a multilayer system with a circular load applied can be written by using the
Laplace operator ∇4 and a stress function φ as follows (Timoshenko and
Goodier, 1951):
In an axisymmetric coordinate system, the Laplace operator ∇4 may be
rewritten as:
The stress function for each layer is given as (Huang, 2004):
𝛻4𝜑 = 0 (8) 𝛻4= (𝜕 2 𝜕𝑟2+ 1 𝑟 𝜕 𝜕𝑟+ 𝜕2 𝜕𝑧2) ( 𝜕2 𝜕𝑟2+ 1 𝑟 𝜕 𝜕𝑟+ 𝜕 𝜕𝑧2) (9)
4. MODELLING AND VALIDATION OF PAVEMENT BEHAVIOUR
25
where λ=z/H, λi=zi/H, ρ=r/H, J0 is the 1st kind order 0 Bessel function, m
is the Hankel parameter (Erlingsson and Ahmed, 2013; Van Cauwelaert,
2003), and A, B, C, and D are integration constants to be determined by
boundary and continuity conditions.
The stresses and strains may be obtained by solving the following system of equations (Maina and Matsui, 2005):
where E is the layer stiffness, ν is the Poisson’s ratio, σ is the normal stress,
τ is the shear stress, w is the vertical displacement, and u the radial
displacement.
In terms of accuracy, the differences in calculated pavement response between MLET and FEM based software are negligible for many road engineering response calculations (Saevarsdottir and Erlingsson, 2015).
4.1.1. Loading by falling weight deflectometer
In-situ evaluation of the load-bearing capacity of pavements by means of non-destructive methods is a standard practice in the management and maintenance of roads. Falling weight deflectometer (FWD) measurements are a typical non-destructive test method in which a controlled loading is applied and the deflection at 7 different locations along the surface of the pavement is measured by geophones (Lytton, 1989). FWD equipment
𝜑𝑖= 𝐻3𝐽 0(𝑚𝜌) 𝑚2 (𝐴𝑖𝑒−𝑚(𝜆𝑖−𝜆)− 𝐵𝑖𝑒−𝑚(𝜆−𝜆𝑖−1) + 𝐶𝑖𝑚𝜆𝑒−𝑚(𝜆𝑖−𝜆) − 𝐷𝑖𝑚𝜆𝑒−𝑚(𝜆−𝜆𝑖−1)) (10) [ 𝜎𝑧 𝜎𝑟 𝜎𝑡 𝜏𝑟𝑧 𝑤 𝑢 ] = [ (2 − 𝜈)𝜕 𝜕𝑧 𝜈𝜕 𝜕𝑧 𝜈𝜕 𝜕𝑧 (1 − 𝜈)𝜕 𝜕𝑟 1 + 𝜈 𝐸 (1 − 2𝜈) 0 − 𝜕 3 𝜕𝑧3 − 𝜕 𝜕𝑧 𝜕2 𝜕𝑟2 −𝜕 𝜕𝑧 1 𝑟 𝜕 𝜕𝑟 − 𝜕 𝜕𝑟 𝜕2 𝜕𝑧2 1 + 𝜈 𝐸 ( 𝜕2 𝜕𝑟2+ 1 𝑟 𝜕 𝜕𝑟) −1 + 𝜈 𝐸 ( 𝜕2 𝜕𝑟𝜕𝑧) ] [𝛻 2 𝜑 𝜑 ] (11)
4. MODELLING AND VALIDATION OF PAVEMENT BEHAVIOUR
26
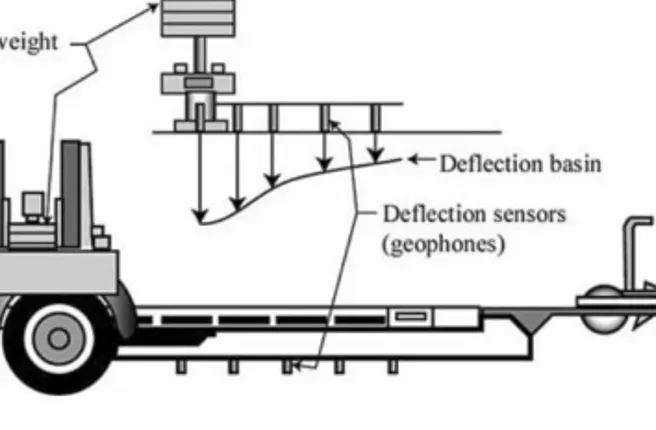
typically consists of the loading system which controls the load application on top of a rubber buffer attached to a loading plate and the measurement system consisting of the deflection sensors and the data logging system. A schematic illustration of a typical falling weight deflectometer and its components is shown below in Figure 12.
Figure 12: Schematic illustration of the components of a falling weight deflectometer (Doré and Zubeck, 2009)
A haversine-shaped loading with a duration of approximately 0.03 seconds is applied in such a way that the magnitude and duration resemble the loading by a single heavy wheel as closely as possible. After the loading is applied, the deflection bowl can be obtained based on the deflection values recorded by the geophones one of them located directly under the load application and 6 of them at continuously increasing distances along the same direction.
The deflection bowl values obtained from the FWD geophones may be used for calculating deflection basin indices which provide general estimations of various structural characteristics of the structure (Doré and Zubeck, 2009). The deflections recorded by the geophones closer to the load application plate are assumed to represent the material properties of the layers and geophones located furthest to the load, the properties of the subgrade. Based on the deflection bowl shape and calculated indices it is possible to roughly estimate the structural state of pavements located in cold regions subjected to freeze-thaw cycles. When the structure is completely frozen, small deflections are recorded from geophones which
4. MODELLING AND VALIDATION OF PAVEMENT BEHAVIOUR
27 lead to a narrow deflection bowl that continually widens with increasing deflections during the thawing of the structure increasing a maximum during the spring thaw period in which the structure is nearly at its maximum moisture saturation (Simonsen and Isacsson, 1999).
Based on the deflection data obtained from FWD it is possible to backcalculate the stiffness modulus of each layer of pavement structures (Irwin, 2002; Lytton, 1989). Initial stiffness values are assumed based on catalogue values and the surface deflection at the location of geophones is calculated using MLET or FEM. The error is calculated based on the difference between the calculated and the measured surface deflections. A new set of parameters is assumed at each step of the iteration until convergence is reached and representative layer stiffness values have been backcalculated.
The selection of the initial layer stiffness assumptions is crucial as multiple layer stiffness combinations may produce the same deflection bowl as the measured one, therefore engineering judgment is further needed. Furthermore, in the case of pavements located in cold regions subjected to large variations of temperature, moisture, and freeze-thaw cycles, the stiffness value assumptions should be adjusted accordingly.
4.1.2. Loading by heavy vehicles
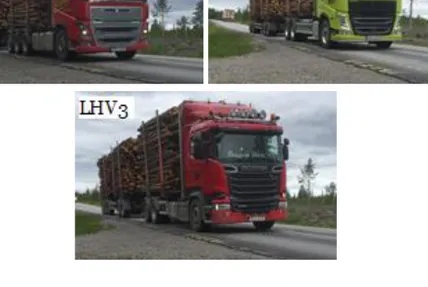
In the case of instrumented road sections, the MLET-modelled response of the structure may be validated by using the response data recorded by the built-in sensors. The application of loading by a test vehicle has to be controlled in terms of positioning and velocity as slight deviations produce inconsistent results. Three different types of long heavy vehicles passing on top of the sensors of an instrumented section are shown in Figure 13. The first vehicle shown in Figure 13, labelled LHV1 has a gross vehicle weight of approximately 74 ton, 9 axles, and a centre to centre (c/c) length of 20.50m. The gross vehicle weight of LHV2 is approximately 64 tons distributed on 6 axles over a c/c length of 19.74m. LHV3 weighs approximately 68 ton distributed on 8 axles over a c/c length of 20.80m.
4. MODELLING AND VALIDATION OF PAVEMENT BEHAVIOUR
28
Figure 13: Long heavy vehicles (LHVs) passing on top of the sensors of an instrumented test section in road 515 near Långträsk
A similar backcalculation procedure as in the case of FWD can be implemented to estimate the layer stiffnesses. Furthermore, it is also possible to validate the stiffness values backcalculated by FWD by using those stiffness values into MLET simulations and then comparing the calculated response values to the ones measured by the built-in instrumentation. The validation is completed when a decent agreement between the registrations and the modelled values is reached as shown in Figure 14.
Figure 14: Structural response registrations under LHV loading and the comparison to MLET modelled values a) longitudinal strain, and b) vertical stress.
-400 -300 -200 -100 0 100 -0.5 0.0 0.5 1.0 1.5 L o n g it u d in al st ra in εxx [-] Time t [s] a) MLET Measured -40 -20 0 20 40 60 80 100 120 -0.5 0.0 0.5 1.0 1.5 V er ti ca l st re ss σzz [k P a] Time t [s] b) MLET Measured
4. MODELLING AND VALIDATION OF PAVEMENT BEHAVIOUR
29
4.2. Stiffness changes due to seasonal variations
It is widely recognized in pavement engineering that the combination of traffic loading with the decrease of bearing capacity due to environmental factors such temperature, moisture, and freeze-thaw cycles, may lead to rapid deterioration and service life reduction (ARA Inc., 2004; Yoder and Witczak, 1991). Considerable stiffness variations are observed for pavements located in cold regions with an increase in stiffness during the winter period and a rapid stiffness decrease during the following spring thaw (Simonsen and Isacsson, 1999). The stiffness increase during the winter season is attributed to the low temperatures to which the asphalt concrete layer is subjected and the partial freezing of the inter-granular moisture in the unbound granular material which forms a stiff matrix (Simonsen et al., 2002).
Several models that aim to predict the resulting stiffness modulus of the unbound granular layers based on the moisture content are available. Most moisture content – stiffness modulus models were developed under laboratory testing since full-scale testing is time-consuming, not cost-effective, and significant testing is required to calibrate a model. The one-dimensional model implemented in the Mechanistic Empirical Pavement Design Guide (MEPDG) may be used for the estimation of the stiffness modulus of unbound granular layers of a pavement structure.
where Mr is the stiffness modulus predicted by the model, Mr,opt is optimal
stiffness modulus at reference conditions, S is the saturation degree, Sopt is
the optimal degree of saturation at reference conditions, a, b, and ks are
regression parameters, and β=-ln(-b/a).
The model has been calibrated by using triaxial tests performed on laboratory conditions on unbound granular materials (Andrei, 2004) and is applicable for both fine-grained and coarse-grained materials under non-frozen conditions. 𝑙𝑜𝑔 𝑀𝑟 𝑀𝑟,𝑜𝑝𝑡 = 𝑎 + 𝑏 − 𝑎 1 + exp (𝛽 + 𝑘𝑠(𝑆 − 𝑆𝑜𝑝𝑡)) (12)
4. MODELLING AND VALIDATION OF PAVEMENT BEHAVIOUR
30
The stiffness of the asphalt concrete layer may be approximately predicted based on the temperature to which the material is subjected by the empirical correlation given in Equation 13.
where ET is the asphalt stiffness predicted by the correlation, ET,refis the
6500MPa asphalt stiffness at the reference temperature, T is the target
temperature, Trefis the reference temperature of 10°C, and b is a constant
of regression equal to 0.065.
4.3. Model fitting
An iterative procedure is typically implemented for the calibration of the parameters for a used model and for the FWD backcalculation. For each model parameter, upper and lower boundaries are typically set based on values found in literature and judgement for each specific evaluation case. During each step of the iteration, the error defined as the difference between the values obtained by the model and the measured values needs to be evaluated. The Root Mean Square Error (RMSE) may be used to quantify the error.
where yp is a single datapoint predicted by the model, ym is the
corresponding datapoint for the measured value and n the total number of
data points.
The RMSE value is calculated at each step of the iteration. A new set of parameters is assumed at the next iteration step. The iteration is stopped when a minimum value of the RMSE is reached. Commercially available software such as Microsoft Excel or programming iterative algorithms may be used to iterate the values.
𝐸𝑇 = 𝐸𝑇,𝑟𝑒𝑓⋅ 𝑒−𝑏(𝑇−𝑇𝑟𝑒𝑓) (13) 𝑅𝑀𝑆𝐸 = √∑(𝑦𝑝− 𝑦𝑚) 2 𝑛 𝑛 𝑖=1 (14)
4. MODELLING AND VALIDATION OF PAVEMENT BEHAVIOUR
31 A potential drawback of the RMSE minimization iterative method is that the iteration may converge at a local minimum which may not necessarily be the global minimum. This occurs sometimes for models consisting of multiple parameters in which multiple combinations may produce a good fit, however, this may be avoided by selecting reasonable initial assumptions.
To evaluate the quality of fit of a model, the coefficient of determination
R2 is commonly used.
where ym is a measured data point, yp is the corresponding data point
calculated by the model and n the total number of data points.
An R2 value of 1 indicates a perfect fit of the model, and the R2 value
range which indicates an acceptable fit depends on the area of research.
𝑅2= 1 − ∑ (𝑦𝑚− 𝑦𝑝) 2 𝑖 ∑ [𝑦𝑚− ( 1 𝑛∑𝑛𝑖=1𝑦𝑚)] 𝑖 (15)
33
5. Summary of the papers
Three papers that primarily investigate the effects of environmental variables and loading on the structural response of pavement structures are appended at the end of this licentiate thesis. The papers are briefly summarized below in the following sub-sections.
5.1. Paper 1:
The determination of the frost penetration depths is a basic input requirement for the dimensioning of the frost protection layer and the estimations of the required drainage for pavement structures. The frost penetration depth in Sweden is typically computed by thermal simulations using finite difference-based software which is time-consuming and requires a large number of inputs. The aim of this paper was to statistically correlate the air temperature to the frost penetration depth for Swedish country-specific conditions.
Air temperature data from 44 meteorological stations over a 10-year time span from 2007 to 2017 was obtained from the Swedish Meteorological and Hydrological Institute (SMHI). The time between each temperature registration was 30 minutes. The air temperature data were used to calculate the freezing index (FI), which is a commonly used indicator for the severity of a winter season and is calculated by summing the mean daily average temperature (MDAT) of the days with negative average temperature (Doré and Zubeck, 2009).
5. SUMMARY OF THE PAPERS
34
where FI is the calculated freezing index, t the time in days, T the
temperature in degrees Celcius, and MDAT the mean daily average
temperature.
In addition to the mathematical method, it is possible to estimate the FI graphically by calculating the difference between the maximum and minimum points in the cumulative freezing index versus the time graph. The daily temperature variations and the freezing index for the 2010-2011 winter season for a meteorological station near Uppsala are shown in Figure 15.
Figure 15: Temperature registrations and calculated freezing index for meteorological station 326 located near Uppsala for winter 2010-2011 (Erlingsson and Saliko, 2020)
Pavement temperature registrations were obtained from the Swedish Transport Administration (Trafikverket) for the 10-year timespan from 2007 to 2017. The data was recorded by VTI Tjälstav frost rods at 49 separate Road Weather Information System (RWIS) stations with a logging interval of 30 minutes. The frost penetration was obtained from this data by interpolating to find the depth of the 0°C isotherm located between 2 temperature sensors one recording a negative value and the other recording a positive value. Typical registrations from three different RWIS stations, Putsered located in southern Sweden, Kindsjön located in
-500 -400 -300 -200 -100 0 100 200 300 -30 -25 -20 -15 -10-5 0 5 10 15 2025 Cu mmu lat iv e Fr ee zin g In de x FI [° C·days ] T em pe ra ture T [ °C] Time t [days]
Average Temperature Freezing Index
𝐹𝐼 = ∫ −𝑇𝑑𝑡 = ∑ 𝑀𝐷𝐴𝑇 𝑖𝑓 𝑀𝐷𝐴𝑇 ≤ 0 𝑡 0 𝑡 0 (16) FI
5. SUMMARY OF THE PAPERS
35 central Sweden and Svappavaara located in northern Sweden are shown in Figure 16.
Figure 16: Pavement cross-sectional temperature registrations for 3 different stations in Sweden for a winter season 1 October – 31 May (Erlingsson and Saliko, 2020)
From the RWIS stations located in the southern part of Sweden, multiple intermittent freeze-thawing cycles were observed which may lead to premature failure of pavements located in this region in case of insufficient drainage. In the central part of the country, a single freezing front was observed, and it was possible to record the beginning and completion of thawing. Spring thaw is the main weakening period for pavements located in this region. The lowest temperatures and the largest frost penetration depths were recorded for pavements located in the north of Sweden. In multiple cases, it was not possible to capture the frost penetration depth as it exceeded the 2m length of the VTI Tjälstav frost rods.
The meteorological stations and RWIS stations were selected based on their geographical vicinity. The average distance between them was 6 kilometres. The maximum frost penetration and air freezing index value for a meteorological and RWIS station couple located in proximity to each other was calculated for each winter season from 2007 to 2017. The results were classified based on the climatic zone in which they were located according to the Swedish manual of technical requirements for road constructions (Trafikverket, 2011) which consist of 5 zones, with zone 1 located in the southern part of the country under relatively mild winter climatic conditions and zone 5 located in the north under harsher, colder climatic conditions.
The frost penetration depth was plotted against the calculated air freezing index for 44 RWIS and meteorological station over a 10-year