JOURNAL OF
ENVIRONMENTAL HYDROLOGY
The Electronic Journal of the International Association for Environmental Hydrology
On the World Wide Web at http://www.hydroweb.com
VOLUME 21
2013
Mosul Dam is one of the biggest hydraulic structures in Iraq. It was constructed in 1986 on the Tigris River in the north of Iraq for multiple purposes: irrigation, flood control and power generation. The initial storage capacity and water surface area of its reservoir reached 11.11 km3 and 380 km2 respectively at the maximum operation level 330 m a.s.l. The dam was operational in 1986. Blockage of the intakes of the pump station for North Al-Jazira Irrigation Project in the Mosul Dam reservoir has highlighted the importance of sedimentation problems within the reservoir. A total of 56 samples were collected from the bottom of Mosul reservoir covering most of the reservoir area. The results of the analysis of these samples revealed that they were composed of gravel (3.8%), sand (15%), silt (55.5%) and clay (25.7%). The distribution of these sediments indicates that the silt portion represents the highest or 77% of the bottom sediments of this reservoir followed by clay (13.5%) and then sand (9.5%). However, sand percentages are the highest in the northern zone of the reservoir where the River Tigris enters the reservoir and decrease gradually toward the dam site. In the meantime, silt percentage decreases toward the dam site while the finer fraction (i.e. clay) increases. Statistically, the average median and mean sizes of the sediments are 2.81 phi (0.142 mm) and 6.1 phi (0.0146 mm) respectively. In addition, the sediments are poorly sorted, nearly symmetrical in skewness and leptokurtic, very leptokurtic, to mesocratic. Finally, it is believed that the geometry and hydrodynamics of the Mosul reservoir, the location of the River Tigris entrance together with the side tributary valleys have played the most important role in the sediments distribution and their characteristics.
SEDIMENTATION IN THE MOSUL RESERVOIR
OF NORTHERN IRAQ
1,2,4Lulea University of Technology, Sweden
3Ministry of Higher Education and Scientific
Research, KRG, Erbil, Iraq
Nadhir Al-Ansari1
Issa E. Issa2
Govand Sherwani3
INTRODUCTION
Dams are usually constructed for water resources management purposes. They might be of multipurpose functions like flood prevention, irrigation and/or power generation, etc. In all cases once the dam is constructed the sediment transport capacity of the streams is reduced upon entering the reservoir due to the decrease of flow velocity and the increase flow cross sectional area. Most of the sediments are usually deposited in the reservoir headwater area except the fine grained particles that are expected to be farther transported and deposited within the vicinity of the dam. The sedimentation rate depends on the amount of sediment transported by the stream, sediment production in the catchment area and the mode of deposition (Julien, 2010). On the other hand, reservoir sedimentation depends on the geometry and operational procedure of the reservoir, river regime and its flood frequencies, sediment consolidation, flocculation, and density currents as well as possible changes in land use (Julien, 2010).
When dams are constructed on rivers, they dramatically alter the balance of sediment inflow and outflow (Morris and Fan, 1998). This change will affect the function of the reservoir (Strand and Pemberton, 1982). As a result, there will be upstream and downstream consequences (Childs, 2010). The Upstream effect is due to the trapping of sediment as a result of the dramatic decrease in the flow velocity (Brierley and Fryiers, 2005). More than 90% of the sediments are usually trapped within the reservoir (Graf, 2005, Vericat and Batella, 2005). Downstream impact involves the change in the water discharge which depends on the size and purpose of the dam. The changes may be substantial on the river downstream the dam (Brandt, 2000 and McCartney, 2009) because the timing, magnitude and frequency of high and low flows are changing. Most of the sediments will be trapped within the reservoir and only fine particles are released downstream (Brandt, 2000, Brierley and Fryiers, 2005). Furthermore, the river will try to adjust its channel to maintain a quasi-equilibrium regime (Leopold and Maddock, 1953, Leopold et al., 1964, Petts, 1980). Grant et al. (2003) stated that if the transport capacity exceeds the sediment supply, then the river will erode sediments from its bed and/or banks and in the reverse case, the river will accumulate sediment. The river cross section and slope will change according to the status of the sediment transport (Schumm, 2005, Gorden and Meentemeyer, 2006, Charlton, 2008).
In this research, a total number of 56 sediment samples were collected from the bed of Mosul reservoir to study their nature and distribution. This study intends to characterize the sediments deposited within the dam reservoir vicinity in terms of their size, statistical parameters and their distribution within the reservoir.
THE MOSUL RESERVOIR
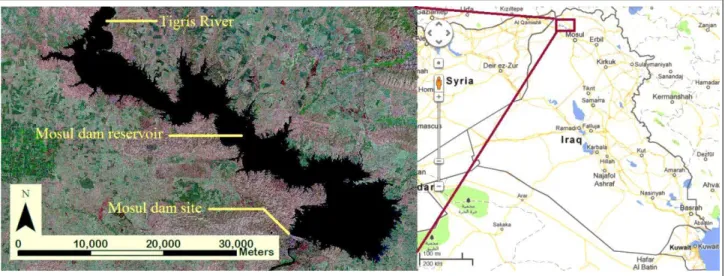
The Mosul reservoir is located between latitude (4055000 to 4086000) m Northing and longitude (275000 to 320000) m Easting (Figure 1). The length of the reservoir is about 45 km and its width ranges between 2 and 14 km at the maximum operation level of 330 m a.s.l. The
greatest water surface area of the reservoir is calculated to be 380 km2 at the maximum operation
level of 330 m a.s.l. The storage capacity of the reservoir reaches 11.11 km3 of which 2.95 km3
are dead storage (Iraqi Ministry of Water Resources 2011). The catchment area of the River Tigris
estimated above the Mosul dam is about 54900 km2 shared by Turkey, Syria and Iraq (Saleh, 2010).
The main inflow entering the reservoir is from the River Tigris. In addition, there are seven tributary valleys that feed the reservoir from the left (northeast) side three from the right (southwest) side of the reservoir (Ezz-Aldeen et al., 2012b). Some properties of these valleys are summarized in Table 1. The soils of the valleys are mostly silty loam, silty clay, loam and clay (Ezz-Aldeen et al., 2012a).
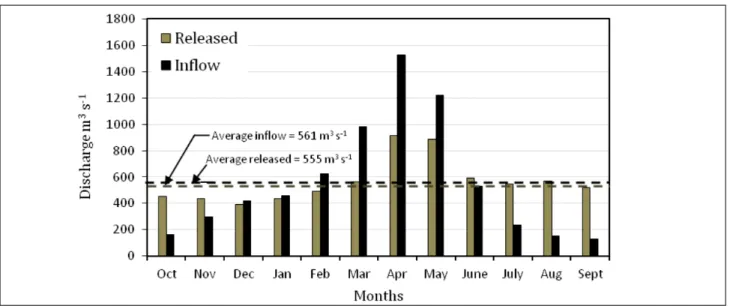
Mosul dam operates to provide storage for three irrigation projects, power generation, regulation and flood control for the Tigris River and also for recreation. Dam operation started during June, 1984 with the initial reservoir filling during the spring of 1985 but the actual operation began in July, 1986 (Iraqi Ministry of Water Resources, 2011). Using the data available from the Iraqi Ministry of Water Resources the average annual inflows and outflows of the reservoir were
561 and 555 m3.sec-1 respectively. The operation mode of the dam during 1986-2011 is shown in
Figure 2.
DATA COLLECTION AND METHODOLOGY
Fifty six sediment samples were collected from the bottom of the Mosul reservoir using a Van Veen grab. The work was conducted in May 2011, twenty six years after the initial impounding, using a boat equipped with “Real-Time Kinematic Global Positioning System (RTK-GPS)” and an echo sounder Sea Charter 480DF to define the absolute x,y,z coordinates of the reservoir bottom during sampling. The locations of the samples, which were collected across the entire bottom of Figure 1. Iraq map showing the location of Mosul Dam.
Table 1. Some properties of the main tributary valleys surrounding the Mosul Reservoir from both eastern and western sides.
Valley name Side feeding Area km2 Slope Length km Mean basin level m a.s.l
Sweedy Right 450.76 0.0359 38.8 446.62
Kara Kandy Right 78.52 0.0217 21.82 388.38
Khuyr Hara Right 50.06 0.0525 10.86 404.89
Amlik Left 88.95 0.0281 38.94 470.42
Jardyam Left 88.73 0.0215 52.68 457.1
Affkery Left 139.5 0.0214 58.04 445.34
Khrab Malk Left 119.6 0.0255 51.32 475.87
Naqeb Left 104.1 0.0143 54.71 426.52
Kalaq Left 162.26 0.0173 60.52 424
the reservoir, were projected on the satellite image using Arc/GIS software (Figure 3). To determine the size distribution of the sediment, all the samples were sieved at Mosul University labs. The fine fraction (silt and clay) was subjected to hydrometer analyses at the same labs.
RESULTS INTERPRETATION AND DISCUSSION
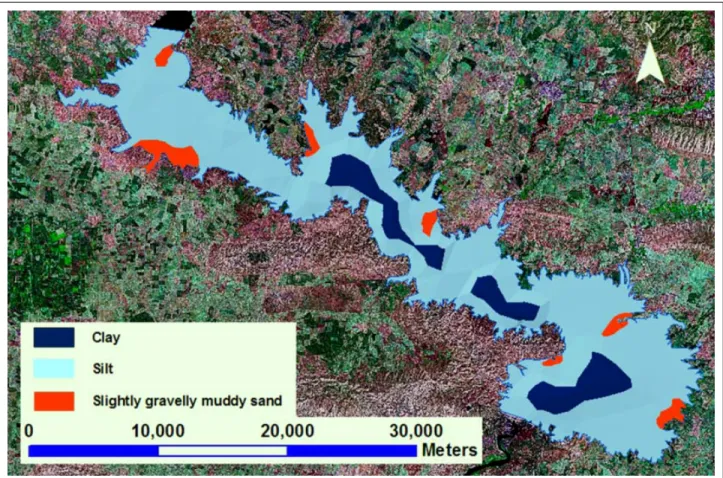
Over all the grain size analyses of the bed samples from the Mosul reservoir indicate that the sediments comprised Gravel: Sand: Silt: Clay in the ratios 3.8:15:55.5:25.7 respectively. The silt portion occupies 77% of the surface area of the bottom of the reservoir followed by clay 13.5% Figure 2. Monthly mean inflow and outflow of the Mosul Reservoir for 1986-2011.
and sand with gravel 9.5% (Figure 4). The sand dominated areas are confined near the shores of the reservoir while the clay occupies the deepest parts of the basin.
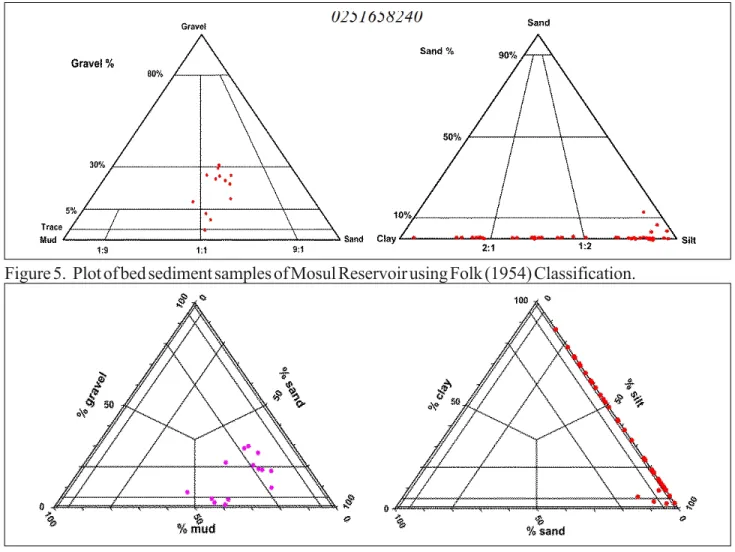
From textural perspective using Folk’s (1954) classification, the sediments are mainly dominated by silt reaching 42.86%, which are followed by mudstone 19.64%, and clay 10.7% on the gravel: sand: mud triangle while on the sand: silt: clay triangle gravelly muddy sand is the dominant 16.1%, followed by slightly gravelly muddy sand 5.36% and 5.34% divided between gravelly mud, slightly gravelly sandy mud and sandy silt (Figure 5). Different results were obtained when Blott and Pye (2012) classification was employed where the main dominant samples were very slightly gravelly muddy sand 7.1% followed by slightly gravelly slightly muddy sand 3.6% on the gravel: sand: mud triangle and slightly clayey silt 30.4% followed by silty clay 21.4% and clayey silt 12.5% (Figure 6). Al-Taiee (2005) reported that sediment at the bottom of the reservoir were 70% silt loam, 11% silt, 11% silt clay loam and 8% loam. This is due to the fact that he used soil classification for agricultural purposes.
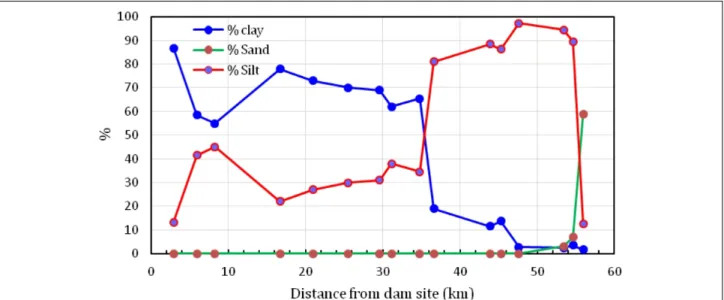
Gravels and sand are confined in patches near the entrance of tributary valleys on both eastern and western sides of the reservoir together with the entrance of River Tigris from north (Figure 7). On the other hand, silt and clay cover most of the surface area of the reservoir bottom. The latter sediment sizes always occupy the relatively deep parts of the reservoir (Figure 7). In addition, the longitudinal distribution of the sediments also confirms this pattern (Figure 8). In Figure (8), it is quite evident that the sand percentages are higher in the northern zone of the reservoir where the River Tigris enters the reservoir and decreases gradually southward. Silt percentages decrease toward the dam site in the south while the clay fraction increases in the same direction. This is a very common pattern (Petts, 1984, Morris and Fan, 1998, Garde and Ranga Raju, 2000, Al-Ansari,
Figure 5. Plot of bed sediment samples of Mosul Reservoir using Folk (1954) Classification.
Figure 6. Plot of bed sediment samples of Mosul Reservoir using Blott and Pye (2012) Classification.
and Knutsson, 2012) when a reservoir has one main feeder like the Tigris River in our study case, because the velocity of water entering the reservoirs drops tremendously and suddenly causing the deposition of coarser fractions near the feeder entrance.
The statistical parameters of the studied sediment were calculated according to Folk’s (1974) methodology. The results showed that the average median and mean sizes of the sediment are 2.81 phi (0.142 mm) and 6.1 phi (0.0146 mm), respectively. The distribution of the size fractions of the bottom sediments (Figure 9) showed that the size of the particles decreases from the shores toward the deeper parts of the reservoir. This is due to the fact that coarser particles are firstly deposited followed by smaller particles when sediments influxes enter the reservoir through valleys.
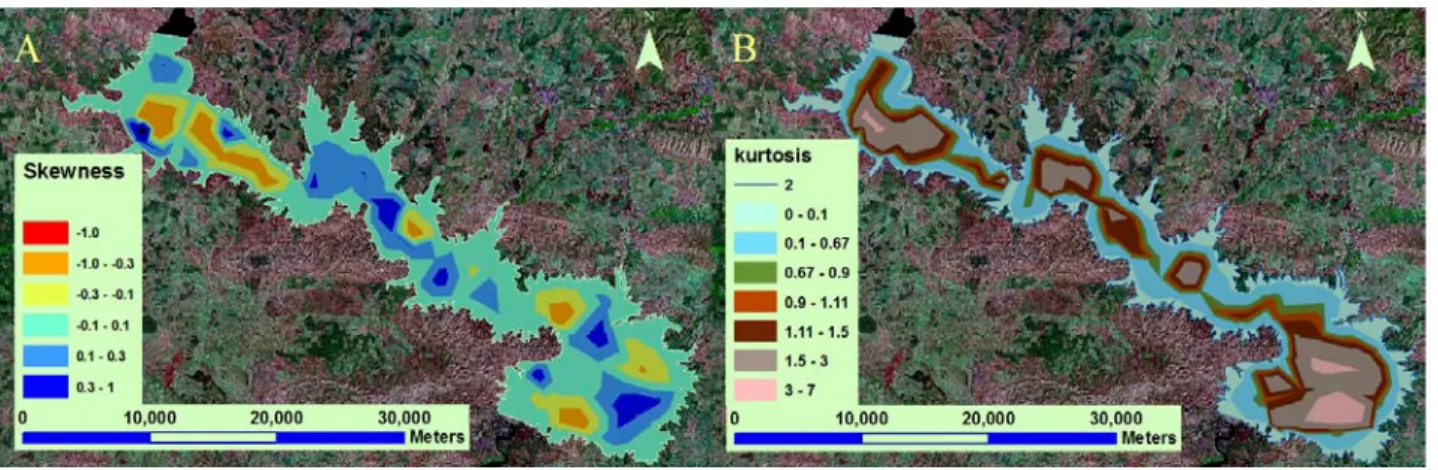
Generally the studied samples showed that these sediments are poorly sorted (average value 1.615). However, the sorting improves relatively within the vicinity of the shorelines of the reservoir and then it becomes poorer toward the central parts (Figure 10). In the northern zone of the reservoir most of the sediments are very poorly sorted. While in the middle zone of the reservoir the most samples are poorly sorted and become moderately sorted towards the southern zone of the reservoir. This fluctuation in sorting is believed to be due to the wave action on the shores, which diminishes towards center of the reservoir. Furthermore, the average skewness Figure 8. Longitudinal distribution of sand, silt and clay fractions in the bottom sediments across the Mosul Reservoir.
values 0.02 indicate that these sediments are nearly symmetrical. The distribution of the skewness (Figure 11A) shows that within the deep parts of the reservoir, the sediments are negatively skewed which could be due to the accumulation of clay. However, in the northern part of the reservoir and near the entrance of some tributary valleys in the middle and southern parts of the reservoir they are coarse skewed. This change in skewness is probably due to sediment supplied by the Tigris River in the northern parts and the side tributary valleys in the middle and southern parts of the reservoir. In addition, the sediments were grouped into Leptokurtic (32%), very Leptokurtic (28.5%) and Mesokurtic (16%) (Figure 11B). The distribution of kurtosis showed that sediments in the deep parts of the reservoir are extremely Leptokurtic while near shore are very Platykurtic. Also, most of the samples were Leptokurtic in the northern and middle zones, but became very Leptokurtic in the southern zone.
SUMMARY AND CONCLUSIONS
The Mosul reservoir storage capacity was reduced by 1.143 km3 due to sedimentation during
the period of 1986-2011 whereas the original capacity was 11.11 km3. This suggests an average
annual sedimentation rate of 45.72×10⁶ m3.yr-1. Most of the sediments were deposited within the
northern zone of the reservoir where the River Tigris entrance is located. The rate of reduction in volume capacity decreases gradually from in the northern zone (7.74%), to the middle zone (3.87%) and then to the southern zone (3.12%) (Issa, et al., 2013).
Bottom sediments of the Mosul Reservoir are composed of various size fractions ranging from Gravel (3.8%), to Sand (15%), to Silt (55.5%) and then to Clay (25.7%). The distribution of these sediments indicates that the silt portion represents the highest 77% of the bottom sediments of this reservoir followed by clay (13.5%) and then sand with gravel (9.5%). However, sand Figure 10. Distribution of the sorting for bottom sediment of Mosul Reservoir.
percentages are the highest in the northern zone of the reservoir where the River Tigris enters the reservoir and decreases gradually toward the dam site. In the meantime, silt percentage decreases toward the dam site while the finer fraction (i.e. Clay) increases. The samples were classified and they are: Silt (45%) followed by Mud (23%), Sand (21%) and Clay (11%).
Statistically, the average median and mean sizes of the sediments are 2.81 phi (0.142 mm) and 6.1 phi (0.0146 mm) respectively. In addition, the sediments are poorly sorted, nearly symmetrical in Skewness and Leptokurtic, very Leptokurtic, to Mesocratic. Finally, it is believed that the geometry and hydrodynamics of the Mosul Reservoir, the location of the River Tigris entrance together with the side tributary valleys have played the most important role on the sediments distribution and their characteristics.
ACKNOWLEDGMENT
The authors would like to express their thanks and gratitude to Professor John McManus of St. Andrews University, UK and Dr. Adnan Aqrawi of Statoil, Norway for his fruitful suggestions and discussions. We would also like to offer our sincere thanks to Mosul University-Water Resources Engineering Department of to provide a soil physics laboratory for the analysis of sediment samples. The research presented has been financially supported by Luleå University of Technology, Sweden and by “Swedish Hydropower Centre - SVC” established by the Swedish Energy Agency, Elforsk and Svenska Kraftnät together with Luleå University of Technology, The Royal Institute of Technology, Chalmers University of Technology and Uppsala University. Their support is highly appreciated.
REFERENCES
Al-Ansari, N.A. and Knutsson, S. 2012. Reduction of Storage Capacity of two Small Reservoirs in Jordan. J. Earth Science and Geotechnical Engineering, V. 2, No. 1, pp17-37.
Al-Taiee, T. M. 2005. Distribution of bed sediment material in the Mosul Reservoir, Iraq. J. Environmental Hydrology, V. 13, pp 9.
Blott, S.J. and Pye, K. 2012. Particle size scales and classification of sediment types based on particle size distributions: Review and recommended procedures. J. Sedimentology, V 59, 7, 2071-2096.
Brandt, S. 2000. Classification of geomorphological effects downstream of dams, Catena. V 40,4, 375-401. Brierley, G.J. and Fryiers, K.A. 2005. Geomorphology and River Management: Applications of the River Styles
Framework, Blackwell, Oxford.
Charlton, R. 2008. Fundamentals of fluvial geomorphology. Routledge, Oxon.
Childs, M. 2010. Literature survey: The impact of dams on river channel geomorphology. MSc thesis, Dept. Geography, University of Hull, UK.,31p.
Ezz-Aldeen, M., Al-Ansari, N.A. and Knutsson, S. 2012a. Runoff and Sediment Load from the Right Bank Valleys of Mosul Dam Reservoir. J. Civil Engineering and Architecture, V. 6 , No. 10, 1414-1419.
Ezz-Aldeen, M., Al-Ansari, N.A. and Knutsson, S. 2012b. Sediment Delivery from Right Bank Valleys to Mosul Reservoir, Iraq. J. Ecology and Environmental Sciences, V.3, No. 1, pp50-53.
Ezz-Aldeen, M., Al-Ansari, N.A. and Knutsson, S. 2013. Application of Swat Model to Estimate the Sediment Load From the Left Bank of Mosul Dam. J. Advance Science and Engineering Research, V. 3, No. 1, pp47-61.
Folk, R.L. 1954. The distinction between grain size and mineral composition in sedimentary rock nomenclature. Jour.of Geology 62 (4), pp344-359.
Folk, R.L. 1974. Petrology of Sedimentary Rocks, Hemphill Publ. Co., Texas.
Garde, R.J. and Ranga Raju, K.G. 2000. Mechanics of sediment transportation and alluvial stream problems. New Age International, New Delhi.
Graf, W. 2005. Geomorphology and American Dams: The scientific, social and economic context. Geomorphology, 71, pp3-26.
Grant, G.E., Schmidt, J.C., and Lewis, S.L. 2003. A Geological framework for interpreting downstream effects of dams on Rivers, Water Science and Applications, V. 7, pp209-225.
Gordon, E. and Meentemeyer, R.K. 2006. Effects of dam operation and land use on stream channel morphology and repirian vegetation. Geomorphology, V. 82, pp412-429.
Issa, I.E., Al-Ansari, N. and Knutsson, S. 2013. Sedimentation and New Operational Curve for Mosul Dam, Iraq. Accepted for publication, J. Hydrological Sciences.
Iraqi Ministry of Water Resources, 2011. Water Resources, Mosul dam, http://www.mowr.gov.iq/ cwaterresourceview.php?id=54 (accessed 11-10-2011)
Julien, P.Y. 2010. Erosion and Sedimentation, 2nd Edition. Cambridge University Press, NY.
Leopold, L.B. and Maddock, T. 1953.The hydraulic geometry of stream channels and some physiographic implications. US Geological Survey, Paper 2521.
Leopold, L.B., Wolman, M.G. and Miller, J.B. 1964. Fluvial processes in geomorphology. W.H. Freeman and Co., San Francisco.
McCartney, M. 2009. Living with dams: managing the environmental impacts, Water Policy. V. 11,1,1pp21-139. Morris, G.L. and Fan, J. 1998. Reservoir sedimentation handbook, Design and management of dams, reservoirs,
and watersheds for sustainable use. McGraw-Hill Book Co., New York.
Petts, G.E. 1980. Longterm consequences of upstream impoundment. Environmental Conservations, V.7, 4, 325-332.
Petts, G.E. 1984. Impounded Rivers, Willey, Chichester.
Saleh, D.K. 2010. Stream Gage Descriptions and Stream flow Statistics for Sites in the Tigris River and Euphrates River Basins, Iraq. U.S. Geological Survey. Data series 540.
Schumm, S.A. 2005. River variability and complexity. Cambridge University Press.
Strand, R.I. and Pemberton, E.L. 1982. Reservoir Sedimentation, Technical Guideline for Bureau of Reclamation, US Dept. of Interior, 55p.
Vericat, D. and Batella, R.J. 2005. Sediment transport in a highly regulated system during two consecutive floods (lower Ebro River, North-east Iberian Peninsula ( Earth Surface Processes and Landforms, V. 30, pp385-402.
ADDRESS FOR CORRESPONDENCE Nadhir Al-Ansari
Department of Civil, Env. and Nat. Res. Engineering Lulea University of Technology
Lulea, Sweden