Nature of the Distributed of the Bed Sediment within Mosul Dam
Reservoir, Iraq
Nadhir Al-Ansari
1, Issa E. Issa
2, and Sven Knutsson
3 2Lulea University of Technology, Sweden and Mosul University, Iraq
1,3Lulea University of Technology, Sweden
nadhir.alansari@ltu.se
issa.elias@ltu.se
sven.knutsson@ltu.se
ABSTRACT
Mosul Dam is one of the biggest hydraulic structures in Iraq. It was constructed in 1986 on the Tigris River in the north of Iraq. The initial storage capacity and water surface area of its reservoir reaches 11.11 km3 and 380 km2 respectively at the maximum operation level 330 m a.s.l. The dam was operated in 1986. A total of 56 samples were collected from the bottom of Mosul reservoir covering most of the reservoir area. The results of the analysis of these samples revealed that they were composed of gravel (3.8%), sand (15%), silt (55.5%) and clay (25.7%). The distribution of these sediments indicates that the silt portion represents the highest followed by clay and then sand. However, sand percentages are the highest in the northern zone of the reservoir where the River Tigris enters the reservoir and decreases gradually toward the dam site. In the meantime, silt percentage decreases toward the dam site while the finer fraction (i.e. clay) increases.
.صخلملا
مﺎﻋ ءﻰﺷﻧا دﻗ نﺎﻛ قارﻌﻟا ﻲﻓ ﺔﻳﻛﻳﻟوردﻳﻬﻟا تﺎﺷﻧﻣﻟا رﺑﻛا نﻣ دﺣاو ﻝﺻوﻣﻟا دﺳ 1986 ﺔﻠﺟد رﻬﻧ ﻰﻠﻋ .قارﻌﻟا ﻝﺎﻣﺷ ﻝﺻﻳ ﻪﺗرﻳﺣﺑﻟ ﺔﻳﺣطﺳﻟا ﺔﺣﺎﺳﻣﻟاو ﺔﻳﻟوﻻا نﻳزﺧﻟا ﺔﻌﺳ 11.11 مﻛ 3 و 380 مﻛ 2 ﻝﻳﻐﺷﺗﻠﻟ ىوﺗﺳﻣ رﺑﻛا دﻧﻋ ﻲﻟاوﺗﻟا ﻰﻠﻋ 330 م ﺔﺣﺎﺳﻣ مظﻌﻣ ﻲطﻐﺗﻟ تﻌﻣﺟ دﻗ تﻧﺎﻛ نازﺧﻟا رﻌﻗ تﺎﻳﺑوﺳر نﻣ ﺔﻧﻳﻋ نوﺳﻣﺧو تﺳ .رﺣﺑﻟا ﺢطﺳ ىوﺗﺳﻣ قوﻓ ﺑوﺳرﻟا ﻩذﻬﻟ ﻲﻛﻳﻧﺎﻛﻳﻣﻟا ﻝﻳﻠﺣﺗﻟا ﺞﺋﺎﺗﻧ .ةرﻳﺣﺑﻟا تﻧﺎﻛ ﻰﺻﺣﻟا ﺔﺑﺳﻧ نا ترﻬظا تﺎﻳ 3.8% ﻝﻣرﻟاو 15% نﻳرﻐﻟاو 55.5% و نﻳطﻟا .25.7% نﻳرﻐﻟا ﺔﺑﺳﻧ نا تﻧﻳﺑ تﺎﻳﺑوﺳرﻟا ﻊﻳزوﺗ ﺞﺋﺎﺗﻧ ﻲﻫ ﻝﻣرﻟا ﺔﺑﺳﻧ نا ﺎﻣﻧﻳﺑ ﻝﻣرﻟاو نﻳطﻟا نﻣ ﻰﻠﻋا ﻲﻓ ,نازﺧﻟا ﻩﺎﺟﺗﺎﺑ ﺎﻳﺟﻳردﺗ ﻝﻘﺗو ةرﻳﺣﺑﻟا ﻰﻟا ﺔﻠﺟد رﻬﻧ ﺎﻬﻳﻓ ﻝﺧدﻳ ﻲﺗﻟا ﺔﻘطﻧﻣﻟا ﻲﻓ نازﺧﻠﻟ ﻲﻟﺎﻣﺷﻟا ءزﺟﻟا ﻲﻓ ﻰﻠﻋا تﻧﺎﻛ .دادزﺗ (نﻳطﻟا ﻝﺛﻣ) ﺔﻣﻋﺎﻧﻟا داوﻣﻟا ﺔﺑﺳﻧ ﺎﻣﻧﻳﺑ دﺳﻟا ﻊﻗوﻣ ﻩﺎﺟﺗﺎﺑ ﻝﻘﺗ نﻳرﻐﻟا ﺔﺑﺳﻧ كﻟذ نوﺿﻏ
Keywords. Mosul dam, reservoir sedimentation, sediment size distribution,
INTRODUCTION
Dams are usually constructed for water resources management purposes. They might be of multipurpose functions like flood prevention, irrigation and/or power generation, etc. In all cases once the dam is constructed the sediment transport capacity of the streams is reduced upon entering the reservoir due to the decrease of flow velocity and the increase flow cross sectional area. Most of the sediments are usually deposited in the reservoir headwater area except the fine grained particles that are expected to be farther transported and deposited within the vicinity of the dam. The sedimentation rate depends on the amount of sediment transported by the stream, sediment production in the catchment area and the mode of deposition [1]. On the other hand, reservoir sedimentation depends on the geometry and operational procedure of the reservoir, river regime and its flood frequencies, sediment consolidation, flocculation, and density currents as well as possible changes in land use [1]. When dams are constructed on rivers, they dramatically alter the balance of sediment inflow and outflow. This change will affect the function of the reservoir. More than 90% of the sediments are usually trapped within the reservoir [2]. Most of the sediments will be trapped within the reservoir and only fine particles are released downstream [3 and 4].
In this research, a total number of 56 sediment samples were collected from the bed of Mosul reservoir to study their nature and distribution. This study intends to characterize the sediments deposited within the dam reservoir vicinity in terms of their size and their distribution within the reservoir.
THE MOSUL RESERVOIR
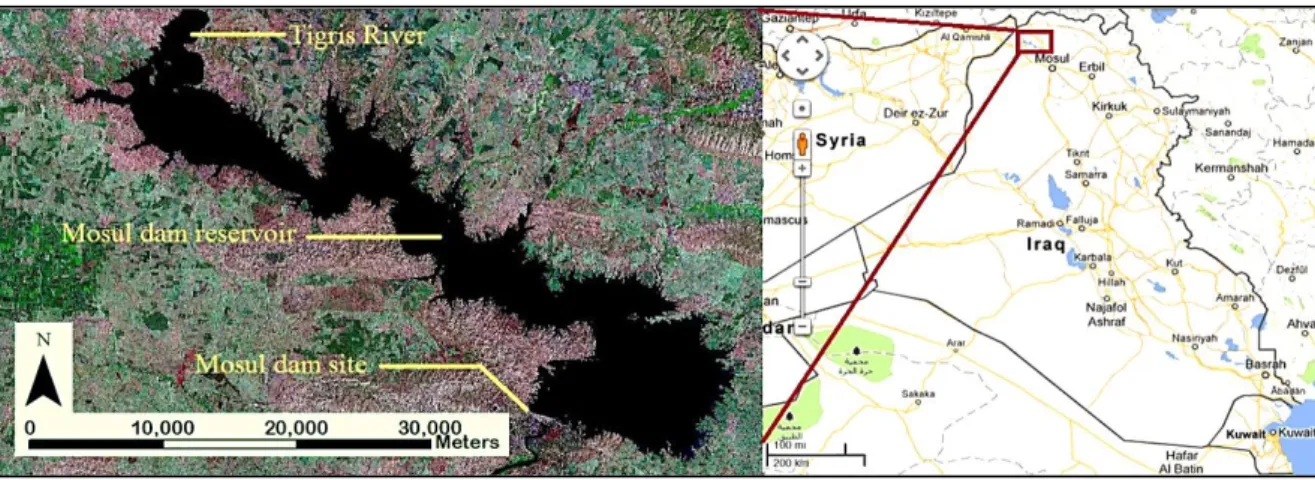
The Mosul reservoir is located between latitude (4055000 to 4086000) m Northing and longitude (275000 to 320000) m Easting (Figure 1). The length of the reservoir is about 45 km and its width ranges between 2 and 14 km at the maximum operation level of 330 m a.s.l. The greatest water surface area of the reservoir is calculated to be 380 km2 at the maximum operation level of 330 m a.s.l. The storage capacity of the reservoir reaches 11.11 km3 of which 2.95 km3 are dead storage [5]. The catchment area of the River Tigris estimated above the Mosul dam is about 54900 km2 shared by Turkey, Syria and Iraq [6]. The main inflow entering the reservoir is from the River Tigris. There are 10 valleys contributing to Mosul reservoir (Table 1).
Table 1. Some properties of the main tributary valleys surrounding the Mosul Reservoir from
both eastern and western sides.
Valley name Side
feeding Area km
2 Slope Length km Mean basin level m
a.s.l
Sweedy Right 450.76 0.0359 38.8 446.62
Kara Kandy Right 78.52 0.0217 21.82 388.38
Khuyr Hara Right 50.06 0.0525 10.86 404.89
Amlik Left 88.95 0.0281 38.94 470.42
Jardyam Left 88.73 0.0215 52.68 457.1
Affkery Left 139.5 0.0214 58.04 445.34
Khrab Malk Left 119.6 0.0255 51.32 475.87
Naqeb Left 104.1 0.0143 54.71 426.52
Kalaq Left 162.26 0.0173 60.52 424
Saeed Thaher Left 92.25 0.026 43.23 414
Mosul dam operates to provide storage for three irrigation projects, power generation, regulation and flood control for the Tigris River and also for recreation. Dam operation started during June, 1984 with the initial reservoir filling during the spring of 1985 but the actual operation began in July, 1986 [5].
DATA COLLECTION AND METHODOLOGY
Fifty six sediment samples were collected from the bottom of the Mosul reservoir using a Van Veen grab. The work was conducted in May 2011, twenty six years after the initial impounding, using a boat equipped with “Real-Time Kinematic Global Positioning System (RTK-GPS)” and an echo sounder Sea Charter 480DF to define the absolute x,y,z coordinates of the reservoir bottom during sampling. The locations of the samples, which were collected across the entire bottom of the reservoir, were projected on the satellite image using Arc/GIS software (Figure 2). To determine the size distribution of the sediment, all the samples were sieved at Mosul University labs. The fine fraction (silt and clay) was subjected to hydrometer analyses at the same labs.
RESULTS INTERPRETATION AND DISCUSSION
Over all the grain size analyses of the bed samples from the Mosul reservoir indicate that the sediments comprised Gravel: Sand: Silt: Clay in the ratios 3.8: 15: 55.5: 25.7 respectively. The silt portion occupies 77% of the surface area of the bottom of the reservoir followed by clay 13.5% and sand with gravel 9.5% (Figure 3). The sand dominated areas are confined near the shores of the reservoir while the clay occupies the deepest parts of the basin.
From textural perspective using Folk’s (1954) classification [7 and 8], the sediments are mainly dominated by silt reaching 42.86%, which are followed by mudstone 19.64%, and clay 10.7% on the gravel: sand: mud triangle while on the sand: silt: clay triangle gravelly muddy sand is the dominant 16.1%, followed by slightly gravelly muddy sand 5.36% and 5.34% divided between gravelly mud, slightly gravelly sandy mud and sandy silt (Figure 4). Al-Taiee [9] reported that sediment at the bottom of the reservoir were 70% silt loam, 11% silt, 11% silt clay loam and 8% loam. This is due to the fact that he used soil classification for agricultural purposes.
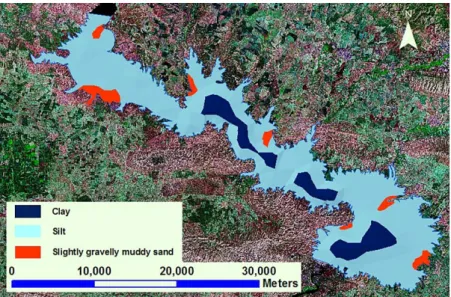
Gravels and sand are confined in patches near the entrance of tributary valleys on both eastern and western sides of the reservoir together with the entrance of River Tigris from north (Figure 5). On the other hand, silt and clay cover most of the surface area of the reservoir bottom. The latter sediment sizes always occupy the relatively deep parts of the reservoir (Figure 5). In addition, the longitudinal distribution of the sediments also confirms this pattern (Figure 6). In Figure (6), it is quite evident that the sand percentages are higher in the northern zone of the reservoir where the River Tigris enters the reservoir and decreases gradually southward. Silt percentages decrease toward the dam site in the south while the clay fraction increases in the same direction. This is a very common pattern [10, 11, 12 and 13] when a reservoir has one main feeder like the Tigris River in our study case, because the velocity of water entering the reservoirs drops tremendously and suddenly causing the deposition of coarser fractions near the feeder entrance.
Figure 3. Map of the Mosul Reservoir showing the deposition pattern of various sediment
Figure 4. Plot of bed sediment samples of Mosul Reservoir using Folk (1954) Classification.
Figure 5. Distribution of the Gravel, Sand, Silt and Clay fractions of the bottom sediments
Figure 6. Longitudinal distribution of sand, silt and clay fractions in the bottom sediments
across the Mosul Reservoir.
SUMMARY AND CONCLUSIONS
The Mosul reservoir storage capacity was reduced by 1.143 km3 due to sedimentation during the period of 1986-2011 whereas the original capacity was 11.11km3. This suggests an average annual sedimentation rate of 45.72×10⁶ m3.yr-1. Most of the sediments were deposited within the northern zone of the reservoir where the River Tigris entrance is located. The rate of reduction in volume capacity decreases gradually from in the northern zone (7.74%), to the middle zone (3.87%) and then to the southern zone (3.12%) [14].
Bottom sediments of the Mosul Reservoir are composed of various size fractions ranging from Gravel (3.8%), to Sand (15%), to Silt (55.5%) and then to Clay (25.7%). The distribution of these sediments indicates that the silt portion represents the highest 77% of the bottom sediments of this reservoir followed by clay (13.5%) and then sand with gravel (9.5%). However, sand percentages are the highest in the northern zone of the reservoir where the River Tigris enters the reservoir and decreases gradually toward the dam site. In the meantime, silt percentage decreases toward the dam site while the finer fraction (i.e. Clay) increases. The samples were classified and they are: Silt (45%) followed by Mud (23%), Sand (21%) and Clay (11%).
ACKNOWLEDGMENT
The authors would like to express their thanks and gratitude to Professor John McManus of St. Andrews University, UK and Dr. Adnan Aqrawi of Statoil, Norway for his fruitful suggestions and discussions. We would also like to offer our sincere thanks to Mosul University-Water Resources Engineering Department to provide a soil physics laboratory for the analysis of sediment samples. The research presented has been financially supported by Luleå University of Technology, Sweden and by Swedish Hydropower Centre - SVC established by the Swedish Energy Agency, Elforsk and Svenska Kraftnät together with Luleå University of Technology, The Royal Institute of Technology, Chalmers University of Technology and Uppsala University. Their support is highly appreciated.
0 10 20 30 40 50 60 70 80 90 100 0 10 20 30 40 50 60 % Distance from dam site (km) % clay % Sand % Silt
REFERENCES
[1] Julien, P.Y., “Erosion and Sedimentation, 2nd Edition”. Cambridge University Press, NY, 2010, 391pp.
[2] Graf, W., “Geomorphology and American Dams: The scientific, social and economic context”. Geomorphology, Vol. 71, 2005, pp. 3-26.
[3] Brandt, S., “Classification of geomorphological effects downstream of dams”. Catena. Vol. 40, No. 4, 2000, pp. 375-401.
[4] Brierley, G.J. and Fryiers, K.A., “Geomorphology and River Management: Applications of the River Styles Framework”. Blackwell Publishing, Oxford, UK, 2005, 398pp. [5] Iraqi Ministry of Water Resources, “Water Resources, Mosul dam”. 2012, Available
online at: http://www.mowr.gov.iq/cwaterresourceview.php?id=54 (accessed 11 May 2012).
[6] Saleh, D.K., “Stream Gage Descriptions and Stream flow Statistics for Sites in the Tigris River and Euphrates River Basins, Iraq”. U.S. Geological Survey. Data series 540, 2010, 154 pp. Available online at: http://pubs.usgs.gov/ds/540/pdf/ds540.pdf (accessed 10 April 2011)
[7] Folk, R.L., “The distinction between grain size and mineral composition in sedimentary rock nomenclature”. Jour.of Geology, Vol. 62, No. 4, 1954, pp.344-359.
[8] Folk, R.L., “Petrology of Sedimentary Rocks”. Hemphill Publ. Co., Texas, 1974, 190 pp. [9] Al-Taiee, T. M., “Distribution of bed sediment material in the Mosul Reservoir, Iraq”. J.
Environmental Hydrology, Vol. 13, 2005, pp.1- 9.
[10] Petts, G.E., “Impounded Rivers”. John Willey, Baffins Lane, Chichester, UK, 1984, 326 pp.
[11] Morris, G.L. and Fan, J., “Reservoir sedimentation handbook, Design and management of dams, reservoirs, and watersheds for sustainable use”. McGraw-Hill Book Co., New York, 1998, 805 pp.
[12] Garde, R.J. and Ranga Raju, K.G., “Mechanics of sediment transportation and alluvial stream problems”. New Age International, New Delhi, 2000, 712 pp..
[13] Al-Ansari, N.A. and Knutsson, S., “Reduction of Storage Capacity of two Small Reservoirs in Jordan”. J. Earth Science and Geotechnical Engineering, Vol. 2, No. 1,
2012, pp.17-37.
[14] Issa, E.I., Al-Ansari, N.A. and Knutsson, S., “Sedimentation and New Operational Curve for Mosul Dam, Iraq,” Hydrological Sciences Journal, Vol. 58, No. 7, 2013, pp. 1–11.