Research
COMRAD – Comprehensive investigation
of the performance of computed and
digital radiography
2017:32
Authors: Gustav Holmer
Lars Hammar Ulf Hjern
SSM perspective
Background
Within the industry, there has long been a need to replace the tradi-tional X-ray film and its handling. These both for economic and environ-mental considerations.
Both computed radiography and digital radiography offer many advan-tages over the traditional use of x-ray with film. However, the transition from film-based radiography requires in-depth knowledge of the rela-tionship between these different methods.
NUGENIA proposed in the ENIQ Task Group on Qualifications Working Group a joint venture project under the name COMRAD. A number of parameters were proposed that needed to be studied in depth within the framework of this project. These studies will then form the basis of an ENIQ (NUGENIA) recommended practice for digitized X-ray technology.
Objectives
The purpose of the project is to conduct an overall study of digital x-rays to identify important parameters that affect the performance of a digital x-ray system. This in order to have a consistent approach to the prepara-tion of inspecprepara-tions and related technical justificaprepara-tions.
This study will form the basis of an ENIQ (NUGENIA) recommended practice for digital radiography. ENIQ recommended practice will provide guide lines for assessment of technical justifications, for impor-tant and influential parameters in this test area and for optimization of defect content in the manufacture of test blocks.
SSM´s objectives contributing within this project have been to build up expertise in digital radiography for qualification activities and enable further development of the research that Chalmers University of Tech-nology has carried out in the field of digital x-ray techTech-nology through a licentiate project that SSM and the Swedish nuclear license holders have previously financed. Further, it is important for SSM to promote interna-tional participation to spread and raise knowledge in this area.
Results
This project have resulted in a number of influencing parameters that may be required to take into account when using digital radiography. As it´s mentioned before these results will form the basis of an ENIQ (NUGENIA) recommended practice for digital radiography.
Need for further research
SSM agrees with the recommendations from the author on the need of future research activities.
Project information
Contact person SSM: Giselle García Roldán Reference: SSM2014-1151, 7030084-00
2017:32
Authors: Gustav Holmer 1), Lars Hammar 2), Ulf Hjern 1), Tommy Zettervall 1)
1) SQC Swedish Qualification Centre, Täby Sweden 2) Chalmers Tekniska Högskola, Gothenburg Sweden
COMRAD – Comprehensive investigation
of the performance of computed and
digital radiography
This report concerns a study which has been conducted for the Swedish Radiation Safety Authority, SSM. The conclusions and view-points presented in the report are those of the author/authors and do not necessarily coincide with those of the SSM.
Sammanfattning
Syftet med denna rapport är att visa att man med hjälp av simulering kan påvisa att digital röntgenradiografering kan användas för att detektera, karaktärisera och storleksbestämma driftsinducerade defekter.
I detta projekt har två typer av simuleringsprogram använts, det ena är aRTist som simulerar röntgenbilderna för de i projektet använda strålkällorna och detektorerna utifrån den prestanda dessa har och det andra är PENELOPE som är baserat på Monte-Carlo metoden. Vid simuleringen av detektorerna fanns ej data tillgängligt för signal-brus förhållandet (SNR) vid de aktuella strålningsenergierna och de simulerade testobjektens godstjocklek. Där användes PENELOPE för att simulera dessa data med Monte-Carlo simuleringar.
Då röntgen-radiografering är en volymetrisk metod, där defekternas signalsvar är propotionell mot defekternas volym, har även en del arbete lagts på att simulera defekter med realistisk volym. Dessa defekter lades in i testblock så att defekternas höjd var ungefär 20, 40 och 60 % av testobjektens väggtjocklek.
Resultaten från defekternas skönjbarhet presenteras som kontrast-brus förhållandet (CNR) och detta mättes automatiskt av ett MATLAB-program för att få en objektiv mätning. Sammantaget visar simuleringarna att man kan använda digital
röntgenradiografering för att detektera, karaktärisera och i viss mån storleksbästmma defekterna om CNR är tillräckligt högt. Det gick även att visa att kvoten mellan CNR och sprickans volym är konstant vilket är användbart när man planerar att använda metoden för sprickdetektering.
Summary
The purpose of this report is to show that by means of simulation that digital x-ray imaging can be used to detect, characterize and quantify service-induced defects. In this project, two types of simulation software have been used, one of which is aRTist that simulates the x-rays of the projected sources and detectors based on their performance and the other is PENELOPE based on the Monte-Carlo method. In the simulation of the detectors, no data was available for the signal-to-noise ratio (SNR) at the current radiation energy and the simulated test object's wall thickness. There, PENELOPE was used to simulate these data with Monte-Carlo simulations. When X-ray radiography is a volumetric method, where the deficiency signal response is propotional to the volume of the defects, some work has also been done to simulate realistic volume defects. These defects were loaded into test blocks so that the defects height was about 20, 40 and 60% of the test wall thickness. The results of the deficiencies are presented as the contrast-noise ratio (CNR) and this was automatically measured by a MATLAB program for objective
measurement. All in all, the simulations show that digital x-ray imaging can be used to detect, characterize and to some extent the largest defects if the CNR is high enough. It was also possible to show that the ratio of CNR to the crack volume is constant, which is useful when planning to use the crack detection method.
Table of contents
List of abbreviations ... 2 Background ... 3 1. Objectives ... 4 1.1. Work Package 1 ... 4 1.2. Work Package 2 ... 4 1.3. Work Package 3 ... 5 1.4. Work Package 4 ... 5 1.5. Work Package 5 ... 6 2. Scope of simulations ... 6 2.1. Simulation Software ... 6 2.1.1. aRTist (2.8.1) ... 7 2.1.2. PENELOPE (NEA-1525.018) ... 72.2. Digital test blocks ... 7
2.3. Design of artificial cracks ... 8
2.4. X-ray sources ... 10
2.5. Detectors ... 11
2.6. Scattering ... 13
2.7. Exposure simulations ... 14
3. Results ... 16
3.1. Results Work Package 1 ... 16
3.2. Results Work Package 2 ... 16
3.3. Results Work Package 3 ... 24
3.4. Results Work Package 4 ... 25
3.5. Results Work Package 5 ... 27
4. Conclusions and lessons learned ... 31
5. Essential / influential parameters ... 32
6. Recommendations for future activities ... 34
List of abbreviations
Abbreviation Explanation ASTM American Society for Testing and Materials BAM Bundesanstalt für Materialforschung und ‐prüfung CAD Computer Aided Design CNR Contrast to Noise Ratio CR Computed Radiography CTH Chalmers University of Technology DDA Digital Detector Array DM Dissimilar Weld DR Direct Radiography or Digital Radiography EN European Standard ENIQ The European network for inspection and qualification FFD Focus‐to‐detector distance FOD Focus‐to‐Object Distance GV Grey Value IQI Image Quality Indicator NUGENIA NUclear GENeration II & III Association ODD Object‐to‐Detector Distance RT Radiographic Testing SCC Stress Corrosion Crack SNR Signal to Noise Ratio SQC Swedish Qualification Centre AB SRb Basic Spatial Resolution SSM Swedish Radiation Safety Authority UG Geometric Unsharpness WP Work PackageBackground
Film radiography is the dominant method for weld control. The spatial resolution of industrial x-ray film is high and is relatively sensitive to detect volumetric defects. The method is also useful for detecting service induced defects but has its limita-tions. Service induced defects normally means some form of degradation of compo-nents, e.g. corrosion or cracking. In this the definition of service induced defects to stress corrosion cracking in materials such as stainless steel or nickel based alloys. These defect types are not directly suitable for film radiography, because its volume is small, and therefore is a rarely used method. The development of digital x-ray de-tectors has drastically reduced the use of radiographic film in the medical area. The aim of this project is to demonstrate the performance of digital technology compared to industrial radiographic film.
Simulation is a tool to build realistic models in order to achieve data that would be very expensive and time consuming to acquire in any other way. Simulation of radi-ography differs from simulation of other nondestructive testing techniques (i.e. ultra-sonic or eddy current testing) in a number of ways. Radiography is a volumetric method that measures the absorption of the X-rays between the radiation source and the detector. Radiography is not sensitive to material properties such as microstruc-ture or magnetism as other non-destructive test methods are which make the method suitable to simulate. The software used to simulate radiography in this project is aRTist, which is developed by Bundesanstalt für Materialforschung und Prüfung (BAM) Germany. Some of the properties of digital detectors, such as efficiency and influence of scattered radiation, are not well known for the range of thicknesses and x-ray energies used in the project. To overcome these problems, the necessary input data has created by using Monte Carlo simulation of photon-electron transports (PE-NELOPE).
The volume and morphology of defects when using radiography are of great im-portance. To receive realistic signal response, the defects has to be more or less real in the test blocks which is not easy to accomplish. As a consequence, simulation is a suitable method for the performance of radiography as cracks with real dimensions are relatively simple to create in a mathematical model where the important parame-ters are strictly controlled.
1. Objectives
Computed radiography (CR) and direct radiography (DR) are two candidates to re-place industrial x-ray film. In CR the film is rere-placed by an imaging plate, contain-ing photostimulable storage phosphor. The latent x-ray image has then to be read out by a scanner. In DR, a digital detector array (DDA), is directly captured the image in the detector. This report is focusing on in-service induced defects and therefore only DR will be studied. The CR technology is not suitable for crack detection in rela-tively thick (> 10 mm) objects which requires high energy x-ray.
The transition from traditional radiographic film to DR requires an in-depth under-standing of the relative performances of DR and film based radiography. As detec-tion, processing and interpretation of the two methods are significantly different there are many technical aspects that needs to be explored.
The aim of this project is a comprehensive study on the performance of x-ray film and DR, in order to identify the essential parameters that affect the performance of DR, thereby providing a consistent approach to inspection design and the production of technical justifications.
The result of this project shall be an ENIQ (NUGENIA) technical report that will be used by inspection designers and qualification bodies. The results are not specific to a particular reactor design, as wall thicknesses up to 72 mm will be covered. The project participants are Chalmers University of Technology (CTH) and Swedish Qualification Centre (SQC). The financiers of the project are Swedish Radiation Safety Authority (SSM) and Swedish nuclear license holders.
1.1. Work Package 1
”Because of the different spectral response of silver film and digital
detectors/imag-ing plates, digital techniques exhibit an increased sensitivity to scattered radiation. Some research has been carried out with the objective to determine suitable filters to reduce the effect of scattered radiation, but no systematic study covering the en-tire range of wall thicknesses has been done.” [1]
Scattered radiation is generated when the primary radiation attenuates the material in the test object or the surrounding area. When the scattered radiation is detected it creates noise, but does not contribute to the image. Normally the intensity of the scattered radiation is several times more intense than the primary radiation. Within this project primary and scattered radiation has been simulated. For this pur-pose, the software PENELOPE has been used. The objective with these simulations is to calculate the amount of scattered radiation and its effect on the image quality.
1.2. Work Package 2
“CR/DR has an inherent un-sharpness determined by the phosphor (CR) or scintil-lator (DR) structure and the reading process, limiting the spatial resolution. Geo-metrical magnification can potentially be used to increase the effective spatial reso-lution, but requires suitable small focal spot sizes, which in turn produce a lower photon flux. It appears essential to find the best compromise in terms of spatial
reso-While considerable work has been done to gain better understanding of the limiting factors involved, more work is necessary to address a reliable assessment of the ef-fective spatial resolution, its modelling using modulation transfer functions, and a practical verification using suitable IQIs.” [1]
Detectors used in DR have usually less spatial resolution than film as a result of the pixel size. Pixel size is normally between 100-400 µm which results in larger sharpness than industrial x-ray film. In cases where there is a requirement on un-sharpness (i.e. crack detection) an x-ray tube with small focus is preferable. Work package (WP) 2 is important as the resolution of the detector cannot be considered an isolated parameter as with film, but the resolution of the system must be taken into consideration.
To show that a certain defect can be detected by using a certain energy, focal spot size and detector resolution will result in better understanding of the essential pa-rameters.
1.3. Work Package 3
“While the signal to noise ratio is a performance limiting factor, digital detector
ar-rays potentially can obtain significantly higher signal to noise ratios by the integra-tion of multiple frames by the acquisiintegra-tion computer.
A precondition for the successful application of this technique is an appropriate de-tector calibration, which also permits the reduction of fixed pattern noise.
With regards to inspection qualification, this aspect is especially important and will be investigated in the project, as a recommended practice for detector calibration has yet to be defined.” [1]
The signal-to-noise ratio (SNR) is proportional to square root of the amount of de-tected primary photons.
n
SNR~ 1
(1)
where ‘n’ is the number of detected primary photons. By increasing the detection ef-ficiency and the exposure time, higher SNR is achieved. This statement is not valid for industrial x-ray film as image quality is limited by maximum viewable optical density and the structural noise. With DR however, this issue doesn´t arise as the structural noise can be eliminated by gain- and offset calibration. In this case it is other factors such as thermal- and readout noise that sets the limits.
The efficiency of any given detector varies with the energy of the radiation and is generally not provided by the manufacturers. At least not for the range of energies and thicknesses used in this project. To calculate the efficiency, Monte Carlo simu-lation using the PENELOPE software, has been done. This is done to increase the knowledge of the performance for digital detector at different energies.
1.4. Work Package 4
“The selection of suitable source energy is even more important for digital
Recommendations must be given to accompany the transition to digital radiog-raphy.” [1]
In film radiography the maximum energy to be used on a certain object is regulated within standards in order to obtain optimal contrast. In the case of DR there are no such regulations of maximum energy.
A selection of objects and energies has been simulated with aRTist. SNR and Con-trast-to-Noise ratio (CNR), has been analyzed to determine which energy that gives, for a given object, the best image quality.
1.5. Work Package 5
“At the end of the inspection, CR or DR techniques provide an image. The final im-age is interpreted on a computer screen with some specifics software currently al-lowing zoom and image processing.
Recommendations must be given to define the interpretation conditions for example: type of computer screen (8 bits, 10 bits or 12 bits, colour or monochrome), image processing…” [1]
Digital technology offers high radiographic sensitivity due to its high contrast and large greyscale content. The defect information often lies within a narrow greyscale range. In a welding e.g. the greyscale range of an x-ray image is often many times greater than what the human eye can perceive. This in turn leads to that the interpret-able area, with maximum contrast, is small. Sometimes the area is so small that the interpretation is next to impossible.
There are different ways to get around this problem. One way is to smooth out the image greyscale content by using filter. Another approach, used in this project, is to use so-called background compensation which is described in chapter 3.5 ‘Results Work Package 5’.
2. Scope of simulations
Simulation of x-ray technique is a powerful tool to predict the performance of radio-graphic systems. Instead of practical verifications the technique Monte Carlo simu-lation has been used to simulate the performance of the detectors at energies where no information about their performance is available. Monte Carlo simulation is more detailed and reliable then ray-tracing technique.
2.1. Simulation Software
2.1.1. aRTist (2.8.1)
The software aRTist is developed at BAM in Germany. Its core is based on ray trac-ing technique with options to use a Monte Carlo module called McRay. The soft-ware is developed with industrial radiography in mind and all input data is based on parameters as described in ASTM/EN-standards.
2.1.2. PENELOPE (NEA-1525.018)
The software PENELOPE has been used to simulate scattered radiation and detector performance at various energies and geometries. It is based on Monte Carlo simula-tion techniques, just as the McRay module in aRTist, but is more generic and flexi-ble. The scope for PENELOPE is Monte Carlo simulation of coupled electron-pho-ton transport in arbitrary materials for a wide energy range, from a few hundred eV to about 1 GeV [3]. The software is developed at the University of Barcelona. PE-NOLOPE is a software that has been verified against other tools in previous work [4].
2.2. Digital test blocks
The defects within the test blocks are drawn in a computer aided design (CAD) soft-ware (CATIA V5-6R2013). The morphology and shapes of the cracks are based on data retrieved from the generally accepted published report ‘Crack Characterisation for In-service Inspection Planning – An Update’ [2]. The most important parameters are those that describe the volume of the cracks and its lateral displacement. The de-fects are then imported into aRTist and placed within the object to be simulated. The cracks will have to be defined as made of ‘air’ or ‘void’ to be detected as the default material for any solid in aRTist is ‘steel’.
The aim is to simulate a wide range of objects that are likely to be found in a nuclear power plant. Three tube dimensions is chosen. The objects are presented in Table 1.
Outer diameter [mm] Thickness [mm] 110 10 273 18 463 35 Table 1 Objects.
The following defect sizes has been put into the different objects (see Table 2). The values in the columns are the defect height in relation to the total penetrated material thickness (relative through wall extension).
Object Crack # 3 Crack # 4 Crack # 5 Crack # 6 Crack # 7 Crack # 8 110/10 20% 40% 69% 273/18 22% 38% 56% 463/35 20% 40% 60%
Table 2 Crack sizes.
2.3. Design of artificial cracks
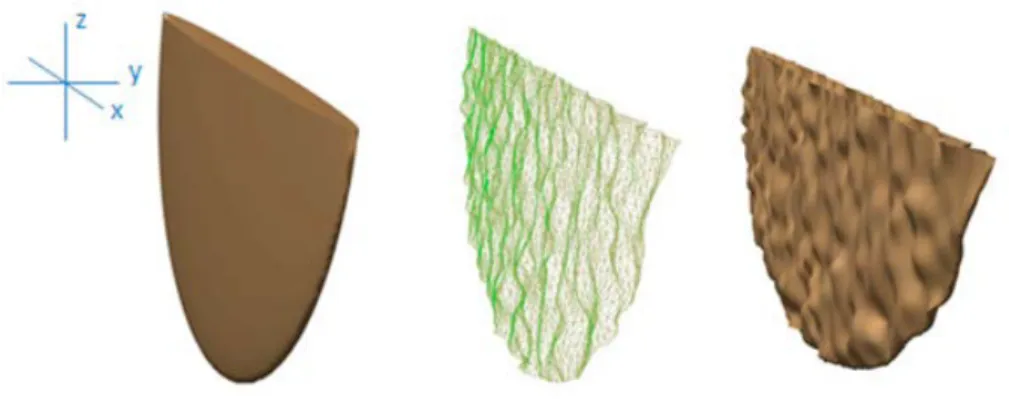
The cracks are assumed to have the shape of a half ellipsoid. Traditionally, accord-ing to fracture mechanics theory, a crack has the shape of a half paraboloid (see Ap-pendix 1). The difference is negligible and an ellipsoid is a conservative estimate compared to the paraboloid when its used to build a model of a crack.
As radiographic testing (RT) is a volumetric method, the parameters describing the volume of the crack are the important ones and being taken into account in the model. Basically these come down to the width and the surface roughness of the crack surface. The width gives the volume and the roughness gives the lateral dis-placement. The resultant defect characteristic can now be described with the param-eters defining a crack´s morphology [2].
Figure 1 Crack model with superposition of variations on ellipsoid.
The statistic variation is superimposed on top of the half ellipsoid and the result is a crack with a defined volume but with variations. Based on the generated data a CAD model of the crack is created.
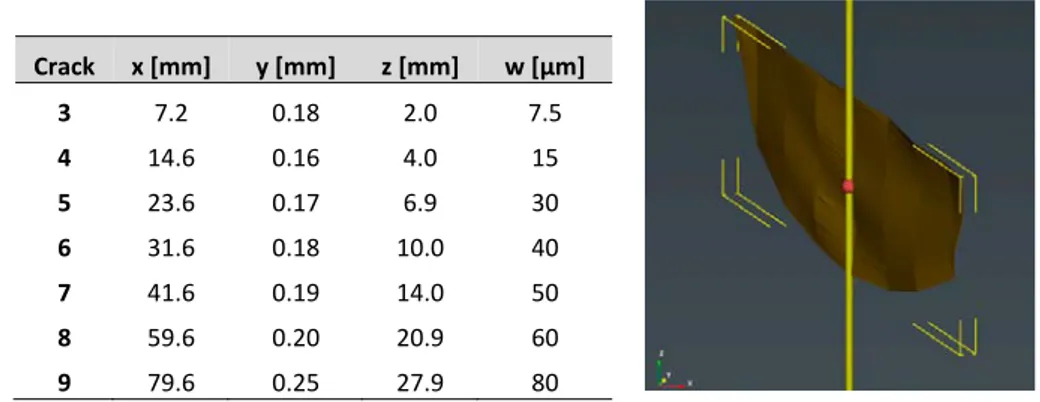
The volume of the designed cracks is based on the assumed width, w. As the cracks has a surface roughness (Rz), its projection (‘y’ in Table 3) in the y-direction is
Crack x [mm] y [mm] z [mm] w [µm] 3 7.2 0.18 2.0 7.5 4 14.6 0.16 4.0 15 5 23.6 0.17 6.9 30 6 31.6 0.18 10.0 40 7 41.6 0.19 14.0 50 8 59.6 0.20 20.9 60 9 79.6 0.25 27.9 80
Table 3 Designed cracks. Figure 2 Crack no. 3.
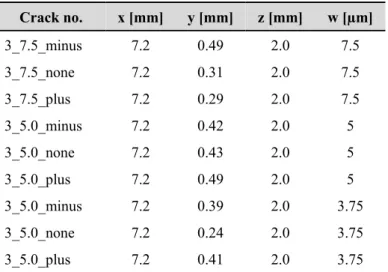
The defects in WP 5 are based on the same basic data as crack no. 3 (see Figure 2) but has a different degree of deflection and the width is varied. The defects are simu-lated entirely in MATLAB (R2015b) unlike the other defects that is generated in CAD on data from MATLAB. MATLAB is a computer program and programming language used primarily for mathematical and technical calculations. The advantage is that the model becomes more detailed but at the cost of a larger amount of data. Below are three variants of crack no. 3 (see Figure 3) which are all based on random numbers but it is controlled so that it bends slightly different. The middle is reasona-bly straight while the other bends to the left or right. They vary somewhat more in side direction which corresponds to the surface roughness compared with crack no. 3.
Figure 3 Left: Cracks with different bending direction. Right: Sections from
center.
Three sets of various bending and with different crack widths have been simulated. A total of nine cracks (see Table 4) with three different widths (3.75; 5; 7.5 µm).
Crack no. x [mm] y [mm] z [mm] w [µm] 3_7.5_minus 7.2 0.49 2.0 7.5 3_7.5_none 7.2 0.31 2.0 7.5 3_7.5_plus 7.2 0.29 2.0 7.5 3_5.0_minus 7.2 0.42 2.0 5 3_5.0_none 7.2 0.43 2.0 5 3_5.0_plus 7.2 0.49 2.0 5 3_5.0_minus 7.2 0.39 2.0 3.75 3_5.0_none 7.2 0.24 2.0 3.75 3_5.0_plus 7.2 0.41 2.0 3.75
Table 4 Data from simulated cracks with different width.
2.4. X-ray sources
The software can simulate different spectra of energies for any given configuration of an X-Ray tube. The spectra calculated by aRTist has been validated for a number of energies using Monte Carlo simulations with good conformity (see Appendix 2). Hence, the aRTist calculated energy spectra can be used with confidence.
Focus power Focus size Tube name Voltage [kV] Small [W] Large [W] Small [mm] Large [mm] Coverage MXR‐451/26 450 900 4500 2.5 5.5 40° MXR‐451HP/11 450 700 1500 0.4 1.0 40° x 30° MXR‐601HP/11 600 700 1500 0.7 2.0 40° x 30°
Table 5 Simulated X-Ray machines.
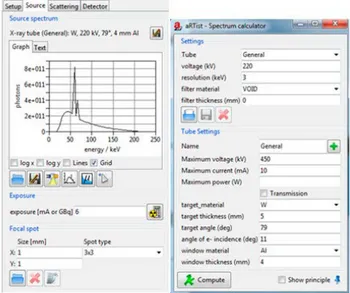
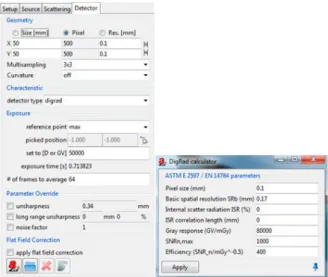
Only X-ray machines has been taken into account. No type of radioactive isotope is considered as the intensity is only a fraction compared to the X-ray machines. Three X-ray tubes found to be appropriate and were included in the study (see Table 5). All these three are all bipolar X-ray tubes made of metal/ceramic. The difference be-tween the X-ray tubes is that they have different focus sizes and maximum power. There are two 450 kV and one of the tubes have maximum accelerating voltage of 600 kV. Parameters to be entered into aRTist (see Figure 4) are listed below:
Spectrum. The aRTist software simulates the x-ray tube spectrum, the
inten-sity distribution in the focus and the inherent filtration in the x-ray tube.
Voltage. The accelerating voltage together with the filter material and its
Exposure. The current (mA) is stated in the source module. The exposure time is entered into the detector module which gives the exposure express as mAs.
Spot size and type. Focus intensity distribution is simulated by dividing the
focus in a number of points (e.g. 3x3) which are evenly distributed over the focus area has to be specified.
Figure 4 Dialogue box for input of source parameters.
2.5. Detectors
A digital detector is defined as a detector with digital output. The most common are CR imaging plates and DR flat panel detectors. There are other digital X-ray detec-tors but these are not included in this study as these are less suitable. Conventional radiographic film is already supplied within aRTist and will be used in the COM-RAD-project.
CR was rejected due to the fact that the efficiency of the CR plates decrease at higher energies than typically 200 kV. Together with the inherent structural noise makes the less suitable for detection of service induced cracks and therefore not of interest for the cases identified.
Two commercially available detectors (DR) where selected. They are both based on thin film technique but with slightly different pixel sizes and different x-ray sensi-tive phosphor layer (see Figure 5). The selected detectors were:
GE DXR 500L, (pixel.size =100 µm. 300 µm CsI).
Vidisco Razor, (pixel.size = 142 µm. 200 µm Gd2O2S).
The GE DXR 500L detector with cesium-iodine screen (CsI) have thicker phosphor but as it consists of directional grown crystals the spatial resolution is higher than
the Vidisco detector with gadolinium-oxo-suphide screen (Gd2O2S). There are also
flat panels detectors with larger pixels but they are not included in this study because the detector unsharpness is too large.
Figure 5 Left: GE DXR 500L. Right: Vidisco Razor.
In the detector module of aRTist the detector is defined by its performance. Not how it is built or of what materials the detector is made of. Instead, the detector perfor-mance is specified in a number of parameters. However, it has not been possible to obtain reliable data for the detectors at the energy levels and the material thicknesses to be simulated. The detector efficiency defined as SNR per unit radiation ( SNRn /
mGy0.5 ) is than simulated by using Monte Carlo method (see Appendix 3). The
pa-rameters to be entered into aRTist (see Figure 6) are:
Gain. The gain is expressed as gray value (GV) per radiation dose
(GV/mGy).
SNRn. The noramalized SNR is expressed as efficiency (see Appendix 3).
Pixel size. The size of the pixels is defined as the pixel pitch not the physical
pixel size.
Basic spatial resolution (SRb). The measured spatial resolution according to
ASTM E2597. The value of SRb has to be estimated in these simulations.
Figure 6 Dialogue box for input of detector parameters.
2.6. Scattering
The major part of the scattered radiation is secondary radiation that has been pro-duced when photons been attenuated by the Compton effect. Another potential source of scattered radiation is secondary electrons origin from the photo- or Comp-ton effect. When the scattered radiation hits the detector noise is created in the image. The intensity of this radiation is called the ‘built-up’ factor. It is defined as follows:
D S up II
Built 1 (2)
Where IS = Scattered radiation
ID = direct radiation
The scattered radiation is dependent on many different factors such as materials in the detector, distance between detector and object and shape and size of the object. Any specific setup for exposure has an own unique built-up factor. Hence, it can be simulated using Monte Carlo methods in order to obtain realistic values for the de-fined geometries. The simulations are performed in a two-step sequence, ‘broad-beam’ and ‘narrow-‘broad-beam’. ‘Broad-‘broad-beam’ is all detected radiation, direct and scat-tered while ‘narrow-beam’ is only the direct radiation. By entering the values given by these two simulations into the equation the ‘built-up’ factor can be calculated.
2.7. Exposure simulations
A series of exposures have been simulated to study how the unsharpness affects the contrast (WP 2) and to find the optimum accelerating voltage (WP 4) for the differ-ent pipe dimensions. For each dimension cracks with a crack depth of 20, 40 and 60% of the wall thickness are tested (see Table 6). The defects are surface breaking and placed close to the detector in the tube axial direction of the pipe.
The exposure geometry (see Figure 7) is the same for all exposures where the focus-to-detector distance (FFD) varies depending on pipe size. The distance between the x-ray source and the test object (FOD) and the distance between the object and the detector (ODD) are constant.
Figure 7 Schematic setup of an exposure.
Diameter
[mm] FOD [mm] ODD [mm] FFD [mm]
110 120 10 240
273 120 10 403
463 120 10 593
Table 6 Exposure geometry data.
FFD
FOD
All exposures have the same exposure time (20s) and are corrected with background correction where the exposure time of the background image is doubled (40s). Back-ground correction is based on the following formula:
ܥܫ௫Ǥ௬ ൌூூೣǤೣǤήெ ܤܮ (3)
Where:
Ix. y is a pixel value of the original image
BIx. y is a pixel value of the background image
M is the average pixel value of the background image
BL is the level of grayscale added
Each pixel of the x-ray images is divided by the pixel values of the background im-ages. The individual gain of each pixel is normalized to one which eliminates the structural noise.
Figure 8 X-ray image with
defect and line profile. Figure 9 Line profile across a defect to measure CNR.
Contrast (CNR) is evaluated across the defect for all radiograph using a line profile.
Sdev Mean Max
CNR (4)
The width of the line profile is 5 mm for all measurements and consists of the mean value of rows in the measured area. Max is the maximum value around the crack. Mean and Sdev are the mean value and the standard deviation of an area with 21 columns and 55 rows close to the crack.
3. Results
The work has been performed at Chalmers University of Technology and SQC. The initial thought was to more or less separately work through the different work pack-ages one after another. However as work proceeded the conclusion was drawn that the different topics are more dependent upon each other than what was initially un-derstood. The result is that WP 1 to 4 has been performed in parallel.
3.1. Results Work Package 1
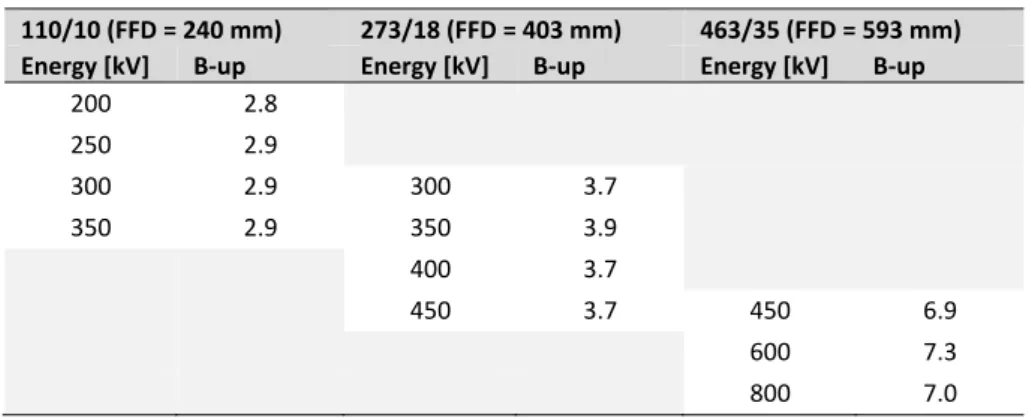
The work for WP 1 has been performed exclusively using the PENELOPE software. In Appendix 4 there is a description on how the simulations were set up. This was performed for all objects defined in table 2. Results from WP 1 are a prerequisite in order to perform WP 2 and WP 4. The results of WP 1 is shown in Table 7 below.
110/10 (FFD = 240 mm) 273/18 (FFD = 403 mm) 463/35 (FFD = 593 mm) Energy [kV] B‐up Energy [kV] B‐up Energy [kV] B‐up
200 2.8 250 2.9 300 2.9 300 3.7 350 2.9 350 3.9 400 3.7 450 3.7 450 6.9 600 7.3 800 7.0
Table 7 Built-up factors for pre-defined geometries and energies.
3.2. Results Work Package 2
The simulations in WP 2 have been conducted to investigate how the geometric un-sharpness affects the CNR. The geometric unun-sharpness are calculated for all varia-tions of focus and FFD (Table 8). The smallest (0.4 mm) and the largest (5.5 mm) focus does not correspond to the detector unsharpness. However, the geometric un-sharpness of focus sizes of 1 or 2.5 mm match the detector unun-sharpness much better as they should be about equal.
FFD th f Ug FFD th f Ug 240 10 0.4 0.04 403 18 0.4 0.03 240 10 1.0 0.09 403 18 1.0 0.07 240 10 2.5 0.23 403 18 2.5 0.19 240 10 5.5 0.50 403 18 5.5 0.41 a) b) FFD th f Ug 593 35 0.7 0.06 593 35 2.0 0.16 c)
Table 8 Unsharpness at optimum voltage a) 200 b) 350 and c) 600 kV.
The exposures in WP 2 are performed as follows:
Optimum voltage for each test block.
Fixed geometry.
Variation of focus sizes (4 ea.). x-ray film (1 ea. D5) and detectors (2 ea.).
Variation of defects (3 ea.) (20% / 40% / 60% of thickness).
Single wire mage quality indicators (EN 462).
The result is presented with CNR on the y-axis and the section area of the crack and wire cross section on the x-axis. All exposures are done with the wire image quality indicator (IQI) on the detector side. The wire IQI is tilted six degrees to the perpen-dicular axis.
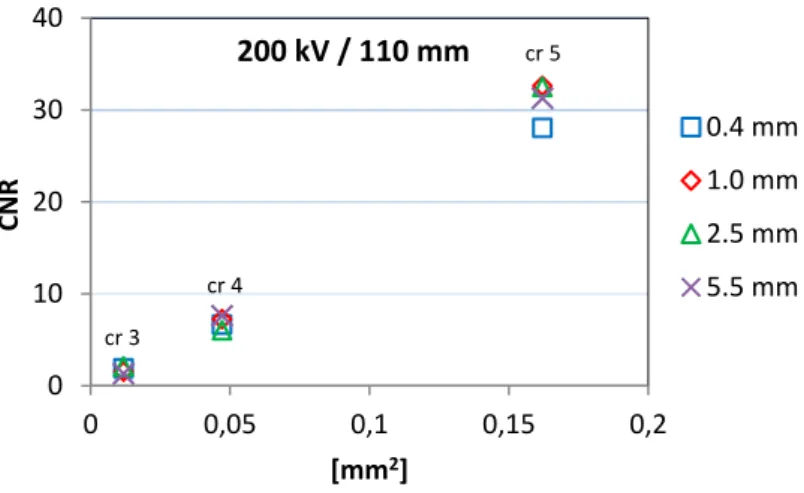
At 200 kV / 110 mm the
GE DXR 500L
show better contrast than the Vidisco(see Figure 10 and Figure 16). Industrial X-ray film has much less contrast than the digital detectors and is a worse alternative than these. Notice also that the section area of crack no. 4 and the 12:th wire are very close and give same contrast. This shows that the contrast sensitivity is dependent on the volume of the defect or IQI
wire (see Figure 10 and Figure 11).
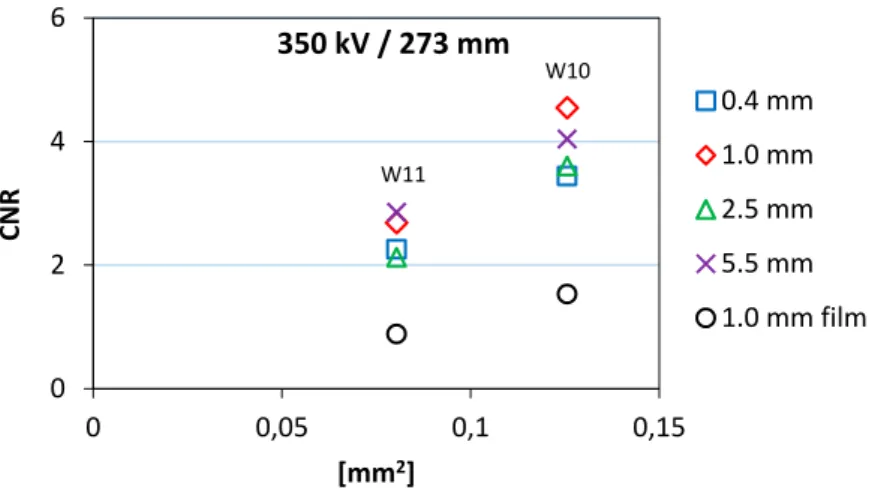
At higher energies the detectors have about similar contrast sensitivity. The differ-ence between detectors and x-ray film is less then at 200 kV but still the detectors is far much better. All result from WP 2 is presented in Figure 10 to Figure 21.
Figure 10 Diameter 110 mm at 200 kV (GE DXR 500L).
Figure 11 Diameter 110 mm with IQI at 200 kV (GE DXR 500L and film).
0 10 20 30 40 0 0,05 0,1 0,15 0,2 CNR [mm2] 200 kV / 110 mm 0.4 mm 1.0 mm 2.5 mm 5.5 mm cr 5 cr 4 cr 3 0 5 10 15 20 0 0,05 0,1 0,15 CNR [mm2] 200 kV / 110 mm 0.4 mm 1.0 mm 2.5 mm 5.5 mm 0.4 mm film W10 W11 W12 W13 W14
Figure 12 Diameter 273 mm at 350 kV and GE DXR 500L.
Figure 13 Diameter 273 mm with IQI at 350 kV (GE DXR 500L and film).
0 5 10 15 20 0 0,1 0,2 0,3 0,4 CNR [mm2] 350 kV / 273 mm 0.4 mm 1.0 mm 2.5 mm 5.5 mm cr 6 cr 5 cr 4 0 2 4 6 0 0,05 0,1 0,15 CNR [mm2] 350 kV / 273 mm 0.4 mm 1.0 mm 2.5 mm 5.5 mm 1.0 mm film W10 W11
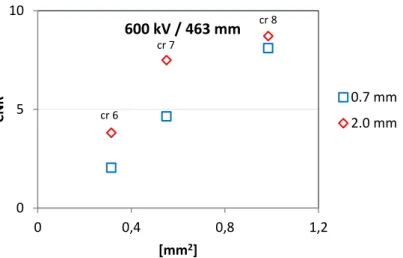
Figure 14 Diameter 463 mm at 600 kV and GE DXR 500L.
Figure 15 Diameter 463 mm with IQI at 600 kV (GE DXR 500L and film).
0 5 10 0 0,4 0,8 1,2 CNR [mm2] 600 kV / 463 mm 0.7 mm 2.0 mm cr 7 cr 6 cr 8 0 2 4 0 0,25 0,5 0,75 1 CNR [mm2] 600 kV / 463 mm 0.7 mm 2.0 mm 2.0 mm film W6 W7
Figure 16 Diameter 110 mm at 200 kV and Vidisco.
Figure 17 Diameter 110 mm with IQI at 200 kV (Vidisco and film).
0 10 20 30 0 0,05 0,1 0,15 0,2 CNR [mm2] 200 kV / 110 mm 0.4 mm 1 mm 2.5 mm 5.5 mm cr 5 cr 4 cr 3 0 5 10 15 20 0,00 0,05 0,10 0,15 CNR [mm2] 200 kV / 110 mm 0.4 mm 1.0 mm 2.5 mm 5.5 mm 0.4 mm film W10 W11 W12 W13 W14
Figure 18 Diameter 273 mm at 350 kV and Vidisco.
Figure 19 Diameter 273 mm with IQI at 350 kV (Vidisco and film).
0 5 10 15 20 0 0,1 0,2 0,3 0,4 CNR [mm2] 350 kV / 273 mm 0.4 mm 1 mm 2.5 mm 5.5 mm cr 6 cr 5 cr 4 0 2 4 6 0,00 0,05 0,10 0,15 CNR [mm2] 350 kV / 273 mm 0.4 mm 1.0 mm 2.5 mm 5.5 mm 1.0 mm film W10 W11
Figure 20 Diameter 463 mm at 600 kV and Vidisco.
Figure 21 Diameter 463 mm with IQI at 600 kV (Vidisco and film).
0 2 4 6 0 0,4 0,8 1,2 CNR [mm2] 600 kV / 463 mm 0.7 mm 2 mm cr 7 cr 6 cr 8 0 2 4 0 0,25 0,5 0,75 1 CNR [mm2] 600 kV / 463 mm 0.7 mm 2.0 mm 2.0 mm film W6 W7
3.3. Results Work Package 3
The results from WP 3 are essential for all simulations within aRTist. Because the result is needed as input parameters to define the performance of the detector. The WP 3 simulations was performed using the PENELOPE software. A more detailed description of the work is presented in Appendix 3. Two commercially available DDA has been simulated.
The values that has been simulated are:
GV/mGy (Gray value as function of registered radiation dose)
Efficiency (
mGy n SNR Efficiency _ )
The results are presented in form of tables (see Table 9 and Table 10) where also the gain is included. Consistently has GE DXR 500L higher efficiency which is due to scintillator screen of the GE DXR 500L is thicker than of the Vidisco.
110/10 mm 273/18 mm 463/36 mm kV Gain GV/mGy Eff_n Gain GV/mGy Eff_n Gain GV/mGy Eff_n
200 0.25 38900 321 250 0.5 52600 267 300 0.5 40100 226 1 60800 190 350 0.5 32200 213 1 48400 173 400 1 40100 157 450 1 34000 142 2 47700 112 600 2 32400 91 800 2 22000 75
Table 9 Simulated parameters for GE DXR 500L.
110/10 mm 273/18 mm 463/36 mm kV Gain GV/mGy Eff_n Gain GV/mGy Eff_n Gain GV/mGy Eff_n
200 0.5 54600 297 250 0.5 37000 219 300 0.5 28200 179 1 42700 146 350 0.5 22600 157 1 34000 131 400 1 28200 119 450 1 23900 108 2 33500 88 600 2 22700 71 800 2 15500 63
3.4. Results Work Package 4
Simulations with aRTist has been performed within WP 4 in order to establish the optimum source energy to be used for detection of defects within our range of ob-jects (see Table 1). The CNR was measured over defects of varying size (see Table 2). As the detector response is measured with a line profile of a certain width only the projected volume enclosed by its width is measured (typically the center of the defect). Otherwise the shape of the defect could interfere with the result. The units of the x-axis in the graphs below are given as area as it is the cross-sectional area of the crack. As X-ray is a volumetric test method the cross-sectional area multiplied by the length (line profile width) represents the volume that is measured. This results
in the unit mm3/mm which is the same as mm2.
The result shows that the 200kV is optimal for the object 110/10 (see Figure 22) and 350 kV seems to be optimal for the test object 273/18 (see Figure 23). With the 463/35 object is 600 kV more optimal than 450 and 800 kV (see Figure 24) as CNR peeks at that energy level.
Figure 25 shows the correlation between the CNR and volume for the 273/18 object. It seems to be relatively constant which is interesting when you consider the rela-tionship between what is detectable and the CNR is known. It is then possible to pre-dict the detectability of a certain crack volume.
Figure 22 Voltages for test object 110/10 mm.
0 10 20 30 40 0 0,05 0,1 0,15 0,2 CNR [mm2] 200 kV / 110 mm 200 kV 250 kV 300 kV 350 kV cr 5 cr 4 cr 3
Figure 23 Voltages for test object 273/18 mm.
Figure 24 Voltages for test object 463/35 mm.
Figure 25 CNR / volume-ratio. 0 5 10 15 20 0 0,1 0,2 0,3 0,4 CNR [mm2] 350 kV / 273 mm 300kV 350kV 400kV 450kV cr 6 cr 5 cr 4 0 3 6 9 12 0 0,4 0,8 1,2 CNR [mm2] 600 kV / 463 mm 450kV 600kV 800kV cr 7 cr 6 cr 8 0 20 40 60 80 0 0,1 0,2 0,3 0,4 CNR / V ol um e [mm2] 350 kV / 273 mm 300kV 350kV 400kV 450kV cr 6 cr 5 cr 4
3.5. Results Work Package 5
The defect information often lies within a narrow range within the pictures relatively large greyscale range.
The approach is to generate a background image by low pass filtering the original image. The method works well but gives a slightly uneven picture but one advantage is that faulty information is basically unaffected. Another advantage of this method is that it works well on images with high noise (low SNR) which often is the case at the radiography of thicker material.
To show the difficulties of a large grayscale range an object has been created con-sisting of one side of a mixed weld of carbon steel and Inconel (see Figure 26). In the vicinity of the weld at the carbon steel side a defect is placed. The defects in the WP 5 are simulated in a slightly different way as the defects in WP 1-4. To create more realistic situation and to show how difficult it is to detect and characterize cracks the width is decreased in three steps. They are also designed to include crack parameters as bending, winding and to some extent turning [2]. The thickness of the object is 25 mm and the settings are the same as the optimal kV at object 110 mm/10 mm (350 kV).
Figure 26 Schematic drawing of dissimilar metal (DM) weld with crack.
The x-ray image created has a greyscale range of about 5000 GV but the defect is very difficult to detect as the contrast is too low (see Figure 27). At a distance of about 10 mm the greyscale increases more than 4000 GV.
Figure 28 Radiograph of DM weld.
By increasing the contrast the detectability is increased but on the expense of the viewable area, which is reduced. It is virtually impossible to view the image without reducing greyscale range (see Figure 28). The viewable area is now just 1.8 mm wide but still has a greyscale range of 700 GV.
The x-ray image is background compensated with the interpolated surface (see Fig-ure 29) according to the method described in chapter 3.5 ‘Results Work Package 5’. The only difference is that the background image is an interpolated surface based on the attenuation in the transition zone in the weld.
Figure 29 Interpolated surface. 0 5 10 15 20 25 0 10 20 30 3.5 3.6 3.7 3.8 3.9 4 x 10⁴
The result of the background compensation is shown in the image below along with a line profile. The grayscale range is now reduced to 150 GV but with no or little ef-fect on the deef-fects information (see Figure 30).
Figure 30 Background compensated radiograph of DM weld.
All information in the picture is now in a greyscale range that the human eye can see, which means that the whole image can be viewed simultaneously. The image is inverted (negative), which is the same as the x-ray film as it is easier for the human eye to discern a darker defect against a lighter background. Normally the digital x-ray images are positive, i.e. defects are normally brighter against a darker back-ground.
The bright and dark vertical fields in the image are a result of the simulations. The transition in mixed weld is too sharp in the simulated object and the simulation soft-ware (aRTist) cannot measure continuously over a pixel. These effects are not pre-sent in a real situation. In reality it is normally a greater variety in the background but it does not affect the ability to detect defects. The greyscale range is the same. A number of defects (9 ea.) with different crack widths and bending are introduced into the object with dissimilar weld. The defects are turned 10 degrees in the longi-tudinal direction and are turned 5 degrees in the depth direction. All the cracks are considered as individuals because they are generated with a certain variation (based on random numbers) and gives realistic impressions (see Table 11).
It can be seen that the contrast decreases with crack widths, which is expected. The variations in the surface roughness and the various deflections are less prominent.
Lin e Pro file
D istan c e (Pixel) I n t e n s i t y 0 20 40 6 0 8 0 10 0 12 0 1 4 0 1 60 18 0 3 79 80 3 80 00 3 80 20 3 80 40 3 80 60 3 80 80 3 81 00
Bending width
[µm] minus none plus
7.5
5.0
3.75
4. Conclusions and lessons learned
The software (aRTist) simulates all kinds of x-ray equipment provided that the equipment's performance is known and that realistic input data are used. Unfortu-nately, this type of input data is normally not available as the energy levels and thicknesses simulated goes outside the detectors normal use.
For one important parameter the built-up factor (the ratio between primary and scat-tered radiation) results is only published for film radiography and is not transferable to digital detectors. New values of the built-up have been simulated with the Monte-Carlo method (WP 1) and the results show that it is object and geometry dependent but independent of the accelerating voltage (kV). This differs from film radiography where kV dependence is verified.
The detector performance, which is addressed in WP 3, has also been simulated with the Monte Carlo method since data for these energy levels and thicknesses is miss-ing. The normalized detection efficiency (efficiency_n) decreases with increasing thickness, which is expected. The conclusions are that the simulated detectors work well at low thicknesses but at higher thicknesses they are not sufficient enough. To obtain higher detection efficiency for these cases a detector with improved detection efficiency and capable of longer exposure times than the flat panel detectors been simulated, is proposed.
The simulated systems resolution has been studied in WP 2 with optimal kV from WP 4. The results show that it is not the highest resolution that provides the best contrast. Generally, it is the maximum power (lowest resolution) that gives a maxi-mum CNR. As the CNR is a measure of signal strength compared to the noise it is not a good measure of how well you see the defect, as in the characterization, only that it is visible. The conclusion is that detection should have as high power as possi-ble. But to characterize and especially when at sizing of defects, the resolution should be as optimal as possible.
In WP 4, the effects of the accelerating voltage has been studied and the conclusion is that higher voltage than traditionally has been used in film radiography provides better results with digital detectors. It however seems, that an optimal voltage exists for each geometry/thickness situation. In WP 4 the volume of the defects is com-pared to the contrast (CNR) and the result shows that the ratio between the CNR and the defect volume is constant. The conclusion is that if the performance of the sys-tem is known it should be possible to predict the CNR for a defect with a certain volume.
The large grayscale range of the digital detectors provides new opportunities but also needs new image processing tools to handle the information. In WP 5, a case with a mixed weld has been analyzed to show how a typical situation complicates the interpretation of defects that is placed in a sharp greyscale gradient. A method based on background corrections is used to show how to reduce greyscale range without defect information is adversely affected. The conclusion is that special tools and algorithms must be developed and adapted for these applications.
5. Essential / influential parameters
List of parameters which can be influential for the case of an x-ray inspection of welds.
Component:
Geometry of the component
- Discontinuities in the geometry such as sharp edges and steps affecting the detectability of defects.
Access possibilities
- Space enough for mounting and movements of the equipment.
Wall thickness of the pipe / object
- The wall thickness affects the CNR of the system and the size of the de-tectable volume.
Diameter of the pipe
- The diameter of the pipe affects the exposure geometry (see procedure pa-rameters below).
Presence of buttering (in case of dissimilar metal welds)
- Gives similar problem as discontinuities in the object.
Temperature variations
- Variations in temperature affects the detector negatively. Cooling system should be used.
Background radiation-
The background radiation gives additional noiseto the detector. The levelof the background radiation has to be known so that the degradation of the exposures can be estimated.
Defects:
Type of defect
- The type of the defects gives the expected volume and it has to be larger than the detection limit of the system.
Shape of the defect
Tilt angle of the defect
Roughness/branching of the defect- The crack parameters above give the size of a box in which the crack can be positioned. The size of the box gives the number of and the angles be-tween the exposures.
Procedure parameters:
X-ray tube voltage
X-ray tube focus size
System unsharpness
- Should be optimized (see WP 2 and WP 4).
Detector gain- and offset calibration
- The gain- and offset calibration should be done according to the manufac-turing companies instructions and for the conditions of the inspections.
Detector integration time
Detector gain setting
- These parameters has to be correct in order to use the full potential of the detector.
Detector efficiency
- The efficiency of the detector should be known for the conditions of the inspection so right type of detector is used.
Focus-to-object distance
Object-to-detector distance
- Gives the unsharpness in the image plane of the system.
Numbers of exposures
Rotation angle between exposures
- Gives the probability to detect a certain defect.
Methods for interpret the area of interest in the x-ray images
- Should be able to present the area of interest in a narrow range of grey-scales without affecting the detectability negatively. Spatial filtering should be avoided.
6. Recommendations for future activities
As a result of the investigations in WP 1 to WP 5, some recommendations are sug-gested for future activities of detectors, defects or procedures.
In this work the detector performance is simulated but it should be verified
with tests of detectors under realistic conditions. In particular, the detection efficiency and the SRb should be verified. The latter is not simulated, it has been estimated as the simulation of this parameter requires in-depth knowledge of the internal light spread in the detector scintillation screen.
The contrast of a defect in a test block should be verified. In WP 4 it is
shown that the ratio between the contrast and defect volume is constant. Rectangular slits have been used in the past but also triangular slits should be manufactured in order to obtain a realistic defect volume.
Further studies of known defects should be done. Previous studies [2] could
be re-used and supplemented with more material about defect volumes.
In order to detect a crack-like defect it has to be more or less parallel to theprimary radiation. Therefore, the number of projections and the angular range needed to detect and determine the size of a crack be investigated. Suitable methods and algorithms should be developed to examine a series of exposures simultaneously. It has been shown that it can increase the radi-ographic sensitivity by putting a series of exposures into an animation.
References
[1] COMRAD_Template_2_04_07_2014 – SQC 5000003577 v.01.
[2] Crack Characterisation for In-service Inspection Planning – An Update. Jan
Wåhle (2006).
[3] PENELOPE, a code system for Monte Carlo simulation of electron and photon
transport F. Salvat. J. M. Fernández-Varea. J. Sempau.
[4] Faddegon BA1. Asai M. Perl J. Ross C. Sempau J. Tinslay J. Salvat F. Med
Phys. 2008 Oct;35(10):4308-17.
Appendix 1 - Artificial cracks
The equation describing an ellipsoid is:
1
2 2 2 2 2 2
c
z
b
y
a
x
(5)
where
2 24
1
)
,
(
d
z
l
x
z
x
w
(6)
d = depth of the crack (z-direction) l = length of the crack (x-direction) w = width of the crack (y-direction)
A statistically based variation to add to this half ellipsoid to simulate the surface roughness. The variation is considered to be normally distributed and is randomly created in MATLAB.
The surface roughness Rz in the model is evaluated with the ‘ten point height of
ir-regularities’ methodology. The value Rz is calculated by adding the five highest
peaks and subtracting the five lowest valleys within a certain length of the crack [2]. See equation (7).
5
)
(
)
(
R
1R
2R
3R
4R
5R
6R
7R
8R
9R
10R
z
(7)
Figure 31 Graphic presentation of the Rz measurement.
The simulation of the statistic variation using Matlab function randn was performed
with the variance set to 40 µm. The resultant Rz comes out at Rz=70µm. which
cor-relates with an intergranular stress corrosion cracking crack (IGSCC) [2]. Based on this it can be assumed that we have defined a crack-like defect that is similar to an IGSCC-crack in terms of width and roughness in respect to depth. However, the model is too complex to be handled effectively and it needs to be converted into a solid body. In this process a very large number of surface elements is reduced to smaller amount by down-sampling the model.
Appendix 2 - X-ray tube
The simulation of the x-ray tube is made in two steps. First simulated the electron beam towards the anode where the results are used as input into the second simula-tion that generates the X-ray spectrum. Anode materials is tungsten and anode angle is 11 degrees. The window and the filter material is the same as the selected x-ray tubes.
The correspondence between aRTist and PENELOPE is very good with respect to the shape the spectrum. In absolute numbers is the correspondence good.
Figure 32 Spectrum simulated in PENELOPE.
Figure 33 Spectrum generated by aRTist.
0,00E+00 5,00E‐09 1,00E‐08 1,50E‐08 2,00E‐08 2,50E‐08 3,00E‐08 3,50E‐08 4,00E‐08 4,50E‐08 5,00E‐08 1 101 201 301 401
Appendix 3 – Efficiency
The SNR for the detector is defined as efficiency according to ASTM E2597 / EN 14784. Efficiency is SNR normalized to 100 µm circular aperture divided by the dose.
Efficiency = ����� ����� [SNR_n/mGy0.5] (8)
The efficiency of the detector depends on the x-ray spectrum in the detected radia-tion, which is dependent on the tube voltage and the thickness of the test object. The value of efficiency is therefore calculated for all combinations of thickness and tube voltage used in the simulations. Each simulation corresponds to 1 mGy which is: 1 mGy = 2.68·1014 [eV/cm2]
A dose of 1 mGy corresponding to about 109 photons/cm2. In order to simulate that
amount of photons first the filtered spectrum is created, which is the radiation that leaves the object and to be detected by the detector (see Table 12 below).
Tests E-mv ph/cm^2 px_100 px_142
220kV_8Cu 1.47E+05 1.82E+09 1.03E+09 2.09E+09
200kV_20Fe 1.47E+05 1.82E+09 1.03E+09 2.10E+09
250kV_20Fe 1.70E+05 1.58E+09 8.93E+08 1.81E+09
300kV_20Fe 1.91E+05 1.41E+09 7.96E+08 1.62E+09
350kV_20Fe 2.09E+05 1.28E+09 7.25E+08 1.47E+09
300kV_36Fe 2.07E+05 1.30E+09 7.33E+08 1.49E+09
350kV_36Fe 2.29E+05 1.17E+09 6.63E+08 1.35E+09
400kV_36Fe 2.49E+05 1.08E+09 6.09E+08 1.24E+09
450kV_36Fe 2.69E+05 9.95E+08 5.63E+08 1.14E+09
450kV_70Fe 3.03E+05 8.85E+08 5.01E+08 1.02E+09
600kV_70Fe 3.68E+05 7.28E+08 4.12E+08 8.37E+08
800kV_70Fe 4.51E+05 5.94E+08 3.36E+08 6.83E+08
Table 12 Mean energy and no. of photons / cm2 at 1 mGy.
The filtered spectrum is used as input in the second simulation in which a detector simulated by a volume which is divided into sub volumes corresponding to each pixel. The simulation of each photon continues until the cut-off energy (50 keV for e- and 20 keV for photons) is reached.
a) b)
Figure 34 a) GE DXR 500L and b) Vidisco.
The detector model does not take into account the internal light spread in the scintil-lator layer (see Figure 34). Because light spreading to neighboring elements, a low pass filter is designed taking into account the scintillator layer refractive index, thickness and its light conductivity. The filter is asymmetrical when the photodiode in the pixel has a non-square shape. The filtered image can then be evaluated to ob-tain a value of the efficiency.
Pixel size
[µm] Fill factor material Screen Thickness [µm] charge [eV] Saturation
100 0.5 CsI 300 1.2·107
142 0.65 Gd2O2S 200 3.4·107
Table 13 Properties of the detectors.
The properties of the detector used in the simulation is presented in Table 13. The steps to calculate the efficiency is presented below.
1. Simulate the spectrum of the primary radiation.
2. Simulate the energy deposition with the filtered spectrum. 3. Create an x-ray image ( .tif) with the simulated energy deposition. 4. Filter (to compensates for light spread and the fill factor).
5. Measure.
The measurement is done according to ASTM E2597 as follows:
����� ���������������������������������� ∙√�∙������� (9)
where dSNRn is the normalized SNR and SRb is the measured basic spatial resolu-tion. The efficiency is then the dSNRn calculated at 1 mGy.
The energy deposition in these simulations also gives the number of gray levels/dose (GV/mGy). which is one of the parameters for input into the aRTist software.
Appendix 4 - Scattered Radiation
The built-up factor is the ratio between the total amount of incident radiation and the primary radiation, added by one. The total amount of radiation consists of the pri-mary plus the scattered radiation and it is measured in the detector plane in the planned test geometry.
The primary radiation is measured by moving the amount of material radiated, in the test geometry, as close to the focus as possible. The amount of scattered radiation in this geometry is then expected to be negligible. The scattered radiation is then the difference between the primary and the total radiation.
a) b)
Figure 35 a) Concept of total radiation and b) direct radiation.
In the simulation of the built-up the object is divided into layers to achieve high ac-curacy. The accuracy increases the closer the detector layer is located. Both photons and secondary electrons are included in the simulation where each particles cut-off energy shown below. The simulations are only performed with CsI detectors as no
difference between CsI and Gd2O2S, with respect to the scattered radiation, is
Strålsäkerhetsmyndigheten Swedish Radiation Safety Authority
SE-171 16 Stockholm Tel: +46 8 799 40 00 E-mail: registrator@ssm.se
2017:32 The Swedish Radiation Safety Authority has a comprehensive responsibility to ensure that society is safe from the effects of radiation. The Authority works to achieve radiation safety in a number of areas: nuclear power, medical care as well as commercial products and services. The Authority also works to achieve protection from natural radiation and to increase the level of radiation safety internationally.
The Swedish Radiation Safety Authority works proactively and preventively to protect people and the environment from the harmful effects of radiation, now and in the future. The Authority issues regulations and supervises compliance, while also supporting research, providing training and information, and issuing advice. Often, activities involving radiation require licences issued by the Authority. The Swedish Radiation Safety Authority maintains emergency preparedness around the clock with the aim of limiting the aftermath of radiation accidents and the unintentional spreading of radioactive substances. The Authority participates in international co-operation in order to promote radiation safety and finances projects aiming to raise the level of radiation safety in certain Eastern European countries.
The Authority reports to the Ministry of the Environment and has around 300 employees with competencies in the fields of engineering, natural and behavioural sciences, law, economics and communications. We have received quality, environmental and working environment certification.