CHARACTERIZATION AND CO
INCINERATION OF WASTE IN A PAPER MILL
A CASE STUDY
Feraydoon Tamaddon
1William Hogland
1 1Lund University Lund, Sweden
2University of Kalmar- Kalmar,Sweden
ABSTRACT
A considerable amount of Plastic & Paper Waste (PPW) is accumulated in paper manufacturing and recycling mill during the pulping process, The composition of the waste shows that it is a valuable waste-fuel, however, with high moisture content. This waste is landfilled at the landfill site in the vicinity of the paper mills and has caused considerable problems in the form of leachate, In order to examine the operational and environmental effects of co-incineration of PPW with woodchips, coal and sludge, a study was undertaken at Lund University, A detailed and complete analysis and characterization of the waste was included in the study, Throughout 14 hours full-scale operation in a 40 MW circulating fluidized bed combustor (CFS), samples of gas, particulate matters, ashes and slag were taken at different parts of the incinerator. All the process data, continuous flue-gas data, the temperature and humidity were monitored throughout the test via a data acquisition system and displayed on a real-time basis,
The results of the gas analysis show some increase in PCB and PCDD/PCDF in the flue-gas compared with the normal operation (incineration of woodchips +sludge+ coal as fuel). The
3 3
values (PCB=0.053ng/m , TCDDcquiv=0.009ng/m ) are, however, still far below that of the 3
limit (0.1 ng/m ). The average of total hydrocarbons (THC) in the emission gas was found to be 35 ppm based on dry gas, which was three times higher than normal operation. Analysis of the ash shows a high concentration of soluble chlorine in comparison with normal operation (2500 ppm vs, 500 ppm) and this is due to the high concentration of chlorine in the tested fraction of PPW which is about 3 wt.%. The concentration of heavy metals in the ash and slag was found to be at the same level as normal operation.
I INTRODUCTION General
In a paper mill apart from sludge, ashes and waste from recycled paper (PPW), which is the main constitute of the solid waste, the other important fraction of solid waste are basically:
• Metal scrap and bale wires • Packaging waste
• Laboratory waste
• Office waste, restaurant waste and food residues • Pallets & wood waste
Kalmar ECO-TECH '07
KALMAR, SWEDEN, November 26-28, 2007
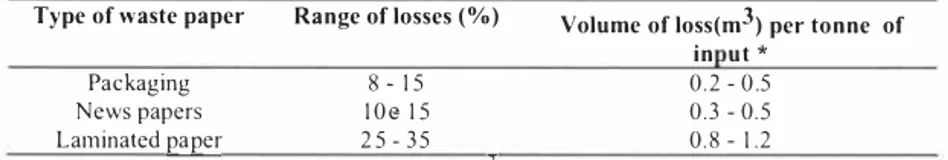
Provided post consumer waste paper is used in addition to other waste papers and not simply to replace them, increased recycling will result in lower volume of solid waste, The actual reduction is dependent on the type of waste paper being used, the paper produced and the treatment of waste and sludge from recycling processes, There is evidence that in some cases the volume of the waste produced during recycling exceeds the volume of waste paper being recycled, The following table shows some indications of the losses from recycling of waste paper which eventually comes to waste stream in a production line
Table I, Losses in recycling of wastepaper.
Type of waste paper Range of losses (%) Volume of loss(m3) per tonne of in ut *
Packaging 8 - 15 0 .2 - 0.5
News papers 10e- 15 0 .3 - 0 .5
Laminated paper 25 - 35 0 .8 - 1.2
J
* With assumption of a density of 850 kg/m for sludge,
Table I shows that when laminated papers are used to produce tissue, the actual volume of waste reduction can be negligible.
Characteristic of PPW
The use of wastepaper in paper mill industries has caused some problems including contaminated materials, which have to be separated during and after pulping in fonns of sludge and recycled plastic and paper waste (PPW), Removing of the contaminants takes place at different parts of pulping process and includes many gross heavy contaminants, plastics, metals, wood and textile, Table 2 shows composition of PPW, which is typical in a paper-recycling mill,
Table 2, Composition of PPW
Material Weight¾ (wet base)
Paper 48 Plastic 37 wood 2 textile 2 metal 6 Fine rest 5 Moisture 66
Calculated heat value
(MJ/kg),dry base 23
Incineration of PPW
One method of PPW treatment and stabilisation of paper mill sludge is incineration, which can occur by co-firing of waste with coal and woodchips or other waste stream in an incineration plant. Perfonnance of the plant is largely depended upon installations and
selection of equipment. The level of substitution achievable in the mixture of the waste is determined not only by the moisture content of the PPW and sludge, but also by the relative ash and O 2 content. However, the incinerator must be appropriate for the type of sludge and it can be travelling grate, vibrating grate, fluidized bed or circulating fluidized bed. Water removing which is essential is achieved by mechanical pressing and can be accomplished with a drying process.
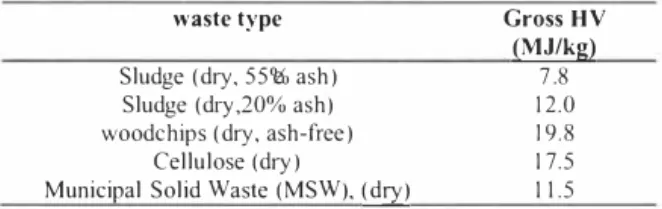
The average calorific heat values (HY) for different waste types, based on dry substances, are given in the following table. All heat values are higher than EU's waste directorate limit which is 5,2 MJ/kg.
Table 3. Typical calorific values of different waste.
waste type Gross HY
(MJ/kg)
Sludge (dry. 5 5 e% ash) 7.8 Sludge (dry,20 % ash) 12.0 woodchips (dry, ash-free) 19.8
Cellulose (dry) 17.5
Municipal Solid Waste (MSW), (dry) 11.5 TEST PROGRAM
The test program was conducted to address the effect of incineration of PPW together with other solid fuels in the combustor. At the PPW preparation area, after separation of the visible and big pieces of metals, the waste was shredded with a shredder to a size of < 70 mm, then it was weighed and mixed up with a known amount of woodchips before tipping in the pit area and feeding into the incinerator by a rubber conveyor.
Test incinerator
The incinerator selected for the test program was an Ahlstrom Circulating Fluidized Bed incinerator (CFB) with water tube wall construction. Two water drums at the top and bottom connect these tubes together. Heat transfer taking place through radiation and convection processes in different zones of incinerator. Circulation of water is taking place by means of natural convection due to differences in density of water in different areas of combustor. Steam generation is designed for a maximum continuous rating of 18 kg/s at 65 bar gauge and 450e° C (40MW) when firing coal, bark and wood chips.
Coal is transported by conveyor into a cylindrical feeding device, which is close to combustion chamber and then is fed into combustor with the help of special device and pressurized air. The fuel-burning system in the combustor is designed for resource recovery facilities burning coal alone or in combination with bark, screened residues, sludge and wastepaper. Bark, woodchips and sludge are transported with a rubber conveyor to the cornbustor and then they are fed into sand circulating channel by a scraper conveyor (drag chain). These waste-fuels are partially dried by the heat of the sands and returned ashes before reaching to the fire grate area. In order to maintain steam demand and temperature, the proportion of different fuel can be changed and adjusted due to different ca Jori fie values of solid fuels.
The flue-gas generated in the combustion chamber flow through two cyclones into the super heater area. Upon leaving the super heater, the flue-gas passes through steam generating bank and pre-heater before leaving for gas cleaning system, which consists of el-filter and scrubber.
4.9
Kalmar ECO-TECH '07 KALMAR, SWEDEN, November 26-28, 2007
Sampling and analysis
Selection and preparation of sampling location was done by an authorized analytical laboratory. Flue gas sampling and monitoring were conducted at one location downstream of incinerator, after el-filter and scrubber and in the chimney. Filter ash was collected at the base of the filter and the wall. Slag sample was collected from a tube under Fluidized bed. Samplings took place under two different intervals between 9:00 - 1 1 :30 and 12:25 - 15:00 O'clock and the parameters which have been examined were bulk gas composition, trace organics, particulate matter, mercury, PCB, PCDD and heavy metals. During the test program, all facility operating parameters were continuously monitored in the control room.
Analysis and characterization of PPW were perfonned by Lund University and Staten Provnings anstalt (SP), which is an official and governmental organization. To detern1ine the heat value of the PPW, a weighed sample was burned in an oxygen bomb calorimeter under constant volume and the calorific value was computed from temperature observations made before and after combustion. Characterization of the PPW was carried out three times and with a total mass of approximately 3 tonnes.
All the process data, continuous flue-gas data, temperature and humidity were monitored throughout the test via a data acquisition system and displayed on a real-time basis. Some relevant process data were taken and gathered from daily report at the site. The test program started at 07.00 O'clock and ended at 22.00 O'clock.
2 RESULTS AND DATA ANALYSIS Characteristics of PPW
Table 4 shows the results of the measurements and analysis in respect to the inventory of PPW. Table 4. Ultimate and proximate chemical analysis of PPW.
Parameter PPW
As received Dry substance Ash anal sis Proximate analysis: Moisture (wt.%) 66 Ash (wt.%) 3.6 9.9 Total C (wt.%) 5 0 .6 Glass/Iron (wt.%) 12.4 Calorific value: As discarded (MJ/kg) 8 .6 23.3 Effective (MJ/kg) 6 .4 21.8 Ultimate analysis: N (W¾) 0 .4
s
(W¾) 0.05 0.1 H (W¾) 6 .9 0 (W¾) 16e.8 Cl (W¾) I 2.7 Hg (ppm) 0 .1 0.1 Cd (ppm) 6 1 Pb ( 111) 6 1 766The result of measurement of the heat value of PPW is in a good agreement with the calculated value based on the inventory and characterization of PPW.
Emission gas
The experimental results from the flue-gas analysis are compared with the corresponding data of a reference test without adding PPW into the combustor (during the day before and after the test day) in Table 5. It should be mentioned that the reference values are not statistically verified as nom1al operation for the plant.
Table 5. The results of emission gas analysisfi'om the incinerator. Different component Gases: CO2 02 co NO N02 N20 NOx NH3 S0 3 SO2 (raw gas)
THC:
PCB: Dioxins: TEQ (Eadon)
" (Nord,) Elements in gas form:
s
Hg Hg (total) 4.8 3 79 ppm (dry gas), 476 (mg!m3 ) 71 95 2 4 29 5 7 72 149 Average value (09.00-22.00) O'clock, test14.8 (Vole.% dry gas)
6 0 (mg/MJ supplied energy) ND <2 (mg!m3 dry gas) 8 7 ppm (dry gas), 2 5 5 (mg/m3 ) 35 ppm (as C3 H8), 5 8 (mg/m 3) as C 0.05e3 ng!m3 0. 009 ng!m3 0.006 <4 (mg/MJ supplied energy) 0. 1 (mg!m3 dry gas) 0.2
Corresponding values (reference test)
13 .3 (Vole.% dry gas) 6 .5 146 ppm (dry gas) 184 (mg!m3 ) 9 1 12 2 2 5 26 52 93 192 9 8 <I < I <2 <2 13 0.03 9 25 3 ng/111 0.001 ng/m3 0.001 ng/1113 4.5 (mg/MJ supplied energy) 0.1 (mg!m3 dry gas) 0.2
In modem municipal waste combustors, there is a general tendency to use higher temperature and better mixing in the combustor to reduce carbon monoxide (CO) and organic emissions. However, the higher temperature and better mixing lead to higher NOx emissions and there is always a trade-off between CO and NOx emissions.
The results of analysis on the dust content of flue-gas (fly-ash) after scrubber and el-filter are presented in the Table 6. Samples were taken from chimney.
Kalmar ECO-TECH '07 KALMAR, SWEDEN, November 26-28, 2007 Table 6. Analysis of partirnlates in emissions.
Parameters Average values (test) Corresponding values for reference test
Flow of particles: 50 (g/hr) 150 (g/hr)
0.7 (mg/1113 dry gas) 2.4 (mglm3 dry gas)
"""
0.5 ( and 1.8 ( """ and 10%CO2)
Elemental 10%CO2) analysis: 142 ppm 41 ppm Hg 0.1 (mglm3 dry gas) 285 83 Pb 0.2 142 41 Cd 0.1 214 2100 Zn 1.5 857 500 Cu 0.6 857 580 Cr 0.6 285 41 Co 0.2 285 540 Ni 0.2 3285 ., 2500 Mn 2.3 714 375 As 0.5 428 83 V 0.3 57000 ,. 42000
s
0.04 (m /m3 d1 as)Some of the key findings detennined from the analysis of the test data are listed below.
The average of total hydrocarbons (THC) or CO in emission gas is the best single indicator of uncontrolled PCDD, PCDF emissions. A THC value of 35 ppm based on dry gas that is three times bigger than reference test ( 13 ppm) can confinn the higher value for TCDD equivalent in the test program. Some changes in the operating conditions such as circulating air, excess air, changing of fuel proportion etc. can improve operating condition.
When the moisture in the off-gas is increased to a level of 7 - 9%, the particulates drop to a level of about 60 mg/ml in the case of incineration of Municipal Solid Waste (MSW).
Considering the fact that in the test program feeding of PPW with a higher value of moisture content (about 60%), increase humidity in the flue-gas and consequently less amount of particles are expected (0.4 mg/ml ) compared with reference test (I. 7 mglm\
A property of the waste which is important in partitioning of the elements is halogen and in particular chlorine concentration. During combustion metals may be converted to halides which are readily soluble in water and have higher vapor pressures than the oxides or metals. Therefore a high concentration of metal chlorides like CuCl2, CdCl2, ZnCl2 etc. can be found in emissions and ashes. This phenomena was observed in the test program and the results of PPW analysis shows relatively high concentration of Cl (2. 7 Wt.%) compared with average chlorine concentration in MSW (0. 7Wt.%).
The result of THC in emissions shows poor combustion conditions. Calculations from the results of analysis on the test day and the day before show more than 98% net destruction efficiency for PPW. The net average destruction efficiency for poor combustion is usually mentioned less than 90% in the literature. The amount of THC in emissions in reference test confinns that the operating condition of incinerator can be and has to be improved.
347
Laboratory analysis has shown that TCDD-equivalents and PCB concentration in the
flue-3 3
gas (PCB = 0.053 ng/m , TCDD = 0.009 ng/m ) is some how higher compared with
3 3
reference test (PCB = 0.039 ng/m , TCDD = 0.00 I ng/m ), However, these figures are still much less than the limit was set in the environmental regulatory for these highly toxic materials.
Ash analysis
Analysis of ash and slag were conducted at Lund University and the results for the heavy metals were found to be at the same level as nom1al operation. However the soluble chlorine content in the ash was found to be five times higher than reference test Trace organic concentrations in the ash have not been measured. The range of the distribution of most trace metals appears to be a function of themrnl properties of the elements. For example higher concentration of relatively volatile trace metals such as As, Cd, Hg and Zn should be expected in filter ash than bottom ash or slag while relatively heat stable elements such as Cr, Cu and Ni are higher in bottom ash. Table 7 shows the results of analysis over ash and slag in the test program (Ash-T, Slag-T) and ash analysis in reference operation (Ash-R).
Table l Elemental analysis of ash and slag (ppm,d,y base).
Cl
s
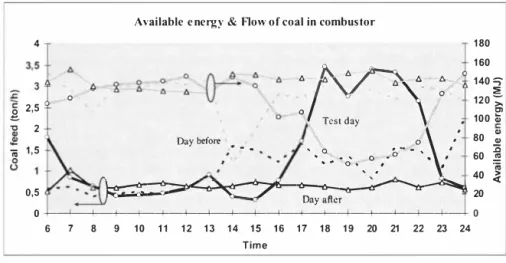
C (%) Al As Be Ca Cd Co Cr Cu Ash-T 2500 9268 1.4 114008 59 3 161473 9 156 581 Ash-R 535 8252 1,1 103725 72 3 167905 10 166 477 Slag-T 38 792 0.1 32080 15 2 53400 2 9 141 213 Fe Hg K Mg Mn Na Ni Pb Si Sr Zn Ash-T 18282 0.5 8185 22139 1347 7353 63 206 532 1506 Ash-R 16741 0.4 7529 20386 1137 6580 71 181 669 338 1360 Slag-T 25072 3442 8601 735 2097 62 64 561 126 1290 3 CONCLUSIONSIn Figure 2 the condition of the incinerator for days before and after test (reference) is compared with the day of incineration test. The variation of the total available energy and the flow rate of coal into the incinerator in different days are compared. As it can be seen the condition of combustor during the test program was stable and comparable with reference operation.
A sharp increase in coal feeding, which corresponds to decrease of available energy was observed at 15:30 O'clock because the operators tried to keep the temperature and the steam load constant. As there was no data available to us in regards to feeding and quality of the sludge into the combustor, it is difficult to interpret this instability, However, as the feed of PPW was increased at 15:00 O'Clock to about 2,25 tonnes/hr (from previous 1.65 tonnes/hr), taking into account the moisture content of PPW and the effective calorific value which is less than coal, one may expect such a disturbance, It should also be mentioned that the operating crew was changed at about 15:00 O'Clock (shift change) and this can have effect on operating condition,
�
'" "" "O � ,
Kalmar ECO-TECH ·07 KALMAR, SWEDEN, November 26-28, 2007
Available energy & Flow of coal in combustor
4
·
·
_
6
-
t�
-
6_ _ ;/ 0 2,5 o / T �• fg
Test day \; , 'C 2 # Day before. -
-
, \ 0 ' 0 # /! • ' \ I 1 , 5 ni .. ,.• .. 0 ;,; 0 .. , ' , 40 1 80 1 60 140 ', ::;; 120 ';:: Cl 100 cii 80 : :;; 60 .!!! _0,5
��:::�.c:..:,��7
is--
�-t.;:---
Day after-i!""
-"-rr
--c.
�
200 +---!---+--+---+---+--+---+---+--+---+--+--+---+--+--+---+---+---+ 0
6 7 8 9 1 0 1 1 1 2 1 3 1 4 1 5 1 6 1 7 1 8 1 9 20 21 22 23 24 Time
, ·;;;
• * ,1 day after, O test day,e---- day before
Figure 2. Diagram over variation of energy and coal.flow ratee* *
The following table allows comparison to be drawn between different standard limits of
pollutants in emissions to air from incineration plants in different EU countries
Table 8. Limits/or pollutants in emissionsfi'0/11 incinerators.
Pollutant Germany Holland France EU Sweden
(mwm3) Gases:
co
50 50 0. 1 % 1 00 1 00 sO2 50 40 300 NO2 HCI HF C/THC Paiiiculate 200 1 0 I 1 0 1 0 70 1 0 I 1 0 5 1 00 1 0 (in ppm) 5 50 2 20 30 50 2 30 Metals: Cd + Hg 0.2 0.05 OJ 0.2 0.2As+Co+Ni+Se I (As) I ( Ni+As) I (Ni+As)
Pb+Cr+Cu+Zn 5 5 5
Dioxins: (ng/m3 )
Acc. Eadon 0. 1 0. 1 0. 1
Adjusted for 1 1 % 02 1 1 % 02 7% CO2 ! ! % CO2 1 1 % 02
3 The average carbon monoxide level can rate the operational condition of combustor during the run. A carbon monoxide concentration less than 200 ppm is usually rated as good, while between 200 and 400 ppm is poor and above 400 ppm is considered as very poor.
The results in table 5 show relatively poor condition for both of reference operation and test program. In both cases, high CO content in the flue-gas corresponds to low NOx emissions and shows a poor mixing and combustion. Very low concentration of trace organics was observed under the test program. The results of gas analysis show some increase in PCB and TCDD in the flue-gas, however, the level is sti ll far below that of limit (0. 1 ng/m ). Concentration of soluble chlorine in the ash and THC content in the emissions were found to be 2500 and 35 ppm respectively, which is relatively high. The over all perfomiance of the incinerator indicates that incineration of PPW together with coal and wood chips can be an effective disposal option, both economically and envieronmentally, although the concentration of chlorine was found to be slightly high. There is room for improvement of the combustion condition by changing and optimising of operating parameters.
REFERENCES
I. Bulow, C. and Krni, B.H., ( 1990) The economic treatment of effluents in a papem,il in recycling paper, Tappi Press, Vol. I, pp 254-2 7 1 .
2. F. Mark, ( 1994 ), "Energy Recovery through Co-Combustion of Mixed Plastic Waste and Municipal Solids Waste", APME Report, June.
3. Lacy, M. and Cawein, D. ( 1993) Contaminant control at Arkansas kraft, Prag.Paper
Recycling, 4(2), 8 1.
4. Cains, P. et al, ( 1994), Chlorinated Dibenzodioxin and Dibenzofuran Emissions from Waste Combustion Plants in U K, Chemosphcre, Vol. 28, 12.
5. RVF (The Swedish Association of Waste Management), 2002, Svensk avfallshantering (Swedish Waste Management 2002). Malmo, Sweden.
6. SNV, ( I 99 1 ), Kommunal avfallsplancring enligt renhallningslagen, All manna Rad 91:I, Naturvardsverket, Stochholm, Sweden.
7. Spliethoff H, Scheurer W, Hein KRG, 1999. E ffect of co-combustion of sewage sludge and biomass on emissions and heavy metals behavior. Second International Symposium on Incineration and Flue Gas Treatment Technologies, University of Sheffield, UK.
8. Stora Hylle AB, ( 1998), Miljorapport
9. Manninen, H. et al, ( 1993), Organic Emissions from Co-Combustion of Mixed Plastics with Coal in a Bubbling Fluidized Bed Boiler, Chemosphere, Vol .27, No. 1 -3.
I 0. Midwest Research Institute, ( 1987) Results of the Combustion and Emissions Research Project at the Vicon Incinerator Facility in Pittsfield, Massachusetts.
1 1. RVF, Rapport 2, ( 1996) Svenska Renhallningsverks foreningen Malmo.
12. Ruuskanen, J .T. et al, ( 1994), Fom,ation of Polychlorinated Dibenzo-P-Dioxins and Diobenzofurans in Co-Combustion of Mixed Plastics with Coal ; Exploratory Principal Component Analysis, Chemospherc, Vol.28, No. I I.
13. Directive 2000/76/EC of the European Parliament and of the Council of 4 December
Kalmar ECO-TECH '07 KALMAR, SWEDEN. N ovember 26-28. 2007
14. Wagner, J. and Green, A., (1993) Correlation of chlorinated Organic Compound Emissions from incineration with Chlorinated Organic Input. Chemosphere, YoL 26. No. I I.