DOI: https://doi.org/10.15626/Eco-Tech.2012.012
SEASONAL CHANGES OF MUNICIPAL WASTE
GENERATION AND CONTENT: CASE STUDY
FOR KAUNAS CITY, LITHUANIA
Gintaras Denafas
1*Lina Vitkauskaitė
1Dainius Martuzevičius
1Andrius Kavaliauskas
2Dalius Tumynas
2Christian Ludwig
3,41
Department of Environmental Engineering, Kaunas University of Technology,
Kaunas, Lithuania
2
JSC “Kauno švara”, Statybininkų g. 3, 50124, Kaunas, Lithuania
3School of Architecture, Civil and Environmental Engineering
(ENAC-IIE),École Polytechnique Fédérale de Lausanne (EPFL),Lausanne, Switzerland
4
General Energy Research Department,
Paul Scherrer Institute , Villigen PSI,
Switzerland
ABSTRACTS
The scientific objective of this study is to develope a methodology for the investigation of municipal solid waste (MSW) composition in Lithuania. Investigations have been performed in Kaunas, which is the second large city of Lithuania. The obtained results are a contribution to assess, evaluate, and predict possible development scenarios of the municipal waste management sector in east European countries. Possible scenarios consider improved separate collection systems in combination with landfilling, mechanical-biological treatment and/or incineration. Further the results provide scientific knowledge which is necessary to understand waste generation and composition. This information is crutial to avoid future emissions to the environment resulting from current waste treatment practice. A further aim is to better understand the interplay of natural, social and economic factors influencing the quality and quantity of MSW in Eastern Europe. In this paper we present the preliminary results of consecutive MSW analysis at the waste collection and transfer station in Kaunas City over a period of two years.
KEYWORDS
1 INTRODUCTION
The composition of municipal solid waste (MSW) is a result of regional and cultural aspects as well as social behavior, and it is strongly influenced by economic factors [Chang et al., 2011]. In Eastern Europe including new EU countries there is currently a lack of well developed separate collection systems for recyclable materials. It is urgent to obtain more information about the waste composition in order to establish adequate collection systems. Random sorting actions do not provide sufficient information because of strong seasonal fluctuations in MSW composition. The seasonal changes in composition may strongly influence the quality of the recyclable and residual wastes, which in turn affects emissions from landfills and/or the quality of incineration residues.
Today, little is known about the waste composition and flows in Eastern Europe [Batinic, 2011]. Seasonal changes in common MSW generation [Gidarakos, 2006; Rimaityte, 2012] and MSW caloricity and moisture content [Wang, 2011] have been already investigated, however many random sorting actions in some regions of different European countries like Greece [Koufodimos, 2002; Gidarakos, 2006], Russia [Negulyaeva, 2005], Ukraine [Sustainable, 2007; Study, 2008], Estonia [Moora, 2008], Poland [den Boer, 2010] do not provide sufficient information about seasonal fluctuations in the MSW composition – it was established only for each time of year. Also the factors causing these seasonal changes are little known yet. Seasonal analysis of municipal solid waste composition was performed from February 2009 until December 2010 in the second large Lithuanian city Kaunas (average number of inhabitants – 343,69 thousands and average annual GDP – 8339 EUR per capita for 2010).
2 METHODS
2.1 Determination of MSW composition in the selected samples
For the investigations the Kaunas MSW transfer station was chosen. It is operated by JSC “Kauno švara”. Waste analysis was performed according to Standard Test Methods for Determination of the MSW (LST CEN/ISO 14780 „Solid biofuels - Method for sample preparation“; ASTM D 5231 – 92 „Standard Test Method for Determination of the Composition of Unprocessed MSW“; ASTM D 4687 – 95 „Standard Guide for General Planning of Waste Sampling”). Analysis in 2010 was adjusted and improved according to the experience obtained in the first year (2009). This research methodology for obtaining of MSW composition data was further adapted and used successfully by other partners in Russia, Ukraine and Georgia in the joint international project “Seasonality of Municipal Waste Generation and Composition and Corresponding Fluctuations of Various Environmental Indicators for Waste Management and Treatment Facilities” which is supported by Swiss National Scientific Foundation.
Figure 1: Selected Šilainiai and Žaliakalnis catchment areas for investigation (Kaunas, Lithuania)
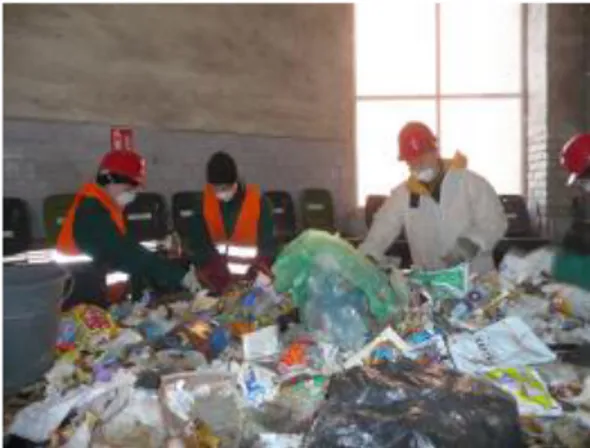
Determination of MSW composition was carried out as follows: The content of mixed municipal solid waste (MMSW) in containers from private individual houses (6 bins of 0.75 m3, Žaliakalnis catchment area) and from block – houses (4 bins of 1.1 m3, Šilainiai catchment area) have been investigated monthly during above mentioned period (Figure 1). Also the content of additional three containers of separately collected paper & cardboard, glass, and plastic & metal have been analyzed. Content of container was spread on a table and sorted into 10 fractions and sub-fractions (Figure 2):
- paper (mixed paper, office paper, newspaper, glossy paper, cardboard); - plastics (PET, PE, films, other plastics), combined packages (tetra-packs); - food waste;
- yard waste; - wood;
- other organics/burnable;
- ferrous metals (packages, other ferrous metals);
- ferrous metals (packages of aluminum, aluminum foil, other aluminum wastes, other non-ferrous metals);
- glass (clear, brown, green, blue, mixed glass cullet); - other inorganic/non-burnable and hazardous.
The amount of each fraction then was weighed.
2.2 Calculations of MSW composition in the common MSW flow
The factual generalized MSW monthly content (C) of every fraction (i) has been calculated by formula: YARD MET PLAST GLAS PAPER MMSW C YARD C MET PLAST C GLAS C PAPER C MMSW
Cicommon iMMSW iPAPER iGLAS iPLAST MET iYARD
_ * * _ * * * _ (1) INHAB C BLOCK INHAB C IND INHAB
CiMMSW iMMSW IND iMMSW BLOCK
_ _ _ * * _ (2)
Where MMSW – statistical data about monthly collected mixed solid waste amounts, obtained from JSC “Kauno švara“; PAPER, GLAS, PLAST_MET, YARD – statistical data about monthly amounts of separate collected fractions, obtained from JSC “Kauno švara“;
Cicommon – determined fractions content in common MSW flow including mixed municipal solid waste and separately collected fractions; CiMMSW, CiPAPER, CiGLAS, CiPLAST_MET – determined fractions content in analyzed MMSW or separately collected fractions (paper, glas, plastics and metals, yard waste), respectively; INHAB_IND and INHAB_BLOCK – numbers of inhabitants in individual and block houses, respectively; INHAB – total inhabitant number in Kaunas city. However the shares of MSW to be separate collected and recycled are yet very low – don’t exceed 5%. Therefore only the results of morphological analysis for of mixed MSW would be fairly for seasonal characterisation of MSW composition.
2.3 Calculations of MSW content in the case of possible treatment scenarios
The seasonal changes of MSW treatment residues were calculated for two possible treatment scenarios. The first scenario corresponds with requirements of the Lithuanian National Strategic Waste Management Plan (LNSWMP) and recommendations of the European Commission. Therefore this scenario is expected to be realized in the nearest future. In this case 60 % of paper (including cardboard), 22,5 % of plastics, 50 % of metals, 60 % of glass, 22 % of food waste, 100 % of yard waste, 0 % of other burnable with wood, 0 % of other non-burnable and 100 % of hazardous waste would be collected separately and recycled. The remaining amounts of MSW fractions in this case are calculated as given in Eq. 3:
), 100 1 ( q MSW Ci i (3) Where:
Ci – remaining amount of the MSW fraction (t), MSWi - amount of generalized MSW fraction before treatment, q – planed sorting rate (%). The second scenario is mechanical – biological MSW treatment (MBT) of separate collection residues. After mechanical step MSW are separated into high calorific (HCF) and low calorific (LCF) fractions. Feasible outputs and contents of these fractions are calculated by [Deliverable, 2003].
2.4 Simulation of MSW caloricity and energetic potential
For currently situation and for above mentioned two possible MSW treatment scenarios the calorific values of remaining residues have been calculated. The calorific value is calculated according to the composition of waste by fractions and the calorific value of these fractions.
The calorific value of fractions in MJ/kg is calculated according to the chemical composition [Cerbe at all, 1994]:
HU = 0,34·C + 1,016·H + 0,063·N + 0,191·S – 0,098·O – 0,025W (6) where:
HU – calorific value of waste, MJ/kg; C – carbon amount, wt%, H – hydrogen amount % , according to the mass; N – nitrogen amount %, according to the mass; O – oxygen amount %, according to the mass; W – moisture amount %, according to the mass. When calculating calorific value of the waste, the chemical composition of its fractions is first re-calculated according to the total mass. For instance, the following formula is used to calculate carbon amount in the total waste mass:
C = CODM·ODMDM·DM/10000, (7)
Where: CODM – carbon amount in the dry part of organic waste, %; ODMDM – amount of organic dry waste part in dry waste part, %; DM – dry part of waste fraction, %.
The dry part of waste fraction is determined as follows:
DM = 100 – W (8)
W is calculated according to formulas 1-3. The calorific value of incinerated waste is
calculated as follows:
i i U i U m H m H , (9)where HUi – calorific value of i-fraction of waste, mi – share of waste fraction in the total stream of incinerated waste. The analogical formula could be used for calculation of MSW moisture. ODM and its chemical compositions for MSW fractions have been found in sources like Dehoust at all, 2002; Deliverable, 2003 (Table 1).
MSW fractions ODM, %DM C, %ODM H, %ODM O, %ODM N, %ODM S, %ODM
Paper and cardboard 87,00 48,60 6,40 44,30 0,20 0,20
Plastics 91,83 77,71 11,98 10,99 0,62 0,10
Metals 0,00 0,00 6,30 44,20 0,50 0,10
Glas 0,00 0,00 10,00 40,00 3,00 0,00
Kitchen and garden
waste 87,00 50,70 6,20 43,70 0,50 0,10
Other burnable 81,53 50,46 7,48 33,31 1,46 0,17
Other unburnable 0,00 48,20 6,30 44,20 0,50 0,10
Table 1: ODM and its chemical compositions for MSW fractions [Dehoust at all, 2002; Deliverable, 2003]
3 RESULTS AND DISCUSSION
3.1 Seasonal changes of total amount of MSW in Kaunas
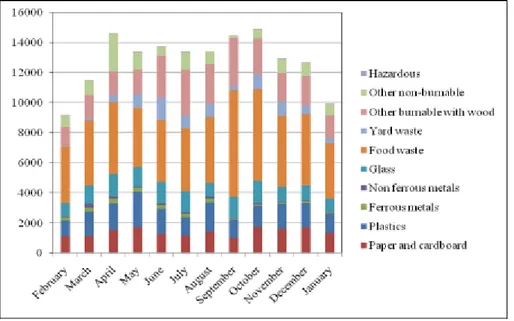
The municipal solid waste amount and fractions obtained form monthly investigations are shown in Fig. 3. and Fig. 4. These graphs show nicely the seasonal changes which are especially visible for organic fractions: burnable waste (e.g. wood), garden and food waste. The amount of other burnable waste increases in summer and autumn, amount of garden waste – in spring and summer, food waste – in the beginning of autumn.
Figure 3: Actual seasonal changes of MSW composition in 2009, t, Kaunas, LT
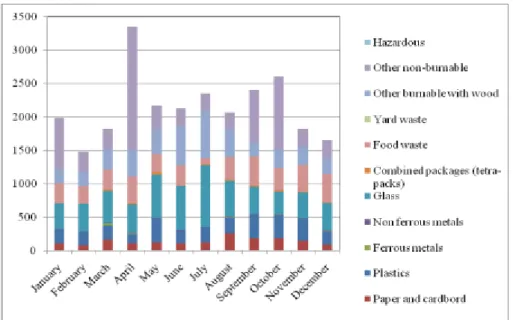
3.2 Feasible seasonal changes of MSW after sorting by requirements of LNSWMP
The assessment of requirements and recommendations shows that amounts of landfilled MSW should decrease. Hazardous and yard waste do not fall into the landfill. These results show that these fractions are undergoing strong seasonal fluctuations.
Figure 5: Feasible seasonal changes of MSW composition by LNSWMP in 2009, t, Kaunas, LT
Figure 6: Feasible seasonal changes of MSW composition by LNSWMP in 2010, t, Kaunas,
3.3 Feasible seasonal changes of MSW after MBT 3.3.1 High calorific fraction (HCF)
In the prepared HCF significantly decreases the amount of metal and glass waste. Hazardous and yard waste do not fall into this fraction. The other burnable waste fraction is the first in terms of volume of all HCF. The second is plastics. Therefore, waste with high calorific value is dominating in this fraction, so it could be successfully used for thermal treatment (e.g. incineration).
Figure 7: Feasible seasonal changes of HCF composition in 2009, t, Kaunas, LT
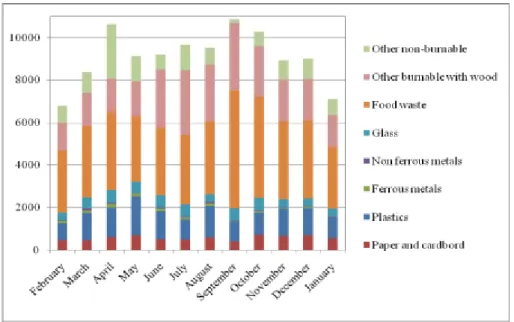
3.3.2 Low calorific fraction (LCF)
From the charts we can see that for the landfilled waste after MBT also remains a seasonal factor. In this case, the biggest part of all waste takes up the other non-burnable and glass waste. Also it can be seen the greater quantities of plastics, non ferrous metals and hard-biodegradable bio-waste. The amount of other burnable waste with wood increases significantly in April and decreases in September. The flows of Bio-waste, paper and cardboard and plastics are sufficiently even.
Figure 9: Feasible seasonal changes of LCF composition after aerobic treatment in 2009, t, Kaunas, LT
Figure 10: Feasible seasonal changes of LCF composition after anaerobic treatment in 2009, t, Kaunas, LT
Figure 11: Feasible seasonal changes of LCF after aerobic treatment in 2010 t, Kaunas, LT
Figure 12: Feasible seasonal changes of LCF after anaerobic treatment in 2010, t, Kaunas, LT
3.4 Comparison of calorific values
The calorific value is a key factor describing the suitability of MSW for incineration. The comparison shows that calorific value of HCF, which is obtained after mechanical treatment of MSW, is higher than of MSW without any treatment and after sorting according to LNSWMP. The highest calorific value is noticeable from May until August, the lowest – is found in the rainfall period. The calorific value of HCF strongly depends on the amount of plastic.
Figure 13: Comparison of MSW and HCF calorific value, Kaunas, LT.
4 CONCLUSIONS
The seasonal changes for MSW amount and content have been investigated in Kaunas city (Lithuania). These seasonal variations are evident and could significantly impact the further development and functioning of the MSW management infrastructure including separate collection, mechanical biological treatment, and incineration. The highest MSW generation is characteristic for April. Transparent seasonal changes are especially visible for other burnable waste (with wood), garden and food waste. The content of garden waste increases in spring and summer, content of food waste – at the beginning of autumn, content of other burnable waste - in summer and autumn. Significant increase of separate collection and implementation of MBT facilities are expected in the near future in Kaunas. Such new practice has to consider the seasonal changes in order to adapt stockage and treatment facilities for the appropriate further treatment of remaining residues such as organic wastes or contaminated not well defined waste fractions.
5 ACKNOWLEDGEMENT
The authors wish to thank the Swiss National Scientific Foundation (project IZ73Z0_128178/1), for their valuable support of the research.
6 REFERENCES
[1] Batinic, B., Vukomirovic, S., Vujic, G., Stanisavljevic, N., Ubavin, D. and Vukomirovic, G.: Using ANN model to determine future waste characteristics in oder to achieve specific waste management targets – case study of Serbia. – Journal of Scientific & Industrial Research, Vol. 70, July 2011, pp. 513-518.
[2] Cerbe & Hoffmann (1994) Einführung in die Thermodynamic; 10 Auflage, Hansen Verlag, München
[3] Chang, N-B., Pires, A. and Martinho, G. (2011): Empowering Systems Anglysis for Solid Waste Management: Challenges, Trends, and Perspectives, Critical Reviews in Environmental Science and Technology, 41:16, 1449-1530
[4] Dehoust, G., Gebhardt, P. and Gärtner, S. (2002) der Beitrag der thermischen. Abfallbehandlung zu Klimaschutz, Luftreinhaltung und Ressourcenschonung; in Öko-Institut e.V, Darmstadt
[5] Deliverable Report on D2.1: Draft Waste Generation Prognostic Model (Work package 2). The Use of Life Cycle Assessment Tools for the Development of Integrated Waste
Management Strategies for Cities and Regions with Rapid Growing Economies. LCA-IWM. – Vienna, 30.11.2003.
[6] Denafas, G., Zavarauskas, K., Martuzevičius, D., Vitkauskaitė, L., Ludwig, Ch., Hoffman, M., Shmarin, S., Mykhaylenko, V., Chusov, A., Romanov, M., Negulyaeva, E., Lednova, Y., Turkadze, Ts., Bochoidze, I., Butskhrikidze, B., Karagiannidis, A., Antonopoulos, J., Kriipsalu, M. and Horttanainen, M.: Seasonal Aspects of Municipal Solid Waste Generation and Composition in East-European Countries with Respect to Waste Management System Development. - Proceedings Venice 2010, Third International Symposium on Energy from Biomass and Waste. Venice, Italy; 8-11 November 2010
[7] Den Boer, E., Jędrczak, A., Kowalsky, Z., Kulczycka, J., Szpadt, R. (2010): A review of municipal solid waste composition and quantities in Poland. Waste management 30 (2010), p. 369-377.
[8] Gidarakos, E., Havas, G., Ntzamilis, P. (2006): Municipal solid waste composition determination supporting the integrated solid waste management system in the island of Crete, Waste Management 26 (2006), p 668–679
[9] Koufodimos, G., Samaras, Z. Waste management options in southern Europe using field and experimental data. Waste Mangement 22 (2002) 47-59, 2002.
[10] Moora H., 2008. Analysis of composition and amount of municipal solid waste in Estonia. SEI-Tallinn. Contract 18-20/583
[11] Negulyaeva E., Chusov, A.N. et al. Technical Report of LIFE02 TCY/ROS/039 project : Development of the Environmental Action Plan for Municipal Solid Waste Management in St. Petersburg MS WASTE in SPb: SPbSPU, 2005. – 250 p
[12] Rimaityte I., Ruzgas T., Denafas G., Racys V., Martuzevicius, D Application and evaluation of forecasting methods for municipal solid waste generation in an eastern-European city // Waste Management & Research (APR 2011)
[13] Study of MSW Quality Parameters at Kyiv and Rivne Cities. Scientific and Technical Report. - Sci. Research Institute of Urban Management, Kyiv, 2008 (Дослідження якісних характеристик ТПВ м. Києва і Рівне. Науково-технічнo звіт (2008), виконано НИКТИ ГХ м. Києва.)
[14] Sustainable consumption and production in South East Europe and Eastern Europe, Caucasus and Central Asia - Joint UNEP-EEA report on the opportunities and lessons learned. EEA Report No 3/2007, 2007. Available at: http://reports.eea.europa.eu/eea_report_2007_3/en
[15] Wang, H., Nie, Y. Municipal Solid Waste Characteristics and Management in China (2001): Journal of the Air & Waste Management Association, 51:2, 250-263
![Table 1: ODM and its chemical compositions for MSW fractions [Dehoust at all, 2002; Deliverable, 2003]](https://thumb-eu.123doks.com/thumbv2/5dokorg/3685962.45541/5.892.110.751.786.1002/table-odm-chemical-compositions-msw-fractions-dehoust-deliverable.webp)