ELIMINATION OF GREENHOUSE GAS EMISSION
DUE TO IMPROVEMENT OF BIODEGRADABLE
WASTE MANAGEMENT SYSTEM
Ruta Bendere
1*Inara Teibe
2Dace Arina
3Janis Lapsa
4 1;3Waste Management Association of Latvia, Latvia
2
University of Latvia, Latvia
4
Riga Technical University, Latvia
*Corresponding author: bendere@edi.lv
Abstract
In order to reduce the emissions of greenhouse gasses (GHG) from landfills, European Union (EU) Landfill Directive 1999/31/EC requires a progressive reduction of the municipal biodegradable waste disposal. The main problem of the waste management system in Latvia is a heavy dependence from the waste disposal at landfills. An insufficient separate waste collection system and a promotion of the landfilling as a major treatment option, leaded to the disposal of 84% of the total collected municipal waste in 2012 with a high share of the biodegradable waste. Therefore, in Latvia, the volume of emissions due to the activities of the waste management branch was 5.23% (632.6 CO2 eq.) of the total GHG emissions produced
in the national economy in 2010 (12 097 Gg CO2 eq., except the land use, land-use change
and forestry). The aim of this research is to revise the current situation of the management of biodegradable waste in Latvia, and to propose the future activities for the practical improvements dealing with biodegradable waste. The Waste Management Planning System (WAMPS) software has been used as an environmental impact analysis tool for the modelling waste management scenarios. The WAMPS software calculates emissions, energy and turnover of waste streams for processes within the waste management system, e.g., waste collection and transportation, composting, anaerobic digestion, and final disposal – landfilling or incineration. The obtained results are presented in four environmental impact categories: acidification, global warming, eutrophication and photo-oxidant formation, which are characterised by a certain emission. It covers an integrated waste management system starting with the activities where products become waste and have been put into the waste bin at waste generation source to the last point, where the waste becomes either useful material (recycled material, biogas or compost) or becomes part of emissions in the environment after its final disposal at landfill or incineration plant.
KEYWORDS
Biodegradable waste, Mathematic modelling, Waste management https://doi.org/10.15626/Eco-Tech.2014.047
1. INTRODUCTION
The aim of this paper is to find improvements of waste management system in Latvia, in order to reduce disposal of biodegradable waste and to eliminate GHG generation at landfills.
As one of the main problems indicated is that of strong dependence of the Latvian solid waste management (SWM) system on the landfills, which, in turn, entails a number of other problems: a large amount of the disposed waste; not fulfilled targets as to decreasing the disposal of biodegradable waste; as yet a high proportion of biodegradable waste in the total disposed municipal waste; and a low proportion of the recycled household waste (BiPRO, 2012). Also, the non-optimal organisation and performance of the SWM system has given rise to unjustifiably large amounts of GHG emissions, and, consequently, to global environmental impact (Eurostat, 2012; UNFCCC, 2012).
The total yearly production of bio-waste in the EU amounts to 118 to 138 Mt of which around 88 Mt originate from municipal waste and between 30 to 50 Mt from industrial sources such as food processing, and on average, 40% of EU bio-waste is still landfilled in 2010, but up to 100% in some Members States (BIO Intelligence, 2011; JRC, 2014). The average structure of deposited waste material at the landfills in Latvia has been estimated in a research project, The Assessments of Dissolved Organic Carbon Parameters in the Landfill
Waste Material (2011). The estimated results show that a lot of waste material in general has
been disposed at landfills. According the provided measurement the content of disposed waste contains - bio-waste from 50.3 % to 51.7%; plastic 10.3% - 11.8 %; paper / cardboard 5.7% - 8 %, glass 10.9% - 19 %, textile, rubber and leather 3% - 8.6 %; and metal 2% - 4.6% (Virsma, 2011).
The EC investigations show that the main food waste producers are households – 42% and food manufacturing industry – 39%, but the third bigger producer are named food service and catering sector – 14% (BIO Intelligence, 2011). The main municipal biodegradable waste streams that generate bio-waste related to European Waste Codes (EWC) are listed as follow:
1) Kitchen and canteen waste (food waste) (20 01 08 EWC code); 2) Garden and park waste (20 02 01 EWC code);
3) Mixed municipal waste (20 03 01 EWC code);
4) Waste from public market (20 03 02 EWC code) which includes biodegradable materials equivalent to codes 20 01 08 EWC and 20 02 01 EWC.
2. STATISTIC DATA ON COLLECTION OF THE MAIN MUNICIPAL BIODEGRADABLE WASTE STREAM
Officially obtained statistic data on collection of the main municipal biodegradable waste streams in Latvia, mentioned before, are shown in Table 1 (LEGMC, 2014)
Main municipal bio-waste streams and their treatment in Latvia, 2005 -2013, Table 1
Food waste (20 01 08 EWC code) Garden and park waste (20 02 01 EWC code)
Produced Collected Recycled Landfilled Produced Collected Recycled Landfilled
2005 28 - - 85 - - - 12 604 2006 91 50 - 50 - 13 010 4131 17 695 2007 93 94 - 94 1926 14 666 7 562 7 446 2008 38 50 - 50 935 15 526 7 763 7 544 2009 33 11 - 11 1 156 5 127 3 169 11 654 2010 44 - - - 996 5 348 4 139 8 257 2011 32 888 - - 4 126 20 818 10 508 1 799 2012 5 090 36 10 - 2 381 35 857 13 180 1 320 2013 54 33 11 - 27 818 29 874 48 808 1 702
Mixed municipal waste (20 03 01 EWC code)
Waste from public market (20 03 02 EWC code)
Produced Collected Recycled Landfilled Produced Collected Recycled Landfilled
2005 539 614 - 3 246 539 614 363 - - 363 2006 138 563 884 691 99 752 586 829 - 546 - 376 2007 160 891 745 787 42 015 710 997 - 235 - 297 2008 152 254 670 448 39 698 627 142 - 600 - 2 2009 148 602 533 865 5 594 217 - 647 - - 2010 138 173 512 987 5 568 517 - 654 - - 2011 162 675 412 157 10 828 509 751 - 593 - - 2012 108 340 495 959 35 388 502 206 - - - - 2013 100 899 510 109 56 469 503 733 - - - -
The represented data show great discrepancy between different waste streams and the treatment methods. Interpretation of statistic data is characterized by a peculiarity that produced waste amount consist only from reports given by facilities and institutions, and do not include produced waste in households listed in the amount of collected waste. The reports of official data base show, that food waste (20 01 08 EWC code) management is not stated as obligatory demand in practice in the country, and a legal possibility to interpret waste codes allows to treat food waste as mixed municipal waste. Nevertheless, significant improvements have been observed for green waste (20 02 01 EWC code) management - a total recycled amount grows to 48 808 tonnes in 2013, as treatment method mainly is used open windrow composting. Majority of mixed municipal waste (20 03 01 EWC code) is recycled in MBT at landfills. Starting with the year 2009 when the demands how to handle waste from catering were stated this stream in Latvia municipal waste data bases was disappearing.
3. BIO-WASTE TREATMENT OPTIONS
In order to elaborate the National Waste Management (WM) system for the first WM planning stage (2006-2012), the Latvian territory was divided into ten WM planning regions, in each of them one landfill for solid waste disposal being organised in compliance with the
EU sanitary requirements. Mainly it was chosen as a low-cost option for final solid waste disposal compared to waste incineration due to a low inhabitant density at territory. Landfilling, also, allows for disposal all materials in the solid waste stream, for any WM system and technology processes (Mc Dougall, et al., 2003; Tchobanoglous, et al., 1993). Presented data in Table 2 show a WM performance of each WM planning region. Overall, 583 069 tonnes of municipal waste have been collected in 2013; in this total amount excluded waste amounts from class septic tank sludge (20 03 04 EWC code), waste from sewage cleaning (20 03 06 EWC code), bulky waste (20 03 07 EWC code), and has been made correction in metal (20 01 40 EWC code), where was included amount not corresponding to produced household waste.
According to the statistical data, a large discrepancy is observed between collected and disposed waste amount within regions, and it indicates that waste from industry have been treated as municipal waste, also significant diversion of recycled waste material is noted among regions. As it is shown by the table 2, collected mixed municipal waste was 219 kg per capita; recycled 30 kg per capita, and landfilled – 185 kg per capita.
Municipal waste treatment by MWP regions in 2013, Table 2
WMP region Number of inhabitants (on 2013) Collected mixed MW kg capita-1 Recycled kg capita-1 Landfilled kg capita-1 Austrumlatgale 94 257 3 419 36 400 4 16 792 178 Dienvidlatgale 179 336 47 789 266 470 3 52 830 295 Liepāja 147 274 38 522 262 558 4 31 743 216 Maliena 70 349 5 737 82 1 529 22 7 715 110 Piejūra 138 959 62 725 451 4 429 32 28 821 207 Pierīga 883 228 249 799 283 35 664 40 300 266 340 Ventspils 75 421 19 393 257 733 10 7 255 96 Vidusdaugava 114 723 14 588 127 584 5 18 418 161 Zemgale 161 784 38 313 237 2 405 15 27 735 171 Ziemeļvidzeme 158 494 29 823 188 26 190 165 12 158 77 Total / average 2 023 825 510 106 219 72 962 30 503 733 185
Kļavenieks reported (Kļavenieks, 2014) that today less than half of disposed mixed waste could be pre–treated before landfilling (see Table 3). There is planned that waste pre-treatment capacity in Latvia, after new infrastructure establishment will reach to 701 380 tonnes per year in 2016. Landfilling of mixed MSW without pre-treatment or separation out the biological fraction is common practice in Latvia. Nowadays, this option is reasonably considered as bad practice because associated with environmental and safety risks related to landfill gas collection (Arina, et al., 2012) with a methane (GHG) generation potential, also treatment of leachate and worthless land usage. But the problems arise with a material after pre-treatment process at landfills - it further application and use (see figure 1).
Fig. 1: The average composition of waste fractions after waste pre-treatment by the disc screener (%, for dry waste)
The results of mechanical sorting of mixed waste show that the coarse fraction, mostly complies with the standard of RDF material of the local cement kiln, content of moisture in all fractions is too high for RDF production, and separated organic fraction is with high pollution level to be used as a compost (Kalnacs, et al., 2013). Therefore, the separation of kitchen and garden waste at source must be a high-priority issue in municipal waste management.
The total compost plants capacity at landfills are 29 720 m2, they are designed for composting of small fraction which consists of polluted bio mass. However, a number of municipalities have their own green waste repository, where green waste is stored, managed and used for landscaping, but this amount is not listed in the state report.
Mixed waste pre-treatment capacity in Latvia, Table 3
WMPR / Operator Location Capacity, tonnes
Year established
Compost plant, m2
Ziemeļvidzeme / ZAAO Daibe, MBT landfill 30 000 2011 5 632 Vidusdaugava / Vidusdaugavas
SPAAO
Dziļā vāda, MBT landfill 80 000 2012 14 000 Liepāja / VAAO Vibsteri , MBT 40 000 2012
Pierīga / Ķilupe Ķilupe, MSF 14 000 2012 Zemgale / Jelgavas komunālie
pakalpojumi
Brakšķi, MBT landfill 30 000 2013 Ventspils / Ventspils
labiekārtošanas kombināts Pentuļi, MBT landfill 22 380 2013
Dienvidlatgale / AADSO Cinīši, MBT landfill 60 000 2015 1 050 Piejūra / AAS Piejūra Janvāri, MBT landfill 40 000 2015 5 038 Austrumlatgale / ALAAS Križevņiki, MBT landfill 20 000 2015 2 000 Piejūra / AAS Piejūra Jūrmala, MSF 20 000 2015
Alba 5 (AP Kaudzītes) Kaudzītes, MBT landfill 15 000 2015 2 000 Pierīga /
Vides pakalpojumu grupa/Getliņi EKO
Getliņi, MBT landfill 300 000 2016 Liepāja /
EKO Kurzeme/Liepājas RAS
Ķīvītes, landfill 30 000 2016 Total mixed waste pre-treatment / compost capacity, tonnes:
January, 2014 January, 2016 216 380 701 380 29 720 0 10 20 30 40 50
Coarse fraction Medium fraction Fine fraction
% Paper Plastics BIO Fines (<10 mm) Hygienic Textile Rubber Wood Metal
Dubrovkis et al pointed that 34 biogas plants worked in Latvia in 2012 with a total installed capacity of around 39 MW, including 3 biogas plants at landfills – Daibe, Ķīvītes and Getliņi; 1 biogas plant of urban sewage sludge; 2 biogas plants of food industry (biogas is used directly combustion boiler); 1 wood biomass gasification facility, and 27 biogas plants in agriculture (Dubrovskis, et al., 2013).
4. MATERIALS AND METHODS
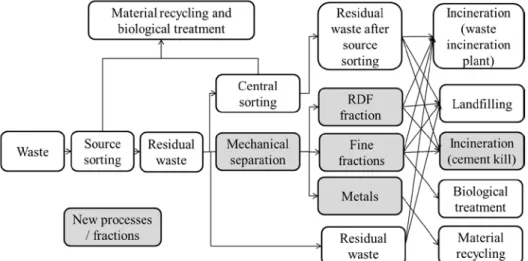
The Waste Management Planning System (WAMPS) software has been used as the environmental impact analysis tool for modelling waste management scenarios. The new version of WAMPS (see Fig. 2) offers the user to create more scenarios for waste management development, as it has been improved with a mechanical pre- treatment process, where new fractions – metal, fine and RDF – are produced. The new waste material technology – incineration in a cement kiln – is also one of the solutions how to use waste as burning material and replace the fossil resources.
The WAMPS software calculates emissions, energy and turnover of waste streams for processes within the waste management system, e.g., waste collection and transportation, composting, anaerobic digestion, and final disposal – landfilling or incineration (IVL, 2013).
Fig. 2: Overview of WAMPS modelling possibilities
WAMPS software based on the Life Cycle Assessment approach, and the results are presented in four environmental impact categories: acidification, global warming, eutrophication and photo-oxidant formation, which are characterised by a certain emission. This paper focuses only on the global warming category.
WAMPS covers an integrated waste management system starting with the activities where products become waste and have been put into the waste bin at waste generation source to the last point, where the waste becomes either useful material (recycled material, biogas or compost) or becomes part of emissions in the environment after its final disposal at a landfill or incineration plant. The calculation can give also negative net emissions, as an example WM with incineration could give lower emissions than the corresponding energy production in the background system (fossil resource). The net emissions from each of waste management scenarios are calculated after equation (1) (Moora, 2009):
Enet = Ewaste – Ebackground (1)
where,
Enet – Net emissions (tonnesyear-1);
Ewaste – Emission from waste process that produce a certain amount of product /
energy (tonnes year-1);
Ebackground – Emission from the same amount of alternative virgin production in the
background system (tonnesyear-1).
Also, in the development of the WAMPS software, a number of limitations have been acknowledged.
4.1. Waste amount and composition
For the modelling purpose, it is assumed that total collected municipal waste amount correspond to produced amount listed in the public officially available data of municipal waste management form “No. 3-Waste Report”, it is 583 068 tonnes year-1 (see Table 4). The waste from source institutions and small enterprises - consists of amount in a section “Produced waste” of statistic data, and it is 185 624 tonnes year-1 (LEGMC, 2014). The Eurostat report (Eurostat, 2014) indicats that 64% of total population live in multi-storey buildings in Latvia. Therefore, rest of total collected municipal waste is shared following: 64% or 254 364 tonnes year-1 from multi-storey buildings and 36% or 143 080 tonnes year-1 from private houses.
In this case study, it is assumed that waste composition in the country conforms to assessed municipal waste composition of Ogre municipality (39 233 inhabitants). There were sorted and measured 28 tonnes of waste with the waste composition characteristic of the summer season (Bendere, et al., 2014).
Municipal waste composition (tonnes year-1 and % by weight), Table 4
Institutions and small
enterprises Multi-storey buildings Private houses Waste amount, tonnes
185 624 254 364 143 080
Waste fraction, % by weight
Paper and cardboard 32% 10% 11%
Newspaper, magazines ect. 7% 3% 3%
Plastic 27% 28% 21%
Metal packaging (aluminium and
steel) 1% 2% 2%
Glass 4% 8% 8%
Rubber, incl. tyres - - -
Clothes, shoes, textiles and leather - - -
Wood - - -
Biodegradable material (mixed - 13% 1%
Organic degradable kitchen waste 10% 29% 19%
Garden Waste 14% - 20%
Hazardous waste 1% 2% -
Electric and electronic wastes
(WEEE) - - 3%
Inert wastes 3% 5% 4%
Non-hazardous batteries - - 5%
Others 1% - 3%
Total 100% 100% 100%
1) sorting at source (see Table 5) and mechanical sorting.
The provided inhabitants survey in Marupe municipality (Riga suburb with 10 000 inhabitants, of whom 5 000 live in private houses) in 2014 shows that two thirds of 171 respondents confirm - they already organizing green waste backyard composting. This aspect is taken in account in order to fulfil Landfill Directives target and requirements on biodegradable waste. It is assumed that all private houses reduce green waste amount at source gradually: 50% of weight in Scenarios 1 and 100% - in Scenarios 2 and 3 by home composting.
After estimated statistic data and waste composition, the institutions can fulfil green waste treatment targets and start to separate 100 % of produced green waste. The treatment can be done using open windrow composting. The third largest producer of food waste - food service and catering sector is taken into account in Scenario 2, but households living in multi-storey buildings are added in Scenario 3.
Currently, the Waste Framework Directive objectives are very ambitious for Latvia, so it is chosen less ambitious goal - 25% source sorting of waste materials: paper / cardboard, glass, plastic and metal in the Scenarios 1 to 3 (see Table 5).
Waste sorting at source of studied waste management scenarios, Table 5
Scenario Paper / cardboa rd
Glass Plastic Metal Food waste Green waste Institutions Multi-storey buildings Institutions Private houses Base 4% 1% 1% 1% <1% 100% - Scenario 1 25% 25% 25% 25% - - 100% 50% Scenario 2 25% 25% 25% 25% 100% - 100% 100% Scenario 3 25% 25% 25% 25% 100% 100% 100% 100%
After source sorting of waste material (paper, plastics, glass, metallic packages and bio-waste) rest of waste - mixed waste is transported to landfill equipped with mechanical sorting line for pre-treatment process. After results of investigation (Kalnacs, et al., 2013), the four fractions are separated from the total mixed household waste mass, i.e.:
~35 % – fine fraction mainly composed of organic waste; ~40 % – medium fraction of diversified waste;
~22 % – coarse fraction (RDF) containing waste of high calorific value (plastics, paper, textile, rubber);
~3 % – iron-containing.
This percentage was used in mechanical sorting calculations of calculated waste management scenarios.
4.2.Waste management scenarios and used technologies
A base scenario and three alternative scenarios is developed for Latvian waste management system. The studied scenarios are hypothetical and characterise possible food waste and green waste management development trends in Latvia, in order to reduce GHG emissions. Base scenario conforms to existing situation in the country.
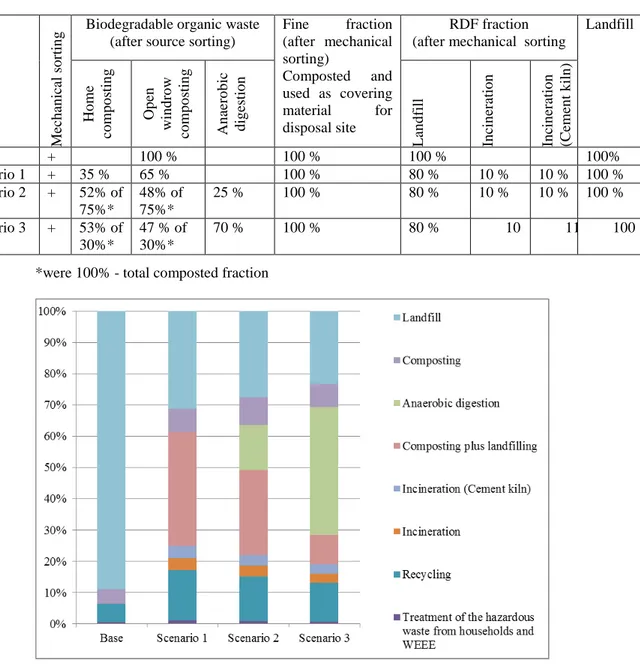
Main characteristics of studied waste management scenarios, Table 6 S cen ar io M ech an ical s o rt in
g Biodegradable organic waste (after source sorting) Fine fraction (after mechanical
sorting) Composted and used as covering material for disposal site RDF fraction (after mechanical sorting
Landfill Ho m e com pos ti ng O pe n w indr ow com pos ti ng A n aer o b ic d ig es tio n L an d fill In cin er atio n In cin er atio n (C em en t k iln ) Base + 100 % 100 % 100 % 100% Scenario 1 + 35 % 65 % 100 % 80 % 10 % 10 % 100 % Scenario 2 + 52% of 75%* 48% of 75%* 25 % 100 % 80 % 10 % 10 % 100 % Scenario 3 + 53% of 30%* 47 % of 30%* 70 % 100 % 80 % 10 11 100
*were 100% - total composted fraction
Fig. 3: Projection of treatment of studied waste management scenarios (% by weigh)
The assumptions taken in the mathematic design of the models are (see Table 6 above): a) it is assumed that biodegradable waste composting produce the compost that is 60% from the
total mass, and it is used as fertiliser for landscaping, agricultural or local consumption at home;
b) in all scenarios it is assumed that energy produced from landfill gas and waste incineration replaces fossil fuel in a background system - natural gas;
c) in all scenarios it is assumed that landfill gas is recovered and combusted with 35% efficiency (Arina, et al., 2012; Sonesson, et al., 1997) – 50% of district heating and 40% of electricity;
d) the incineration complies with EU requirements, and it is assumed that energy recovery from incineration process is 20% of electricity and 80 % district heating.
5. RESULTS
The LCA modelling results of studied scenarios show that biodegradable waste avoiding from disposal in landfills leads to significant reduction of GHG. The global warming of analysed scenarios is shown in Figure 4 and Table 7.
Fig.4: Overview of global warming from studied waste management scenarios (tonnes CO2 eqv)
The diagrams show net emissions from each waste management technology minus saved emissions in the background system. Negative results show avoided impacts and saving of fossil fuel.
Total designed GHG emission shows reduction from 404 700 tonnes CO2 eqv (Base
scenario); 222 127 tonnes CO2 eqv (Scenario 1); 158 526 tonnes CO2 eqv (Scenario 2) to
92 333 tonnes CO2 eqv (Scenario 3).
Global warming emissions by each waste treatment technology (tonnes CO2 eqv.), Table 7
Anaerobic
digestion Composting
Composting
plus landfilling Incineration
Incinerati on (Cement kiln) Landfill Base - 2 981 23 159 - - 415 037 Scenario 1 - 4 526 24 569 -32 346 -24 497 255 230 Scenario 2 -6 836 5 891 20 746 -7 152 -24 104 252 958 Scenario 3 -43 162 5 422 8 301 -6 284 -22 853 246 070 Mechanical sorting Recycling Treatment of discarded electronics (WEEE) Treatment of hazardous batteries Treatment of the hazardous waste from households
Base 1 619 -36 533 -1 548 -109 95
Scenario 1 1 485 -76 897 -1 998 -4 842 -1 662 Scenario 2 1 372 -76 897 -1 998 -4 842 -1 662 Scenario 3 1 016 -76 897 -1 998 -4 842 -1 662
CONCLUSIONS
Landfill (Base Scenario), as final disposal waste treatment method, is a major source of GHG emissions, mainly CH4, despite of the fact assumed that all landfills gas is collected and
recovered.
A significant net impact give material recycling and incineration, especially an incineration in cement kiln, when materials are recycled and produced heat and electricity that allows to save virgin materials and fossil fuels. It also reduce disposed amount in landfills.
The sorting of food waste at source and reduction of its content in the fine fraction for composting and landfilling – increase options to use food waste as valuable material and reduce significantly disposed waste amount in landfills. Also the food waste separated at source presents significant input material for energy recovery and energy production from biogas which displaces energy largely based on fossil fuels (coal, oil, gas).
Composting may results in CO2 emissionfrom organic matter decomposition process, also
after the compost is added to the soil and from mechanical turning of the compost pile. If composting process is managed properly, then CH4 emission does not appear from anaerobic
decomposition.
Current statistic data show insufficiency of reliable data of produced food waste amount and its content which reduce the effectiveness of waste treatment planning. Therefore pilot research results are extremely necessary.
In a system perspective, it is essential requirement to prepare food waste for anaerobic digestion in planned capacity and constant quality, therefore food waste thermal stabilisation is desirable.
In order to manage food waste anaerobic digestion feasible (composting only food waste without any other organic material will be extremely difficult), establishment of new or integration in existing alternative systems for energy and digest consumption is necessary. The rationale is to combine production with agriculture, transport or other utilities.
The green waste composting is rational option, if the produced compost is valuable and is needed as soil improver. Therefore government has to create legislative and economical instruments how to adequately stimulated compost market and use produced material for landscaping, road construction projects or others.
Home composting in private houses, in case of Latvia, is very feasible and it allows reduce significantly treated municipal waste amount. Therefore local municipal support and campaigns of home composting awareness arising is extremely necessary.
REFERENCES
Arina, D., Bendere, R. & Teibe, I., 2012. Pre-treatment Processes of Waste Reducing the
Disposed Amount of Organic Waste and Greenhouse Gas Emission. Florence, The ISWA
World Solid Waste Congress 2012, p. 517 pdf.
Barton, R., Dalley, D. & Patel, V., 1996. Life Cycle Assessment for Waste Management.
Waste Management, 16(Nos 1-3), pp. 35-50.
Bendere, R., Teibe, I. & Arina, D., 2014. Finding sound bio-waste treatment solutions in the
Baltic states. Athens, National Technical University of Athens.
BIO Intelligence, S., 2011. Preparatory Study on Food Waste Across EU 27, bez viet.: European Communities.
BiPRO, 2012. Screening of Waste Management Performance of EU Member States, Brisele: European Commission.
Boer, E., Boer, J. & Jager, J., 2005. Waste management planning and optimisation. Handbook
for municipal prognosis and sustainability assessment of aste managemnt systems. 1st red.
Stuttgart: Ibidem- Verlag.
Dubrovskis, V., Niklass, M., Emsis, I. & Kārkliņš, A., 2013. Biogāzes ražošana un efektīva
izmantošana, Rīga: Latvijas Biogāzes asociācija.
Eurostat, 2012. Greenhouse gas emissions by sector, Luxemburg: Eurostat.
IVL, 2013. Joint Baltic Sea Region Strategy for Municipal Waste Management, s.l.: s.n. JRC, 2014. End-of-waste criteria for biodegradable waste subjected to biological treatment
(compost & digestate): Technical proposals, Luxembourg: bez nos.
Kalnacs, J., Arina, D. & Murashov, V., 2013. Content and Properties of Mechanically Sorted Municipal Wastes and Their Suitability for Production of Alternative Fuel. Renewable Energy
& Power Quality Journal, pp. pp 1-4.
Kļavenieks, K., 2014. Eiropas Savienības fondu 2014. - 2020. gada finanšu plānošanas
perioda potenciāli atbalstāmo vides aizsardzības aktivitāšu ekonomisko ieguvumu novērtējums, Riga: Geo Consultants, SIA.
LEGMC, 2014. Valsts statistisko pārskats "3-Atkritumi" (State Statistical Review "3-Waste"), Riga: bez nos.
Mc Dougall, F., White, P., Franke, M. & Hindle, P., 2003. Integrated Solid Waste Management: a Life Cycle Inventory. In: Integrated Solid Waste Management: a Life Cycle
Inventory. Oxford: Blackwell Science, p. 513.
Moora, H., 2009. Life Cycle Assesment as a Decision Support Tool for System Optimisation -
Sonesson, U., Jonsson, H., Mingarini, K. & Dalemo, M., 1997. ORWARE – A simulation model for organic waste handling systems. Part 2: Case study and simulation results.
Resources, Conservation & Recycling, Sep, 21(1), pp. 39-54.
Tchobanoglous, G., Theisen, H. & S, V., 1993. Integrated Solid Waste Management.
Engineering Principles and Management Issues. Singapore: McGraw-Hill Book Co.
UNFCCC, 2012. National Inventory Submissions, bez viet.: United Nations Framework Contention on Climate Change.
Verghese, K. L., 2009. Life cycle assessment and waste management. %1Life Cycle
Assessment: Principles, Practice, and Prospects. bez viet.:CSIRO, pp. 51-68.
Virsma, 2011. Degradējamā organiskā oglekļa daļas noteikšana apglabātos atkritumos, Rīga: Ziņojums.
Housing statistics, 2014.