Impact of exports
and imports on the
economic growth
MASTER THESIS WITHIN: Business Administration NUMBER OF CREDITS: 15
PROGRAMME OF STUDY: International Financial Analysis AUTHOR: Bashir Al Hemzawi & Natacha Umutoni
JÖNKÖPING May 2021
A case study of Rwanda from 2006 to 2020
Master Thesis in Business Administration
Title: Impact of exports and imports on the economic growth Authors: Bashir Al Hemzawi and Natacha UmutoniTutor: Dorothea Schäfer Date: 2021-May-22nd
Key terms: imports, exports, economic growth, international trade, Rwanda
Abstract
Background: In today’s world, any country cannot live in economic isolation. All aspects of a
nation’s economy (industries, service sectors, levels of income and employment, and living conditions) are connected to the economies of its trading partners. This leads to the international movements of goods and services, labour, technology, investment funds and business enterprise. The national economic development policies are formulated based on the economies of other countries in other to assist them to meets their needs. Thus, international trade is one of the factors that can increase the level of economic growth.
Purpose: The purpose of this study is to examine the impact of exports and imports on the
economic growth of Rwanda.
Method: Referring to trade and economic growth theories, the quantitative research approach
was used to analyse quarterly time-series data of trade and economic growth expressed as Gross Domestic Product (GDP), from 2000 to 2020 that were sourced from the National Institute of Statistics of Rwanda (NISR) and the World Bank websites. Econometric analysis and Ordinary Least Square linear regression were used to examine exports, imports and economic growth of Rwanda.
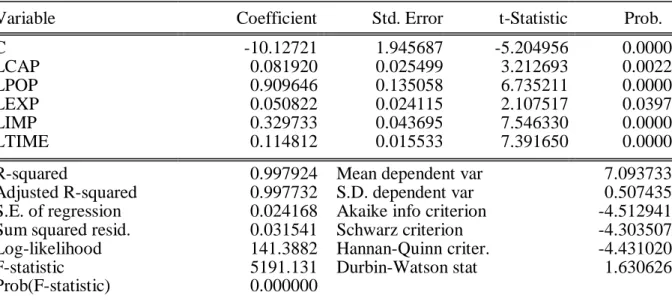
Conclusion: The findings of this study revealed that there is a positive significant long-run
relationship between Rwandan gross domestic product, exports and imports together with gross capital, labour and technology variables. The increase in one percent of exports values influences the rise of GDP by 0.05 percent, while for the increase of one percent of imports there is a rise of GDP by 0.32 percent. The study suggests continuing implementing export-led
or import-led policies by promoting made in Rwanda initiative, National export strategy and technology.
Acknowledgements
First of all, we would like to express our special appreciation and gratitude to our thesis supervisorDorothea Schäfer for allowing us to continue working on this topic and providing us with valuable feedback during every stage of the thesis writing.
Furthermore, we would like to thank everyone who supported us throughout the process of writing this Master Thesis.
Finally, we thank our friends and family, whose support and encouragement made this journey possible.
Bashir Al Hemzawi Natacha Umutoni
Table of Contents
1.
Introduction ... 1
1.1 Background of the study ... 1
1.1.1 International trade and economic growth of Rwanda ... 2
1.2 Problem statement ... 3
1.3 Research objective ... 4
1.4 Hypotheses and research questions ... 4
1.5 Significance of the study ... 5
1.6 Delimitations ... 5
2.
Literature Review ... 6
2.1 International trade theories ... 6
2.1.1 Absolute advantage trade Theory ... 7
2.1.2 Comparative advantage trade Theory ... 7
2.1.3 Hecksher-Ohlin Trade Theory ... 7
2.1.4 Economies of scale ... 8
2.2 Major theories of economic growth ... 8
2.2.1 Harrod-Domar Growth Model ... 8
2.2.2 Two gap economic growth model ... 9
2.2.3 Traditional (old) Neoclassical Growth Theory ... 10
2.2.4 Solow’s neoclassical growth model ... 11
2.2.5 Endogenous Growth / New Growth Theory ... 11
2.2.6 Export-led growth School ... 12
2.2.7 Import-led Growth School ... 12
2.3 Relationship between economic growth and international trade ... 13
2.4 Foreign Trade and trade policies in Rwanda ... 14
2.5 Rwanda trade and economic growth performance in the past two decades .... 17
2.6 Empirical evidence on export-led growth and import-led growth hypothesis . 18
3.
Methodology ... 20
3.1 Research design and approach ... 20
3.2 Data ... 20
3.3 Models used and variables description ... 21
3.4 Data analysis and estimation methods ... 23
3.4.1 Unit Root (Stationarity) test ... 23
3.4.2 Long-run relationship (Cointegration) Test ... 24
3.4.3 Estimation of regression model ... 25
3.4.4 Estimation of impact of covid_19 on exports and imports ... 26
3.5 Research quality assurance ... 26
3.5.1 Test for Linearity ... 26
3.5.2 Serial Correlation Test ... 26
3.5.3 Residual stationarity test... 27
3.5.4 Autocorrelation test ... 27
3.5.5 Normality test ... 27
3.5.6 Heteroscedasticity test ... 27
3.5.7 Stability test ... 28
4.
Findings ... 29
4.1 Analysis of trade and GDP growth patterns in the past 15 years (from 2006 to 2020) 294.2 Findings for the econometric tests ... 30
4.2.1 Stationarity test ... 30
4.2.2 Cointegration Analysis ... 31
4.3 Diagnostic tests for OLS regression validity ... 32
4.3.1 Linearity test ... 33
4.3.2 Residuals’ stationarity test ... 33
4.3.3 Normality test ... 34
4.3.4 Autocorrelation test ... 35
4.3.5 Serial correlation test ... 35
4.3.6 Heteroscedasticity test ... 36
4.3.7 Stability test ... 36
4.4 Impact of covid on trade in Rwanda ... 38
5.
Analysis and discussion ... 40
5.1 Population (labour force coefficient)... 40
5.2 Cross capital formation coefficient ... 40
5.3 Exports’ coefficient ... 41
5.4 Imports’ coefficient ... 41
5.5 Time trend coefficient ... 42
5.6 Impact of covid_19 on imports and exports ... 42
6.
Conclusion and policy implications ... 43
6.1 Conclusion... 43
6.2 Policy Implications and Recommendations ... 44
6.3 Areas for further research ... 46
7.
Reference list... 47
Tables
Table 1: ADF stationarity test results ... 31
Table 2: Lag order Selection Criteria results ... 31
Table 3: Cointegration test results ... 32
Table 4: Results of stability test for residuals ... 34
Table 5: Results from autocorrelation analysis using Correlogram-Q-residuals test 35 Table 6: Results from Breusch-Godfrey Serial Correlation LM Test ... 35
Table 7: ARCH Heteroskedasticity Test results ... 36
Table 8: Results from Ramsey RESET stability Test ... 36
Table 9: OLS Regression Results ... 37
Figures
Figure 1: Trends of Rwanda exports and GDP growth from 2006 to 2020 ... 29Figure 2: Trends of Rwanda imports and GDP growth from 2006 to 2020 ... 30
Figure 3: Scatter diagrams showing linear pattern of GDP and independent variables33 Figure 4: Results from Histogram_ Normality Test ... 34
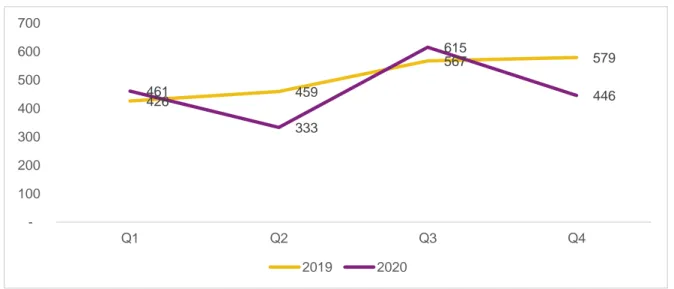
Figure 5: Trend of imports (in millions of Rwfs) during 2020, in the first year of Covid_19 period ... 38
Figure 6: Trend of exports (in millions of Rwfs) during 2020, in the first year of Covid_19 period ... 39
Appendices
Appendix 1: Data used in the Study ... 53Abbreviations and acronyms
GDP: Gross Domestic product ITC: International trade Center LCU: Local currency unit LDC: Least Developed country
NISR: National Institute of Statistics of Rwanda ILG: Import-led growth policy
ELG: Exports-led growth policy OLS: Ordinary Least Squares
LGDP: Logarithm of Growth Domestic Products LIMP: Logarithm of imports
LEXP Logarithm of exports LPOP: Logarithm of population
USAID: United States Agency International Development LCU: Local currency unit
1. Introduction
This chapter introduces the research topic by describing the contextual background, the problem statement which was the basis of objectives and convenient research questions formulation. Besides the relevance of the research topic is provided.
1.1 Background of the study
International trade which refers to the exchange of goods and services between countries was a key to the rise of the country’s economy. The study of the relationship between international trade and the growth of the economy was recognized early since the classic period in the 18th century when David Ricardo and Adam Smith believed that trade can influence positively economic growth (Frieden & Rogowski, 1996) and (Baines, 2003).
Theories indicated generally that there is a link between economic growth and trade components. Many researchers agreed on the fact that international trade without barriers leads to GDP growth through market creation for surplus outputs, creation of employment and increased national income (Lee, 1995).
In the 1970s Asian tigers (South Korea, Taiwan, Singapore and Hong Kong) provided empirical evidence of the positive impact of international trade on GDP growth. Through export-oriented policies, they rose from being least developed countries (LDCs) to middle-income countries. This success inspired other developing countries including the Sab-Saharan African region to engage in foreign trade as a way for increasing economic growth in their countries (Lall, 2000). The reason behind here is that foreign trade generates resources that finance industrialization to produce more goods, create jobs and thus increase economic growth (Hachicha, 2003).
During the implementation of export-oriented policies, different developing countries had varying results of GDP growth (Rodrik & Rodriguez, 2000). Each country has its present economic growth, although its growth rate has shifted from slow and irregular to a more dynamic, rapid and continued rate, especially after the Industrial Revolution (Antunes, 2012).
1.1.1 International trade and economic growth of Rwanda
Rwanda is a developing country with a large population relying on subsistence agriculture. The 1994 genocide that occurred in Rwanda destroyed the economy of the country. Even though there was a crisis in the economy, the government struggled to make policies that aimed at improving economic growth.
Rwanda has recently enjoyed strong economic growth rates, creating new business prospects and lifting people out of poverty. It is important to note that in past 15 years agricultural sector contribution to GDP is 24 percent, while the industries sector and services contribute 19 and 49 percent respectively. The services sector recorded the fastest growth rate due to the high effort of the government in promoting tourism (NISR, 2020b).
The Government of Rwanda is actively working to develop the economy and reform the financial and business sectors. According to the World Bank, (2010), Rwanda was ranked 139th
country in improving the business climate in 2010 and its rank increased drastically to 62nd
place in 2016. Rwanda’s major foreign exchange earners include mining, tourism, coffee, and tea. Continued growth in these sectors will be critical for economic development and poverty reduction (USAID Rwanda, 2021).
For small economies like Rwanda who is not among the leading countries in technological advancement, trade becomes the main key factor in boosting the country economic growth. Though Rwanda is a low-income country, it is thriving to transforming into a middle-income economy. Due to its continuous efforts to promote a private sector-led-free market economy by improving its business environment and competitiveness, Rwanda is known as a lead reformer in economic growth in East Africa and is committed to improving trade with neighbouring countries and tackling non-tariff barriers to hinder intra-regional trade (ITC, 2014).
In 2019, Rwandan GDP estimates at current prices were US$ 10.4 billion, where the agriculture sector contributed 24 percent of the GDP, the industries sector contributed 19 percent and services contributed 49 percent (NISR, 2020). Regarding trade, in 2019 exports estimates were US$ 784 billion while imports estimates were US$ 3,168 billion (NISR, 2020a).
1.2 Problem statement
International trade allows countries to expand markets and access goods and services at a reasonable price that are not easily accessed domestically by consumers. The link between international trade and economic growth have interested many researchers for a long time, wondering if international trade can increase the growth rate of country income. As pointed out early in this paper, many authors agreed that countries that engage in foreign trade are more likely to experience a certain level of economic growth than economies that direct away from foreign trade (Carbaugh, 2011).
In the past 20 years, the Rwandan GDP at current prices rose from US$ 2.1 billion in 2000 to US$ 10.4 billion in 2019 (NISR, 2020b). In addition, the World Bank reported that exports were 5.4 percent of GDP in 2000 and by 2019 it has expanded to 21.8 percent of GDP (World Bank, 2020a). Imports of goods and services counted for 22.1 percent of GDP in 2000 and by 2019 they were 36.1 percent (World Bank, 2020b). This has raised an interesting question considering the factor behind this growth in both trade and economic growth. However, it is important to evaluate if during these past years this rapid rise in imports and exports is due to the Rwandan trade policy aiming at reducing imports and promote Made in Rwanda products while increasing exports.
A review of the empirical literature on the relationship between economic growth and international trade highlighted that to date there are very few studies conducted, targeting Rwanda. Few studies available on this topic do not pay attention to Eastern Africa particularly Rwanda but on groups of countries such as Sub-Saharan Africa (Zahonogo, 2017), (Chia, 2015), West Africa (A. O. Abdullahi et al., 2016) and South Africa (Mogoe, 2013). Based on findings from these studies, it has been revealed that exports have a positive significant impact on economic growth while imports do not have a definite causal relationship to economic growth. On the other hand, in his study Njikam (2003) studied the trade-growth relationship in Sub-Saharan Africa and found that in some sampled countries there is no correlation between them.
The fact that international trade (exports and imports promotion) is argued to lead to economic growth, Rwanda, like many other developing countries, have executed trade-led economic growth policies to reach economic development and poverty reduction as well. However, the
relationship between trade and economic growth has been empirically controversial in many studies conducted in several different countries, which bring more doubts about the truth of the export and import-led growth approach. This is the motive that aspired the undertaking of this research to contribute to filling the gap of empirical knowledge by testing the export and import-led growth hypothesis solely for Rwanda, separately from other sub-Saharan African countries.
1.3 Research objective
The general purpose of this study is to analyse the impact of exports and imports on the economic growth of Rwanda in the last two decades covering the periods of 2006 to 2020.
To achieve the general objective, these are specific objectives that were measured:
To determine the relationship between exports, imports and economic growth,
To estimate to which extent the percentage change of exports and imports have on the economic growth,
To assess the impact of the Covid-19 pandemic on Rwanda trade in 2020.
1.4 Hypotheses and research questions
Basing on the objectives of the study the following null hypotheses have been tested:
There is no long-run relationship between exports, imports and economic growth,
Exports do not affect economic growth,
Imports do not affect economic growth.
In the context of the research objectives identified above, the study answered the following questions:
Have exports and imports contributed to the increase of economic growth in Rwanda?
Should the Government of Rwanda follow an export-led or an import-led economic growth policy?
To what extent has the Covid-19 pandemic affected the Rwanda trade, and what measures should be taken by the government for the trade recovery?
1.5 Significance of the study
Considering the implementation of Rwandan trade-driven economic development policies and more especially after the adoption of the trade policy aiming at reducing trade deficits, it is significant to carry out this search for empirical evidence that quantifies the impact of international trade on the economic growth of Rwanda, so that the government can continue improving evidence-based policymaking. Therefore, the study finding will be the tool to be used by policymakers on whether Rwanda should persist with the trade-led economic growth. This study will also be a reference for researchers in pursuing further researches on related trade topics.
1.6 Delimitations
This study is a country-level analysis concentrated on the impact of exports and imports on the economic growth in Rwanda from 2006 to 2020. Both exports and imports of goods and services have also taken into consideration. The study is confined to Rwanda due to the country’s history of rapid economic growth (African Development Bank, 2019).
2. Literature Review
The purpose of this chapter is to clarify essential theories that help us to discuss in details the relationship between trade (export and imports) and economic growth within the framework of this research. These theories include international trade and economic growth. This chapter also highlights previous empirical studies carried out to measure the impact of imports/exports on economic growth in aspects of import-led growth (ILG) and export-led growth (ELG) policies.
International trade and economic growth are related in one way or another. The literature on international trade and economic growth have shown such linkage. Discussions of the role that international trade plays in promoting economic growth, have been still ongoing since several years ago. To understand and analysing the effect of international trade on the economic growth of Rwanda it is necessary to understand some theories.
2.1 International trade theories
International trade is the buying and selling of goods and services between countries (Investopedia, 2021). International trade enables countries to sell their domestically produced goods to other countries for economic gain. Therefore, trading with other countries or being a part of any trade agreement brings a positive impact on economic growth (Abdullahi et al., 2013).
International trade theories can be divided into three periods namely classical, neoclassical and modern trade theories. Classical theories recommend that countries can win economically if they all implement free trade. The most known classic theories are the absolute advantage theory developed by Adam Smith and the comparative advantage theory of David Ricardo. Neoclassical theories suggest that countries can gain through free trade by producing goods in which they specialize but with efficient use of resources. The most know Neo-classical theory is the Hecksher-Ohlin Trade Theory (Usman, 2011).
Modern theories support the comparative advantage theory by identifying economies of scale as an important source of economic growth (Berkum & Beijl, 1998; Usman, 2011). Before Adam Smith, there was a mercantilism theory developed in the sixteenth century. According to this theory, the country’s wealth is determined by promoting exports and discouraging imports.
This theory did not favour free trade and the world wealth was fixed because countries could not simultaneously benefit from trade (Berkum & Beijl, 1998).
2.1.1 Absolute advantage trade Theory
The concept of absolute advantage was earlier developed by Adam Smith in his book "Wealth of Nations" to demonstrate how nations can benefit from trade by specializing in producing and exporting the goods that they produce more efficiently than other countries and importing goods other countries produce more efficiently. In his theory of absolute advantage, Adam Smith states that with free trade, countries can produce and export goods and services in which they could produce more efficiently than the other nations, and import those commodities in which it could produce less efficiently, so that at the end that assistance bring the benefits to all countries. In other words, absolute advantage refers to the ability of a country to produce a product or service at a lower absolute cost than another country that produces the same good or service. In this theory, labour is only a factor of production (Nyasulu, 2013; Smith, 1776, 1997).
2.1.2 Comparative advantage trade Theory
Adam Smith’s theory brought a question if there is benefit from international trade to countries that have or do not have absolute advantage on both goods. David Ricardo brought an answer to that question by his theory which states that a nation gains from foreign trade by exporting commodities in which it has its greatest comparative advantage in productivity and importing those in which it has the least comparative advantage. In this theory, the factor of production is labour and production technology. In general, a country can still gain from international trade by investing all its resources into its most profitable productions though other countries have an absolute advantage in these goods. In other words, comparative advantage refers to the ability of a nation to produce goods and services at a lower opportunity cost (Berkum & Beijl, 1998; Nyasulu, 2013).
2.1.3 Hecksher-Ohlin Trade Theory
The theories of Smith and Ricardo didn’t help countries to answer questions on what factors that can determine the comparative advantage and what effect does foreign trade have on the factor income in the trading nations. In the early 1900s, two Swedish economists, Eli Heckscher and Bertil Ohlin focused their attention on how a country could gain a comparative advantage
by producing products that utilized factors that were in abundance in the country. Their theory is based on a country’s production factors such as land, labour, and capital, which provide the funds for investment in plants and equipment. According to the H-O model, a country could export capital-intensive goods and import labour-intensive goods (Nyasulu, 2013).
2.1.4 Economies of scale
The presence of economies of scale is another reason countries may trade together with each other. This theory is used to explain trade between counties with similar characteristics. This theory states that countries specialize in producing and exporting a restricted range of goods taking advantage of economies of scale (reduction of average cost as a result of increasing the output). In other words, economies of scale signify that production at a large scale (more output) can be achieved at a lower cost. Both exports and imports are factors of production and if utilized efficiently can generate rates of returns for the economy and increase the scale of productivity (Nyasulu, 2013; Ram, 1990)
2.2 Major theories of economic growth
Economic growth is a rise of national output income which can be sustained over a long period. In other words, it is the balanced process by which the productive capacity of the country is increased over time to bring about rising levels of national output and income (Clunnies, 2009).
Economic growth could be said to comprise three components; capital accumulation, growth in population, eventual growth in the labour force, and technological progress. Capital accumulation results when some proposition of personal income is saved and invested to augment future output and income. A larger labour force means more productive workers, and a large overall population increases the potential size of domestic markets. Technological progress results from new and improved ways of accomplishing traditional tasks. Technological progress save labour and capital-saving (Usman, 2011).
2.2.1 Harrod-Domar Growth Model
This is the economic mechanism by which more investment leads to more growth. This model argues that the country’s economic growth is dependent not only on its savings rate but also on the extent to which it can minimize its current consumption levels and increase investments.
Investment creates income and augments the productive capacity of the economy by increasing the capital stock (Ray, 1998).
In this case, economic growth is the direct consequence of a country’s ability to increase both its saving and the ratio of capital-output or GDP, as illustrated in the equation below :
∆Y
Y
=
s
k
From the above formula Y represents national output (GDP) and ∆Y represents the change in GDP, s is savings ratio, and k represents a capital-output ratio. The idea behind this model is that the more the country increases savings and invests a share of its GDP, the more it grows and vice versa.
Ghattak, (1978) revealed that in LDCs the cause of seeking financial loans and foreign aid is to cover deficient resources due to low saving rates and high consumption levels which reduce the GDP growth rates. The promotion of exports can help to narrow the gap between the interest rate on foreign loans and foreign exchange revenues. Domar model also argued that imports can also contribute to economic growth if a country imports capital goods and technology that can increase the country’s capital stock which leads to the growth in GDP. These capital goods may be in the form of productive plant and machinery (Ghattak, 1978).
Generally, the above economic growth model shows that foreign trade could positively impact economic growth through export revenue that supports savings in the financial development of the country. In addition, the model also argues that imports-induced economic growth is possible when it results from the importation of capital goods from abroad that improves productivity while rising the GDP.
2.2.2 Two gap economic growth model
This model complements the Harrod-Domar model by arguing that economic growth emanates from filling saving gaps and foreign exchange gap. This means that to grow its economy, the country has to generate sufficient savings on investments and at the same time foreign exchange revenue from international trade (Ghattak, 1978).
G =
s
k
+
f
k
In the above formula, G stands for national output (GDP) and s represents savings ratio, while f is the foreign exchange ratio requirement for k is the capital-output ratio. This equation means that growth in GDP results from the increase in levels of country savings and its foreign exchange.
Many Least developed countries do not achieve economic growth because either the savings and/or the foreign exchange gap is very wide. In that case, international trade (exports and imports) is advocated as the solution to filling that gap. The reason why trade policy once set must take into consideration export-led growth policy which is thought to generate resources to increase the country’s revenues which finance a country’s development process, and at the same time repay external loans and boost a country’s foreign currency reserves. Moreover, imports may be beneficial if they are productive capital goods and not consumption goods which may even increase the exchange gap (Krueger, 1985).
For a country like Rwanda which is highly import-dependent, export-led growth can generate revenues to finance a country’s development process and fill the external exchange gap and build foreign currency reserves. On the other hand, imports to offset the saving gap must be capital machinery and beneficial goods that bring in more production.
2.2.3 Traditional (old) Neoclassical Growth Theory
This model is a variant of Harrod-Domar formulation by adding a second factor, labour and introducing a third technology variable, to the growth equation. According to traditional neoclassical growth theory, output growth results from the increase in labour quantity and quality (through population growth and education), increase in capital (through and investment), and improvements in technology (Todaro & Smith, 2009).
Apart from the above factors the theory also envisages that some other factors such as foreign trade (exports and imports) have a significant role to play in growth. The model states that trade-led GDP growth results from inter-country movements of foreign capital and investments. In this case, these capital movements can impact growth both from the export and import sides because the exportation
of foreign capital produces returns on investment for the exporting country while the importation of foreign capital can increase the capital stock and boost productivity in the importing country, ceteris paribus (Ghattak, 1978).
2.2.4 Solow’s neoclassical growth model
Solow’s theory implies that the economy converges to a balanced growth path where the output per capita growth rate is determined by the rate of technological progress. Solow’s model follows the neoclassical economic growth tradition by analysing economic growth (Y) as rising through production function containing factors namely labour(L), capital (K) and level of technology (A), by diminishing marginal returns on labour(ß) and capital (1-ß) concerning output (Solow, 1956). This function is summarized in the formula below:
Y=K
ß(AL)
1-ßThis theory shows that foreign trade plays great importance in shoring up economic growth. By foreign trade, the importation of foreign technology and skills improves the effectiveness and efficiency of domestic labour and capital which enables a country to maximize its comparative advantage and allow its gain from trade to increase the level of GDP (Gunter et al., 2005).
In summary, the main advantage of Solow’s model is that it explains GDP growth through not only fixed capital coefficient as Harrod-Domar model but incorporates other factors such as labour, technology and other exogenous factors such as international trade (Todaro & Smith, 2009). Even though Solow’s model is a traditional model, it is still very crucial in analysing a country economic growth for it was been used as a building block to develop other growth theories (Easterly, 2001; Perkins et al., 2006).
2.2.5 Endogenous Growth / New Growth Theory
The endogenous model, also known as the new growth theory, is a variant expansion of the traditional neoclassical model which emphasizes on the principle of diminishing marginal returns to scale of the inputs to the level of output. Normally factors of production being in Solow’s model show mainly constant marginal returns to productivity and capital formation and this neoclassical growth approaches fail to determine the causes of the massive inequalities
in the levels of national income between developing and developed nations. The reason why the new growth theory grew out to narrow the frustration with the earlier neoclassical growth model.
According to this model, an increase in GDP comes from internal production processes (Dasgupta, 1998). Moreover, endogenous models argue that the level of technology in the country comes from international capital transfers between developed countries and LDCs (Todaro & Smith, 2009).
2.2.6 Export-led growth School
The terms "export-led growth," "outward-oriented," "export promotion," and "export substitution" are all used to define policies of countries that have been successful in developing their export markets. Many countries, particularly LDCs, are inspired to engage in export orientation because it encourages specialization which increases national output and decreases the domestic price level. Exports facilitate the utilization of resources in the economy to produce goods and services, and the surplus of them can be sold abroad to satisfy foreign demand while expanding also national output and generating foreign exchange revenue that can be used to finance economic development (Krueger, 1985; Lal, 1992).
2.2.7 Import-led Growth School
The relationship between economic growth and imports is thought negative mainly because most import expenditure decreases national income resources. However, economists generally approved that the impact of imports on GDP originates from the fact that imports enable a country to acquire productive factors it cannot generate by itself and within its geographical limitations due to the non-appearance of the needed technology, workforce, skills and so on. Imports are the main diffusion channel in this international trade of capital and technology because imported foreign technical knowledge contains the potential to increase domestic production levels and imports help also in economic interactions between a country’s citizens and their external counterparts (Grossman & Helpman, 1991; Ram, 1990).
Coe et al., (1993) detected several conduits through which imports impact GDP growth. They mentioned firstly that the importation of intermediate capital goods may increase a country’s productive capital stock levels which finally would lead to economic growth. Secondly, imports
increase GDP levels by allowing countries with low technical expertise such as developing countries, to adapt and adopt advanced technological inventions from those with higher technical expertise such as developed countries. Thirdly, imports offer countries the opportunity to learn from others more efficient methods of resources allocation which have an enormous manner on productivity and increased national revenue levels.
These are the facts that imports can improve the quality of domestic technologies through the creation of competition which forces domestic industries to improve their production techniques. Since imports increase the variety of goods available in the economy, they, therefore, reassure the economic productivity of both producers and consumers since their consumption and production decisions are based on diminishing cost and maximizing satisfaction and profits, respectively (Carbaugh, 2005).
2.3 Relationship between economic growth and international trade
International trade has made an increasingly significant contribution to economic growth. The linkage between neoclassical growth and international trade was best explained by David Ricardo’s theory of comparative advantage, where countries are recommended to produce goods at less opportunity cost, relative to other countries. This occurred under the neoclassical trade regime where countries are supposed to increase their GDP through the change in capital and labour after employing technology. The studies on economic growth can be easily analysed using neoclassical production function in which exports and imports enter as additional factors of production apart from labour, capital and technology. This can be summarized in production the function below:
Y= f (L, K, EXP, IMP)
In a function above Y is a level of GDP, K is capital stock, L is labour force, EXP is exports and IMP is imports. According to many studies, it is important to note that, holding everything constant, international trade (both imports and exports) should have a positive impact on the level of GDP.
2.4 Foreign Trade and trade policies in Rwanda
Basing on comparative advantage theory, all countries will benefit from foreign trade if they produce and export the commodities in which they have a comparative advantage over others. In other words, the nation’s benefit will be obtained through the devotion of what itself it can produce cheaply (Usman, 2011).
Another advantage of foreign trade is that it increases the variety of goods available to consumers at a meaningful price and the latter have the chance of exercising their preference, which consequently increases the standard of living. Moreover, foreign trade increases competition. Foreign trade allows the exchange of skills and the transfer of technology around the world (Usman, 2011).
As highlighted by the (World Bank, 2010), in their report untitled Doing Business 2010 Report, Rwanda is making every effort to ensure that increased and sustained benefits are derived from its participation in both regional and international trade. An important aspect of this pioneering orientation is the elaboration of a comprehensive trade policy as a complement to the positive macro-economic and sectoral reforms already undertaken, which made Rwanda one of the leading countries in the World in facilitating trade and investment.
According to WTO, (2020), in 2019 Rwanda ranked 151st country in exports and 153rd country in imports all over the world. The main exports were agricultural products (41.9 percent) Fuels and mining products (26.9 percent), manufactures (13.1 and other commodities (18.1 percent). The main destinations of exports were the Democratic Republic of Congo (38 percent), United Arab Emirates (13.5 percent), Burundi (9.6 percent) Switzerland (5 percent), Uganda (4.2 percent) and the rest of the world (29.6 percent). The main imports were agricultural products (41.9 percent) Fuels and mining products (2.2 percent), manufactures (54.6 and other commodities (28.4 percent). The main origin of imports was China (22.5 percent), the European Union (10.8 percent), India (10.1 percent), United Arab Emirates (8.7 percent), Kenya (47.3 percent) and the rest of the world (40.5 percent).
Rwanda has decided to have an open liberalised economy as the main factor for its economic growth. The reason why trade policy and strategies have been sets to ensure that Rwanda benefits fully from liberalisation. The trade policy is important in developing the environment necessary for the improvement of Rwanda’s trade performance.
Rwanda faces many challenges in trade, namely lack of sufficient investment to expand to meet domestic demand, high production costs which makes the overall operating environment uncompetitive, insufficient quality of products, access to domestic and international markets (MINICOM, 2017).
The sector of industries in Rwanda has a small contribution of GDP around 19 percent (NISR, 2020b). The following trade policies were developed by the government of Rwanda, aiming at raising the trade performance: National Craft Industry policy, Rwanda Tourism Policy, special economic zone policy, Rwanda national export strategy (NES), national industrial policy, Rwanda Intellectual Property Policy, Small and Medium Enterprises (SMEs) Development Policy, made in Rwanda (MIR) policy and Consumer Protection Policy.
The overall objective of the Made in Rwanda Policy is to address the trade deficit and increase job creation by promoting exports, boosting production and stimulating sustainable demand for competitive Rwandan value-added products by addressing factors constraining their quality and cost competitiveness (MINICOM, 2017).
Regarding competitiveness, this policy seeks to promote and develop Rwandan products that meet international standards on all aspects, including price, quality and safety. This policy is geared towards upgrading the quality of domestic production, skills and output through taking stock and complementing current interventions while setting out further interventions that address key drivers of high costs of production (MINICOM, 2017).
This policy aims to reduce the trade deficit by boosting domestic supply to compete with imports, as well as improving export capabilities. Emphasis is given to value-added products over primary exports and domestic market recapturing. Value-added production supports domestic employment and indirect economic activity through backward linkages (MINICOM, 2017).
This policy aims to change the perception that Rwandan-made products are of lower quality than imports. This has been a key driver of growth in imports and has negatively affected local production. The policy, therefore, has a strong communications component, whereby consumers and producers will be sensitised about the availability of quality products that are
Made in Rwanda and GOR will lead the way through public procurement supporting local businesses. This policy is set under four pillars.
The first pillar is about sector-specific strategy where the ministry of commerce together with the private sector identified strategic value chains for which sector-specific strategies may be developed. These value chains are Agro-processing(such as meat and dairy, milling products, sugar, soybeans and Irish potato), construction materials (wood-based products, metallic, cement and ceramics-mining and quarrying), light manufacturing (textile/garments, electronic assembly and pharmaceutical equipment), horticulture, tourism( including high-end leisure tourism, medical tourism and MICE), knowledge-based services, (finance, ICT and BPO), logistics and transport (MINICOM, 2017).
The second pillar is about reducing the cost of production. A major driver of competitiveness is the general cost of production of a given locality and Rwanda scores low on several fronts, including the cost of trade, cost of electricity (until recently) and labour productivity. This negatively affects the competitiveness of Rwandan exports as well as the country’s ability to recapture local market share from imports. Reducing various cross-cutting issues is thus central to boosting production in Rwanda. The high costs of production are forcing industrialists to choose between price and quality to compete in the local market. This does not mean Rwandan producers are creating sub-standard goods, but rather that the Rwandan market is more price-sensitive than quality-price-sensitive (MINICOM, 2017).
The third pillar is to improve quality. The MIR Policy aims for Rwandan products to be known for their quality, reliability and durability at home and abroad. Lower quality products are harder to export. To overcome this duality, many firms have developed different products for different segments of the market; some high-quality and higher price, while others are cheaper and hence less durable. The government will support the private sector to invest in quality by creating the necessary environment for firms to invest in quality, and secondly by enforcing mandatory standards and consumer protection so that firms who do invest in quality are not being undercut by producers of sub-standard products (MINICOM, 2017).
The fourth pillar is to promote backward linkages. Vertical business integration through supply contracts to multi-national firms is perhaps the most effective way to increase domestic quality and supply capacity. To realise the full development potential of these high profile investments,
they must establish strong links with the domestic supplier base and source their inputs and supplies locally, as much as possible (MINICOM, 2017).
The fifth pillar is to change the mindset of people. There is a perception among consumers that imported products are superior in quality or price, in comparison with locally made products. Communications campaign and local preference in public procurement will be the channels through which the change of mindset will be achieved (MINICOM, 2017).
To accentuate the importance of manufacturing in Rwanda’s economy, the government has established industrial parks that have seen industries getting cluster anchored in the Kigali Special Economic Zone and giving due support to the development of other industrial parks, not only in Kigali but all across the country. The Made in Rwanda Policy is aligned to move Rwanda from low-middle income to upper-middle-income country by 2035 and higher income by 2050 given its potential to contribute both to Rwanda’s economic growth in general and the trade balance in particular, as well as to productive employment(Celestin, 2019; MINICOM, 2017).
2.5 Rwanda trade and economic growth performance in the past two decades
Rwanda is a small but growing market, with a population of 12.6 million people and a Gross Domestic Product (GDP) of 10.4 USD (NISR, 2020b). From 2000 to 2019, Rwanda recognized a rapid GDP growth from US$ 2.1 billion in 2000 to US$ 10.4 billion in 2019 at current prices (NISR, 2020b). Exports increased 4 times while imports increased 1.6 times (World Bank, 2020a). Inflation was below five percent in 2018, Rwanda's debt proportional to GDP ratio is relatively low at 47.1 percent, and the percentage of foreign assistance (external grants and loans) in the country’s annual budget has dropped from over 80 percent a decade ago to 32.4 percent in the 2018/2019 National Budget. All those numbers are signs of economic signs in the past 2 decades.
Rwanda is highly import-dependent. The principal imports include electrical machinery and parts; electronic equipment and parts; machinery appliances and parts, vehicles and accessories, cereals, and other foodstuff, pharmaceutical products, cement, and construction equipment including iron and steel, energy, and petroleum products. China, Europe, Uganda, Kenya, India, the United Arab Emirates, and Tanzania are among Rwanda’s major suppliers. Rwanda’s
small industrial sector contributes 19 percent to GDP and employs less than three percent of the population. The services sector – including tourism - generates almost half of GDP (49 percent) and has grown at an average annual rate of around eight percent in recent years. Commodities, particularly gold, tin, tantalum, tungsten, tea, and coffee, generated over 57 percent of Rwanda’s export revenue (NISR, 2020a).
Rwanda is a state member of many trading blocs and that helped to improve the business and trading system. In 2007, Rwanda joined the East African Community (EAC). Rwanda is also a member of the Common Market for Eastern and Southern Africa (COMESA). Rwanda is the only nation in the region to have concluded a Bilateral Investment Treaty (BIT) with the United States. In 2009, Rwanda became the newest member of the Commonwealth and joined the OECD Development Center in 2019 (ITC, 2014). Rwanda is a member of the Northern Corridor initiative, which includes Kenya, Uganda, South Sudan, and Ethiopia as core members. Unlocking some of the larger infrastructure projects, such as rail transportation, envisioned under these initiatives could help to reduce the cost of conducting business and transporting goods across the region (ITC, 2014).
2.6 Empirical evidence on export-led growth and import-led growth hypothesis
The export-imports-economic growth relationship has been dealt with in several empirical studies using time series data. In his study untitled “Performance Evaluation of Foreign Trade and Economic Growth in Nigeria”, Usman, (2011) reported that imports and exports are negatively related to GDP. The same results were found by (Oviemuno, 2007) in Nigeria. Based on the panel data of 16 countries of West Africa, using the OLS method, Abdullahi et al.(2016) found that a one percent rise in the export variable will lead to the growth of GDP by 5.11 percent while import had a positive but insignificant impact on GDP growth.
For small open economies, like Portugal and the Netherlands, who are not leaders in world technological advancements, findings show that in the Portuguese economy both exports and imports positively affect economic growth(Antunes, 2012). The study in Tunisia revealed the presence of a positive and significant relationship between exports and economic growth determined by manufactured exports instead of food-processing exports and international tourism(Hachicha, 2003). Wah (2004) reported that for the past four decades (1961-2000), the
Malaysian economy grew at a significant average rate of 6.8% per annum. The rapid growth was partly informed by the success of the export-oriented Industrialization policy.
In Botswana, (Sentsho, 2002) tested the ELG hypothesis by using annual time-series data from the period 1976 to 1997. Using the OLS method he runs a regression and concluded that exports have a positive impact on economic growth in the long run. The validity of the ELG hypothesis on 21 Sub-Saharan African countries was conducted in 2003. It has been revealed that in all those countries exports were found to have a positive and significant effect on economic growth(Njikam, 2003).
Dutta & Ahmed, (2004) examined the behavioural patterns of aggregate levels of imports vis a vis the GDP growth rates for the period ranging from 1971 to 1995 in India. Using econometric techniques, the study showed that the levels of real GDP determine the demand for imports and not vice versa. A study by Humepage, (2000) also found that imports have a positive and statistically significant impact on the level of economic growth in the USA.
Awokuse, (2007) conducted a study on the impact of exports and imports on economic growth in a selected number of Eastern European countries namely the Czech Republic, Bulgaria and Poland. Using neoclassical economic growth model co-integrated Vector Auto-Regressive (VAR) models attempted to find empirical evidence supporting a positive and significant influence of exports and imports on economic growth in those countries (Ramos, 2001).
A similar study targeting evidence of the presence of ILG for India, Indonesia, Philippines, Taiwan and Malaysia was conducted by Thangavelu & Rajaguru, (2004) and they found a positive and significant relationship between levels of imports and national output for the aforementioned Asian economies. There were also strong indications of the presence of a unidirectional relationship from imports to economic growth. On the same topic, Mahadevan & Suardi, (2008) identified the principal role imports play in the economic growth of Japan.
Using a sample of 40 developed nations and Newly Industrializing Countries, Islam et al., (2011) found that the impact of imports in catalyzing economic growth is greater than that of exports in increasing the levels of national income and output in these countries. Other studies recently doubted the positive effects of exports on growth in the long run (Medina, 2001; Oviemuno, 2007; Usman, 2011).
3. Methodology
This Chapter provides the analytical framework within which the study was conducted. It highlights the methodology that this research followed by describing the study area, research design, data collection procedure, data analysis and finally the research quality.
3.1 Research design and approach
The research design refers to the plan that provides an appropriate framework for the study to answer the research question. This is a strategic framework for action that serves as a bridge between research questions and the execution, or implementation of the research (MacMillan & Schumacher, 2001). In analysing the impact of exports and imports on economic growth in Rwanda from 2006 to 2020, a time series quantitative research design was employed. This design involves a collection of data collected periodically on the same variable(s) (Bryman & Bell, 2007). This design was chosen because it was found the best foundation for reaching our purpose.
According to Igwenagu (2006), research methodology is a set of systematic technique used in research by describing how the research will be conducted data collection and analysis methods that will be used. To satisfy the objectives of the study, quantitative research was held, because the nature of this study requires comparing numeric data, testing theory and making generalizations on the whole population. Therefore, quantitative research methodology was employed in the statistical analysis of collected time-series data from 2006 to 2020.
3.2 Data
Rwanda is a landlocked country located in central and east Africa. After the genocide in 1994, the Government has stabilised the political situation, while putting the economy back on track. Rwanda is a low-income country aiming at transforming the country into a middle-income economy by improving its business environment and competitiveness. Rwanda has been internationally commended as a lead reformer in East Africa.
The country’s improving business environment has contributed to its vigorous economic growth, by the government’s continuous efforts to promote a private sector-led free market
economy. Rwanda is committed to improving trade with neighbouring countries and tackling the numerous non-tariff barriers that continue to hamper intra-regional trade (World Bank, 2010). Being land-locked requires having a regional integration to facilitate free trade.
To measure the relationship between trade and economic growth, this study used secondary quarterly time series data covering the period 2006 to 2020. In this study, the variables of interest were GDP (a proxy of economic growth), gross capital formation, labour force expressed as age working population from 15 to 64 years, exports and imports.
GDP, exports, imports, and gross capital formation time-series data used in this study were retrieved from the National Institute of Statistics of Rwanda data portal found in excel of quarterly national accounts. All of these data have units measured in millions of local currency units as Rwandan francs at current prices. Labour force data were collected from the World Bank data portal. These two sources have comprehensive statistics and are easy to access without any permission. After downloading all data, they were organized into one excel sheet using Microsoft Excel to facilitate data analysis. Organized data containing GDP, capital, labour force, exports and imports, were imported in EViews Version 11 software for analysis and interpretation.
3.3 Models used and variables description
As explained in chapter 2, the neoclassical production function model argued that the GDP growth is impacted by the labour force, capital, level of technology, and other exogenous factors such as international trade (exports and imports). To assess if there is a relationship between economic growth and international trade, together with other production factors namely gross capital, labour force and technology, the econometric model was suggested.
This economic model was tied to neoclassical theory expressed in the following function: Y= f (L, K, EXP, IMP), where Y is a level of GDP, K is capital stock, L is labour force, EXP is exports and IMP is imports. This model was chosen because it was found the best foundation for reaching our purpose (Serena et al.,2016).
To determine the extent to which the percentage change in exports and imports had on economic growth, the linear regression model was used as shown in the equation below:
GDP= β0+ β1 cap + β2 lab + β3 imp + β4 exp + β4 Tech + μ
In the formula above GDP is Gross Domestic Product of country, cap is Capital, lab is Labour, exp is Exports of goods and services, Imp is Imports of goods and services. Coefficient β0 is Intercept while β1, β2, β3, β4, β5 are coefficients of dependent variables. µ is an Error term. The above model implies that GDP growth is a function of gross capital, labour force, exports and imports of goods and services. The variables used in this model are described as follow:
GDP used in this study is a proxy of the total market value of goods and services produced within Rwanda’s geographical boundaries regardless of the nationality of the producers. According to Todaro & Smith (2009) economic growth is increased through the sustained increase in the rate of growth of national income/output (GDP) over time. Thus, it generally approximates economic growth. GDP values were also measured in millions of local currency Units (Rwfs) at current prices.
Capital: Capital is necessary for a country to be able to produce to feed the local demand and surpluses to be channelled abroad as exports. The capital was approximated by the gross capital formation which represents the estimated additions to fixed assets and inventories in the economy. In other words, total capital formation is concerned with a country’s physical capital stock.
Labour force(lab) was be approximated expressed as the country’s population between 15 and 64 years because it is very difficult to get available and accurate time-series data on the labour force in many Least Developed Countries due to data collection problems. Labour force survey started in Rwanda in 2016. So, there is a lack of data in previous years, the reason why the researcher preferred using country’s population between 15 and 64 years from the World Bank data set.
Imports(imp) are the total value of goods and services purchased from abroad by Rwanda. In this study, imports were also measured in millions of local currency Units as Rwandan francs (Rwfs).
Exports(exp) are the total value of goods and services made in Rwanda but sold abroad. In this study, exports were measured in millions of local currency Units as Rwandan francs (Rwfs).
Technology plays a crucial role in the production processes. Due to technology is difficult to measure here the time was used as a proxy, assuming that as time goes the Rwandan technology increases.
3.4 Data analysis and estimation methods
To perform econometric analysis EViews 11 software was used to run econometric tests that enable us to determine if there is a relationship between exports, imports and economic growth expressed as the gross domestic product in this study. Below are different analysis tests that were performed in this study.
3.4.1 Unit Root (Stationarity) test
To determine the relationship between time-series data, testing for stationarity before estimation is deemed necessary as most time series variables might be non-stationary and any estimation with such non-stationary series might produce spurious results. Therefore, the researcher tested if all variables used in this study are stationary using Augmented Dick Fuller (ADF). The ADF test developed by Dickey and Fuller is an augmented version of the Dickey-Fuller (DF) test conceived in late 1979 and is more useful to test complex and larger time-series models (econstor, 2005).
The test for stationarity is being performed under the null hypothesis:
H0: β =0 (which affirms the presence of unit root or the series is not stationary) H1: β ≠0 (Which is against Ho and affirms the absence of stationary)
After computation ADF- test statistic is compared with the critical value. If the absolute value of the ADF test statistic is greater than the absolute value of the critical value, then the null hypothesis is accepted, implying that the series is stationary. On contrary. If the absolute value of the ADF test statistic is greater than the absolute value of the critical value, then the null hypothesis is accepted, implying that the series has a unit root and hence non-stationary. In the case of probabilities, if the calculated probability is less than the critical probability then the null hypothesis is rejected and vice versa.
EViews 11 software helps to perform stationarity test for each variable. A variable was tested at a level also expressed as I (0). If it is stationary at level, it good to hear from that findings. If it is not stationary at level, it doesn’t mean that it is not stationary, it will be again tested at the
first difference, I (1). This means that the variable may be stationary but at different levels such as the first difference expressed as I (1), the second difference expressed as I (2) and so on.
3.4.2 Long-run relationship (Cointegration) Test
It is recommended that the regression of times series that are not stationary (a nonstationary time series on another nonstationary time series) may produce a spurious regression (Gujarati,2004). The reason why the stationarity test of time series used in the regression must be individually tested also so that we will find that all are at least stationary.
Once all are stationary, then a cointegration test is performed to evaluate if there is a long-run relationship between dependent and independent variables. Two or more variables are said cointegrated if they have a long-term relationship between them share the common trends. The cointegration test is considered like a pre-test to avoid spurious regression (Gujarati, 2020).
Given two or more variables that are I (1) are linearly combined, then the combination will also be I (1). More generally, if variables with different orders of integration are combined, the combination will have an order of integration equal to the largest(Brooks, 2008). For this study, the Johansen technique was employed to analyse the presence of a long-run relationship between the dependent variable(GDP) and independent variables (Exports, imports, capital, labour force and technology).
The test for stationarity is being performed under the null hypothesis: H0: No cointegration
H1: There is the presence of cointegration
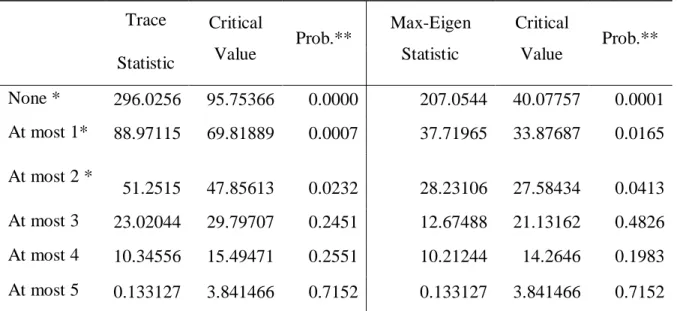
After running Johansen Cointegration Test both trace statistics and maximum Eigen values are highlighted. If trace statistics and maximum Eigen values are greater than the critical values at 5% in that way, the null hypothesis of no cointegration between variables under consideration is rejected and this implies the presence of a cointegration relationship between LGDP and other dependent variables (Exports, imports, capital, labour force and technology).
3.4.3 Estimation of regression model
Once data are found stationary and that there is a long-run relationship between the dependent variable (GDP) and independent variables (Exports, imports, capital, labour force and technology), a regression equation is estimated. The concept of regression is concerned with the study of the dependence relationship between one dependent variable and one or more other variables independent variables with to estimate and/or predict the mean or average value of the future basing on the know past values. The researcher estimated the regression using the Ordinary Least Square (OLS) method because of its mathematical simplicity and it is the best method used in estimating multiple regression models to provide non-spurious regression results (Gujarati, 2003).
Therefore, the OLS method was employed in analysing the impact of exports and imports on economic growth in Rwanda. Given the aforementioned multiple regression model, the following are expected signs for each variable.
GDP= β0+ β1 cap + β2 lab + β3 imp + β4 exp + β4 Tech + μ
Theoretically, the regression coefficient for the labour force, capital, labour exports, and imports is expected to have positive signs i.e. (β 1, β 2, β3, β4 and β5 > 0). In practice, however, the above variables may have a positive or negative or even zero effect on the level of GDP (economic growth). But in this research the emphasis was mainly on the exports coefficient (β3) and imports coefficient (β4) which were expected to exhibit either of the above signs as follows:
β3 > 0 implying that exports increase GDP β3 < 0 implying that exports decrease GDP β3 = 0 implying that exports do not affect GDP β4 > 0 implying that imports increase GDP
β4 < 0 implying that imports reduce GDP, in case a country’s most imports are non-direct
consumable goods
β4 = 0 implying that imports do not affect GDP, in case a country’s most imports are direct
3.4.4 Estimation of impact of covid_19 on exports and imports
To analyse the impact of Covid_19 on trade we compared two periods. One is before covid_19 namely the four quarters of 2019 and another is during the first year of covid_19 occurrence, for four quarters for 2020. For the exports and imports values, the percentage change was used by taking values of imports/exports of the current quarter divide by values of imports/exports of the last quarter. The negative percentage change means the decrease while the positive percentage change implies an increase.
3.5 Research quality assurance
To make sure that results from OLS regression estimation are reliable, the conditions of BLUE (Best Linear Unbiased Estimates) must be respected. Otherwise, the results can provide spurious regression which can disturb future decisions making. Thus, the nature of the time series data must be examined (Gujarati & Dawn, 2010).
Therefore, to ensure the completeness of the BLUE properties the following is the diagnostic tests performed on used time series in this study.
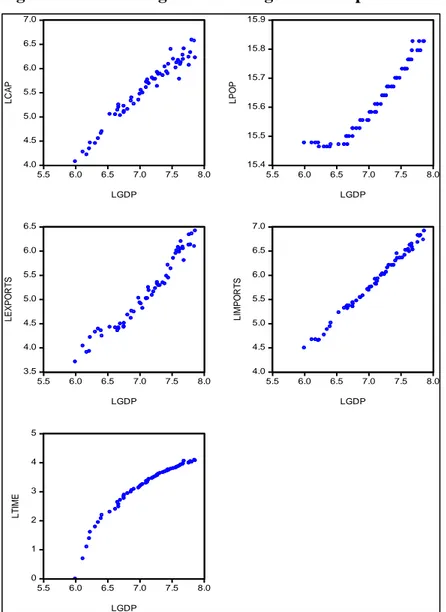
3.5.1 Test for Linearity
To ensure fruitful OLS regression results, the data set needs to be examined if they follow some linear patterns. Otherwise, there will be a spurious regression(Gujarati, 2003). To run this test a researcher used scatter diagrams which aim at examining the linear relationship between GDP and other dependent variables used in this study.
3.5.2 Serial Correlation Test
When future periods are affected by error terms from previous periods, there is a serial correlation. Even though the estimators of OLS regression are linear and statistically significant, and that there is a serial correlation, those estimators are not BLUE. The Serial correlation test which aims at describing the relationship between observations of the same variable over specific periods was performed using the Breusch-Godfrey serial correlation LM test also known as the Lagrange Multiplier test. The null hypothesis of this test is that there is no serial correlation up to lag order p. If R-squared is greater than the critical p-value at 5 % the null
hypothesis is rejected, which means that there is no serial correlation (Kirchgassner & Wolters, 2007).
3.5.3 Residual stationarity test
To ensure there is a relationship between GDP and capital, labour, exports, imports and time variables, residuals has been tested for stationarity. To perform residual stationarity test Augmented Dick fuller test was performed(econstor, 2005). Residuals are stationary if the calculated probability is less than the critical value at 5% of the level of significance. Otherwise, the residuals are not stationary.
3.5.4 Autocorrelation test
Autocorrelation analysis which aims at measuring the relationship between a variable’s present value and its past values was performed using the Correlogram-Q-residuals test.
H0: Absence of autocorrelation of errors H1: Presence of the autocorrelation of errors.
If the results generated show that up to the last lag the probability is greater than 5% critical value then it is affirmed that there is no autocorrelation in the model.
3.5.5 Normality test
As with other parametric tests in statistics, the collected data must be normally distributed around a zero mean and constant variance. For the OLS regression model normality of residuals must be tested. Abuse of this assumption implies that even though OLS estimators exhibit BLUE properties, their statistical reliability cannot be easily determined by statistical significance tests(Gujarati, 2003). The study, therefore, employed the Histogram_ Normality Test.
3.5.6 Heteroscedasticity test
The heteroscedasticity test is executed to determine if the variance of residuals is constant. To determine if error terms from previous periods affect future periods, a heteroscedasticity test was performed using the ARCH method (Kirchgassner and Wolters (2007).
H0: No heteroskedasticity
H1: Presence of heteroskedasticity
If Chi-square is greater than the critical p-value. The null hypothesis is rejected. This means that there is no heteroscedasticity. Otherwise, there is homoscedasticity.
3.5.7 Stability test
The stability test aims at determining if regression coefficients are stable. This test is very crucial because when parameters are stable, forecasting or predictions are possible with the regression model used. This test was performed using the RESET stability test.
4. Findings
This chapter presents the research findings and interpretation of the analysed data. The findings are presented in tables and figures. It is important to note that findings are explained in sub-components basing on research objectives.
4.1 Analysis of trade and GDP growth patterns in the past 15 years (from 2006 to 2020)
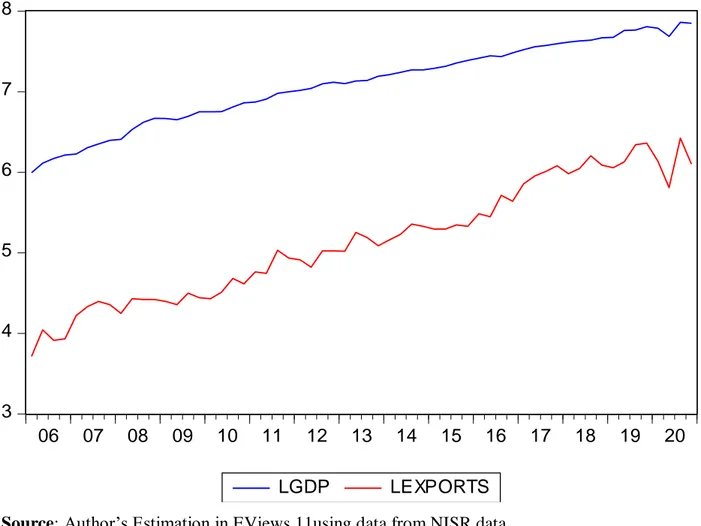
Figure 1: Trends of Rwanda exports and GDP growth from 2006 to 2020
Source: Author’s Estimation in EViews 11using data from NISR data
Figure 1 shows that there was a positive growth trend for GDP and exports from 2006-2020. As it is seen, exports and GDP have a similar trend which means that exports and GDP go together in rising. Quarters 2 and 3 of the year 2020 was marked by a fall in exports due to exports restrictions and disruptions of the value chain caused by Covid_19.
3 4 5 6 7 8 06 07 08 09 10 11 12 13 14 15 16 17 18 19 20 LGDP LEXPORTS