R E S E A R C H A R T I C L E
Open Access
The effect of dosing strategies on the therapeutic
efficacy of artesunate-amodiaquine for
uncomplicated malaria: a meta-analysis of
individual patient data
The WorldWide Antimalarial Resistance Network (WWARN) AS-AQ Study Group
Abstract
Background: Artesunate-amodiaquine (AS-AQ) is one of the most widely used artemisinin-based combination
therapies (ACTs) to treat uncomplicated Plasmodium falciparum malaria in Africa. We investigated the impact of
different dosing strategies on the efficacy of this combination for the treatment of falciparum malaria.
Methods: Individual patient data from AS-AQ clinical trials were pooled using the WorldWide Antimalarial Resistance
Network (WWARN) standardised methodology. Risk factors for treatment failure were identified using a Cox regression
model with shared frailty across study sites.
Results: Forty-three studies representing 9,106 treatments from 1999-2012 were included in the analysis; 4,138 (45.4%)
treatments were with a fixed dose combination with an AQ target dose of 30 mg/kg (FDC), 1,293 (14.2%) with
a non-fixed dose combination with an AQ target dose of 25 mg/kg (loose NFDC-25), 2,418 (26.6%) with a
non-fixed dose combination with an AQ target dose of 30 mg/kg (loose NFDC-30), and the remaining 1,257 (13.8%)
with a co-blistered non-fixed dose combination with an AQ target dose of 30 mg/kg (co-blistered NFDC). The median
dose of AQ administered was 32.1 mg/kg [IQR: 25.9-38.2], the highest dose being administered to patients treated
with co-blistered NFDC (median = 35.3 mg/kg [IQR: 30.6-43.7]) and the lowest to those treated with loose NFDC-25
(median = 25.0 mg/kg [IQR: 22.7-25.0]). Patients treated with FDC received a median dose of 32.4 mg/kg
[IQR: 27-39.0]. After adjusting for reinfections, the corrected antimalarial efficacy on day 28 after treatment
was similar for co-blistered NFDC (97.9% [95% confidence interval (CI): 97.0-98.8%]) and FDC (98.1% [95% CI:
97.6%-98.5%]; P = 0.799), but significantly lower for the loose NFDC-25 (93.4% [95% CI: 91.9%-94.9%]), and loose NFDC-30
(95.0% [95% CI: 94.1%-95.9%]) (P < 0.001 for all comparisons). After controlling for age, AQ dose, baseline parasitemia and
region; treatment with loose NFDC-25 was associated with a 3.5-fold greater risk of recrudescence by day 28 (adjusted
hazard ratio, AHR = 3.51 [95% CI: 2.02-6.12], P < 0.001) compared to FDC, and treatment with loose NFDC-30 was
associated with a higher risk of recrudescence at only three sites.
Conclusions: There was substantial variation in the total dose of amodiaquine administered in different AS-AQ
combination regimens. Fixed dose AS-AQ combinations ensure optimal dosing and provide higher antimalarial
treatment efficacy than the loose individual tablets in all age categories.
Keywords: Malaria, Plasmodium falciparum, Drug resistance, Artesunate, Amodiaquine, Dosing, Efficacy
* Correspondence: philippe.guerin@wwarn.org; christian.nsanzabana@wwarn.org
© 2015 The WorldWide Antimalarial Resistance Network (WWARN) AS-AQ Study Group; licensee BioMed Central. This is an Open Access article distributed under the terms of the Creative Commons Attribution License (http://creativecommons.org/ licenses/by/4.0), which permits unrestricted use, distribution, and reproduction in any medium, provided the original work is properly credited. The Creative Commons Public Domain Dedication waiver (http://creativecommons.org/publicdomain/zero/ 1.0/) applies to the data made available in this article, unless otherwise stated.
The WorldWide Antimalarial Resistance Network (WWARN) AS-AQ Study Group BMC Medicine (2015) 13:66 DOI 10.1186/s12916-015-0301-z
Background
The prompt and effective treatment of confirmed cases
of malaria is a key component of all malaria control and
elimination programmes [1]. Artemisinin-based
combin-ation therapies (ACTs) have become the treatment of
choice for uncomplicated P. falciparum malaria, and
during the last decade have been adopted as first line
treatment in most malaria endemic countries [2]. ACTs
achieve rapid parasite clearance and have been shown to
have high cure rates, and because of the different modes
of action of ACT components, the combinations should
slow the emergence and spread of drug resistance [3].
Artesunate-amodiaquine (AS-AQ) is currently the first
line treatment in 24 countries, mainly in sub-Saharan
Africa, and the second most widely used ACT globally
after artemether-lumefantrine [2]. AS-AQ is available
in three formulations: non-fixed dose combinations
(NFDC) either as loose NFDC or as co-blistered NFDC,
and as a fixed dose combination (FDC). The efficacy of
AS-AQ has been evaluated in a range of epidemiological
settings, and although high cure rates have been
ported in several studies [4,5], some studies have
re-ported low efficacy rates [6-11]. It has been suggested
that the reduced efficacy observed with AS-AQ in some
trials is due to amodiaquine resistance selected by prior
use of AQ monotherapy, mainly in East Africa [12-14]
and Asia [6,7,13,14]. However, the efficacy of AS-AQ
has varied between clinical trials even within the same
regions [5,15,16], suggesting that different designs and
methodology of clinical trials or other confounding
fac-tors are responsible for the varying treatment efficacy.
There is variability in dosing regimens between the
different formulations of AS-AQ currently available on
the market [17]. In particular, young children are
vulner-able to suboptimal dosing, since treatment with both
co-blistered and loose NFDC in these patients often
requires administration of fractions of whole tablets, an
issue which is circumvented by the use of pediatric tablets
in the fixed dose formulation [18].
In the current analysis, we investigate the spectrum of
AS and AQ bodyweight-adjusted (mg/kg) doses
adminis-tered with the different formulations and assess whether
differences in doses or formulations impacted the
anti-malarial efficacy of AS-AQ.
Methods
Data pooling
A systematic review was conducted in PubMed to
iden-tify all clinical trials carried out since 1960 with at least
one AS-AQ arm in March 2014. All published
antimal-arial clinical trials published since 1960 were
identi-fied by the application of the key terms ((malaria OR
plasmod*) AND (amodiaquine OR atovaquone OR
ar-temisinin OR arteether OR artesunate OR artemether
OR artemotil OR azithromycin OR artekin OR
chloro-quine OR chlorproguanil OR cycloguanil OR
clindamy-cin OR coartem OR dapsone OR dihydroartemisinin OR
duo-cotecxin OR doxycycline OR halofantrine OR
lume-fantrine OR lariam OR malarone OR mefloquine OR
naphthoquine OR naphthoquinone OR piperaquine OR
primaquine OR proguanil OR pyrimethamine OR
pyro-naridine OR quinidine OR quinine OR riamet OR
sul-phadoxine OR tetracycline OR tafenoquine)) through the
PubMed library. All references containing any mention
of antimalarial drugs were tabulated and manually
checked to confirm prospective clinical trials. Studies on
prevention or prophylaxis, reviews, animal studies or
studies of patients with severe malaria were excluded.
Further details of the publications or protocols when
available were reviewed, and basic details on the
study methodology, treatment arms assessed and the
study locations documented. These are provided in the
WorldWide Antimalarial Resistance Network (WWARN)
publication library [19]. Specific details of the studies with
at least one AS-AQ arm are available in Additional file 1:
Text S1 and Additional file 2: Text S2.
The year of the study was taken as the year in which
the paper was published, although the start and end
dates of patient enrolment were also recorded. All
re-search groups in the systematic review were contacted
to share their data with WWARN, and those who have
contributed to the WWARN data repository were also
asked whether they were aware of any unpublished or
ongoing clinical trials involving AS-AQ, and also
asked to contribute those unpublished data if available.
Individual study protocol details were available for all
trials, either from the publication or as a metafile
submitted with the raw data. The WWARN invited
investigators to participate in this meta-analysis if
their studies included: i) prospective clinical efficacy
studies of the treatment of Plasmodium falciparum
(either alone or mixed infections), ii) treatment with
AS-AQ with a minimum of 28 days of follow-up, iii)
data available on exact dosages of AS and AQ and iv)
PCR genotyping results to determine whether
recur-rences were due to recrudescence or new infection.
Individual patient data from eligible studies were
shared; collated and standardised using previously
described methodology [20].
Ethical approval
All data included in this analysis were obtained after
eth-ical approvals from the countries of origin. Etheth-ical
ap-proval to conduct individual participant data meta-analyses
was granted by the Oxford Tropical Research Ethics
Committee (OxTREC), and OxTREC ruled that
appropri-ate informed consent has been met by each study.
Dosing calculation
The doses of AS and AQ received were calculated from
the number of daily tablets administered to each patient.
Doses were back-calculated where tablet counts were
not available, using the dosing scheme available from
study protocols. Only patients completing a full
three-day treatment regimen according to the principal
inves-tigator and included in the original analysis were
included in the meta-analysis. The method of dose
cal-culation was tested as a covariate for risks associated
with primary and secondary endpoints, and its influence
in the remaining model parameters was explored when
found significant.
Classification of study sites in transmission zones
The study sites were classified into three categories: low,
moderate and high malaria transmission intensity based
on transmission estimates from the Malaria Atlas Project
[21]. More information about this classification is
avail-able in Additional file 3: Text S3.
Statistical analysis
All statistical analyses were carried out based on an a
priori statistical plan [22], available in Additional file 4:
Text S4. The primary endpoint used in this analysis was
the PCR-adjusted risk of P. falciparum recrudescence at
day 28. Secondary endpoints included PCR-adjusted risk
of P. falciparum recrudescence at day 42, PCR-adjusted
risk of new P. falciparum infection, and parasite
positiv-ity rates (PPRs) on days 1, 2 and 3 after treatment
initi-ation. The overall efficacy at day 28 and day 42 was
computed using survival analysis [Kaplan-Meier (K-M)
estimates]; comparisons of K-M survival curves were
performed using log rank tests stratified by study site
(using a combination of trial and study site). Gehan’s test
was used when K-M curves crossed. Definitions of
outcome and censoring are detailed in the WWARN
Clinical Module DMSAP v1.2 available in Additional
file 5: Text S5 [23]. The mg/kg dose of AQ was
consid-ered as the primary risk factor for recrudescence because
of the longer half-life of its active metabolite
desethyla-modiaquine. The dose of AS was considered as the
pri-mary risk factor for early parasitological response due to
its more rapid anti-parasitic activity and its shorter
half-life. Risk factors for PCR-confirmed recrudescence and
new infections were analysed using a Cox proportional
hazards regression with shared frailty across study sites
to account for any unobserved heterogeneity [24,25].
Known confounders (age, baseline parasitemia, region
and mg/kg dose) were kept in the model regardless of
statistical significance. Any other variables significant at
the 10% level in the univariable analysis were retained
for multivariable analysis; the inclusion of each
sig-nificant variable in the final model was based on a
likelihood ratio test assessed at the 5% level of
sig-nificance. Cox-Snell’s and martingale residuals were
examined to assess the model fit; the underlying
as-sumption of proportional hazards was tested and
re-ported when violated. The population attributable risks
(PARs) associated with the risk factors in the final model
were calculated based on their prevalence in the study data
and adjusted hazard ratio (AHR) using [prevalence ×
(AHR-1)]/ {1 + [prevalence × (AHR-1)]} [26]. The overall
PAR (for a combination of factors), which is non-additive,
was calculated as 1-[(1-PAR
1) × (1-PAR
2) ×
… × (1-PAR
n)].
Risk factors associated with PPRs were assessed using
logistic regression with study sites fitted as a random
ef-fect. The relationship between drug dose and
gastro-intestinal side effects (vomiting and diarrhea), anemia
and neutropenia was also explored using mixed effects
logistic regression with random effects specified for
study sites. Proportions were compared using
chi-squared tests or Fisher’s exact tests when samples were
small. Non-normal data were compared with the
Mann-Whitney U test. The assessment of bias where individual
patient data were not available for analysis was
per-formed using a simulation approach, based on the data
included in the analysis. PCR-corrected efficacy
esti-mates (θ) at day 28 for the given age range for the
stud-ies not available were estimated from the available data.
A total of n (n = study sample size) patients were
simu-lated from a binomial distribution (assuming a simple
case of no censoring structure) with probability of
suc-cess,
θ
i. A study with a sample size n was then simulated
1,000 times from which the mean cure rate and
associ-ated 95% CI were estimassoci-ated. When the observed cure
rate for the non-available study fell within the simulated
95% CI, it was concluded that excluded studies were
similar to the studies in the meta-analysis. All statistical
analyses were carried out in R (Version 2.14.0, The R
Foundation for Statistical Computing) using survival
and lme4 packages.
Results
Characteristics of included studies
Data were available from 57 studies (13,273 treatments),
including 8 unpublished studies (1,505 treatments) and
49 published studies (11,768 treatments), representing
65.1% of the targeted published literature (18,072
treatments). Fourteen studies (3,374 treatments) did not
meet the inclusion criteria and an additional 793
treat-ments were excluded for a variety of protocol violations,
of which 2.8% (22/793) did not include the full course
of treatment (Figure 1). In total, 43 studies (9,106
treatments) were included in the final analysis, of which 39
(8,635 treatments) were conducted in Africa between 1999
and 2012, 1 in South America in 2000 (37 treatments)
and the remaining 3 studies (434 treatments) in Asia
The WorldWide Antimalarial Resistance Network (WWARN) AS-AQ Study Group BMC Medicine (2015) 13:66 Page 3 of 19between 2005 and 2009 (Table 1). Overall, 13 studies
(2,106 treatments) were conducted in areas of high
malaria transmission intensity, 13 (2,958 treatments) in
areas of moderate transmission, and 11 (1,219
treat-ments) in areas of low transmission, and the remaining 6
studies included sites with varied transmission intensity
(2,823 treatments). Patients were followed for 28 days in
34 studies (7,865 treatments), for 35 days in 1 study (82
treatments), for 42 days in 7 studies (1,017 treatments)
and for 63 days in 1 study (142 treatments). Parasite
genotyping of recurrent infections was carried out in all
studies; with 5 studies (1,257 treatments) using a single
marker (MSP2 or MSP1); 16 studies (2,862 treatments)
using two markers (MSP1 and MSP2); 16 studies (3,768
treatments) using three markers (MSP1, MSP2 and
GLURP); 3 studies (898 treatments) using MSP1, MSP2
and microsatellites; 1 study using microsatellites only
(13 treatments); the genotyping method was not stated in
1 study (276 treatments) and genotyping was not carried
out in 1 study with no recurrences (32 treatments).
Drug formulations
Three different formulations from nine different
manu-facturers were used in the 43 studies included in this
analysis (Table 1). Overall, 15 studies (3,677 treatments)
used FDC, 22 (3,711 treatments) used loose NFDC, 4
studies (789 treatments) used co-blistered NFDC and 2
studies (929 treatments) compared co-blistered NFDC
to FDC (Table 1). Various tablet strengths were included
in the different formulations (Table 2). However, only
FDC had pediatric tablets (Table 2 and Additional file 1:
Text S1). All the studies using FDC and co-blistered
NFDC and some studies using loose NFDC with a target
dose of 30 mg/kg amodiaquine (loose NFDC-30)
adminis-tered identical doses of AS and AQ on each of the three
days of treatment, with a target dose of 4 mg/kg/day for
AS and 10 mg/kg/day for AQ (Additional file 1: Text S1).
However, other studies administering a loose NFDC with a
target dose of 25 mg/kg AQ (loose NFDC-25) gave a
higher daily AQ dose on day 1 and 2 (10 mg/kg/day)
and a lower AQ dose on day 3 (5 mg/kg/day), while
Figure 1 Patient flowchart.Table 1 Studies included in the meta-analysis
Studya Number of patients
treated with AS-AQ
Country Age range (months)
Target dose (mg/kg) for artesunate & amodiaquine
Manufacturer Formulation Supervision Reference
Adjuik-2002 390 Multicentric 6-59 12 & 30 Sanofi-Synthélabo & Parke-Davis Loose NFDC Full [8]
Anvikar-2012b 199 India 6-720 12 & 30 Sanofi-Aventis FDC Full [36]
Barennes-2004 32 Burkina Faso 12-180 12 & 30 Sanofi Winthrop AMO & Hoechst
Marion Roussel
Loose NFDC Full [64]
Bonnet-2007 110 Guinea 6-59 12 & 30 Guilin Pharmaceutical & Parke-Davis Loose NFDC Full [65]
Brasseur-2009b 276 Senegal All ages N/A Sanofi-Aventis Co-blistered NFDC Full/partiale [17]
Bukirwa-2006 203 Uganda 12-120 12 & 25 Sanofi-Aventis & Parke-Davis, Pfizer Loose NFDC Full [66]
Dorsey-2007 145 Uganda 12-120 12 & 25 Sanofi-Aventis & Pfizer Loose NFDC Full [67]
Espié-2012 149 DRC 6-59 12 & 30 Sanofi-Aventis FDC Full [34]
Faucher-2009 94 Benin 6-60 12 & 30 Sanofi-Aventis FDC Partial [68]
Faye-2010 155 Multicentric >84 N/A Pfizer Co-blistered NFDC Full [69]
Gaye-2010bd 129 Senegal 12-720 12 & 30 Sanofi-Aventis FDC Full [Unpublished]
Grandesso-2003d 86 Uganda 6-59 12 & 30 Sanofi & Park-Davis Loose NFDC Full [Unpublished]
Grandesso-2006 123 Sierra Leone 6-59 12 & 30 Sanofi Winthrop AMO & Pfizer Loose NFDC Full [44]
Guthmann-2005 96 Angola 6-59 12 & 30 Sanofi Winthrop & Parke Davis Loose NFDC Full [70]
Guthmann-2006 68 Angola 6-59 12 & 30 Sanofi Winthrop & Parke Davis Loose NFDC Full [71]
Hamour-2005 71 Sudan 6-59 12 & 30 Sanofi & Park-Davis Loose NFDC Full [72]
Hasugian-2007 93 Indonesia >12 12 & 30 Guilin Pharmaceuticals & Aventis Loose NFDC Full [6]
Jullien-2010 27 Kenya 216-720 N/A Sanofi-Aventis Co-blistered NFDC Full [73]
Jullien-2010 24 Kenya 216-720 12 & 30 Sanofi-Aventis FDC Full [73]
Juma-2005d 201 Kenya 6-59 12 & 30 Sanofi-Aventis Loose NFDC Full [Unpublished]
Karema-2006 251 Rwanda 12-59 12 & 30 Sanofi-Aventis Loose NFDC Full [74]
Kayentao-2009 128 Mali 6-59 12 & 30 - Co-blistered NFDC Full [75]
Laminou-2011d 80 Niger 6-180 12 & 30 Sanofi-Aventis FDC Partial [Unpublished]
Mårtensson-2005 202 Tanzania 6-59 12 & 30 Mepha & Roussel Loose NFDC Full [45]
Menan-2012d 110 Ivory Coast 12-480 12 & 30 Sanofi-Aventis FDC Full [Unpublished]
Menard-2008 332 Madagascar 6-180 12 & 30 - Loose NFDC Full [76]
Ndiaye-2009 625 Multicentric All ages 12 & 30 Sanofi-Aventis FDC Full [30]
Ndiaye-2011 179 Senegal All ages 12 & 30 Sanofi-Aventis FDC Fullf [32]
Nikiema-2010d 527 Burkina Faso 6-120 12 & 30 Sanofi-Aventis FDC Full [Unpublished]
Osorio-2007 37 Columbia 12-780 12 & 30 Sanofi-Aventis Loose NFDC Full [77]
Rwagacondo-2004 157 Rwanda 6-59 12 & 30 Dafra Loose NFDC Full [11]
Sagara-2012 230 Mali ≥6 12 & 30 Sanofi-Aventis Co-blistered NFDC Full [78]
Sanofi-2013d 203 Uganda 6-59 12 & 30 Sanofi-Aventis FDC Fullf [Unpublished]
The W or ldWi de Anti ma lari al Re sistance N e two rk (WWA R N) A S -A Q S tu dy Gro u p BM C M ed ic in e (2015) 13:66 Page 5 of 19
Table 1 Studies included in the meta-analysis (Continued)
Schramm-2013 147 Liberia 6-72 12 & 30 Sanofi-Aventis FDC Full [38]
Sinou-2009c 13 Congo ≥192 12 & 30 Saokim Pharmaceuticals Co FDC Full [31]
Sirima-2009b 441 Burkina Faso 6-59 12 & 30 Sanofi-Aventis Co-blistered NFDC Full [18]
Sirima-2009b 437 Burkina Faso 6-59 12 & 30 Sanofi-Aventis FDC Full [18]
Smithuis-2010 142 Myanmar >6 12 & 32/4 Sanofi-Aventis FDC Partial [7]
Staedke-2004 130 Uganda 6-120 12 & 25 Sanofi-Pfizer Loose NFDC Full [79]
Swarthout-2006 82 DRC 6-59 12 & 30 Sanofi and Parke Davis & Pfizer Loose NFDC Full [80]
Temu-2010d 99 Liberia 6-60 12 & 30 Sanofi-Aventis FDC Full [Unpublished]
The 4ABC StudyGroup-2011 981 Multicentric 6-59 12 & 30 Sanofi-Aventis FDC Full [15]
Thwing-2009 101 Kenya 6-59 12 & 25 Cosmo Pharmaceuticals & Pfizer Loose NFDC Full [46]
van den Broek-2006 87 Congo 6-59 12 & 30 Cosmo Pharmaceuticals & Pfizer Loose NFDC Full [81]
Yeka-2005 714 Uganda ≥6 12 & 25 Sanofi-Pfizer Loose NFDC Full [82]
a
Full details of the references and study design are available in Additional file1: Text S1.
b
The dose was given based on age bands for these studies. For the rest of the studies, dosing was based on weight categories.
c
All patients recruited given 2 doses/day.
d
These studies are unpublished.
e
Fully supervised between 2002-2004 and partially supervised in 2005.
f
The first episodes of malaria were fully supervised in these studies.
The W or ldWi de Anti ma lari al Re sistance N e two rk (WWA R N) A S -A Q S tu dy Gro u p BM C M ed ic in e (2015) 13:66 Page 6 of 19
the AS dose (4 mg/kg/day) was similar over the three
days (Additional file 1: Text S1).
Baseline characteristics
The patient baseline characteristics are summarised in
Table 3. Overall 8.6% (783/9,106) of patients were less
than one year of age, 62.1% (5,653/9,106) were from 1 to
5 years of age, 16.9% (1,535/9,106) from 5 to 12 years
and 12.5% (1,135/9,106) 12 years or older. The overall
median age was 3.0 years [IQR: 1.8-6.0, range: 0.0-80.0],
with patients from Africa being significantly younger
(median 3.0 years, [IQR: 1.7-5.0, range: 0.0-80.0]) than
those from Asia (median 17.0 years, [IQR: 8.0-28.0,
range: 0.6-80.0] or South America (median 20.0 years,
[IQR: 16-25, range: 8.0-58.0]) (Table 2). At
enrol-ment, 56.6% (3,908/6,906) of the patients were anemic
(Hb < 10 g/dl) and 11% (527/4,796) had patent
gametocy-temia based on blood smears, with significant regional
differences (Table 3).
Distribution of AQ and AS dosing
Overall, the median dose of AQ was 32.1 mg/kg [IQR:
25.9-38.2], with the highest AQ doses administered to
patients treated with co-blistered NFDC and the lowest
to those administered loose NFDC-25. The latter group
received a median dose of 25 mg/kg [IQR: 22.7-25.0],
which was significantly lower than the dose received
in the FDC (median = 32.4 mg/kg [IQR: 27.0-39.0])
(P < 0.001) and co-blistered NFDC (median = 35.3 mg/kg
[IQR: 30.6-43.7]) (P < 0.001) groups. Patients treated with
loose NFDC-30 received a median dose of 33.7 mg/kg
[IQR: 30.6-38.1], similar to that received by patients
treated with FDC, but significantly lower compared to
patients treated with co-blistered NFDC (P < 0.001).
Patients younger than 1 year received a lower dose of
AQ (median = 28.9 mg/kg [IQR: 25.0-35.1]) compared to
the other age categories (P < 0.001 for all comparisons),
except for the patients treated with loose NFDC-30, for
whom the dose was similar across the different age
groups (P = 0.91) (Table 3). All patients (3,711
treat-ments) treated with loose NFDCs were dosed based on
body weight; 85% (3,502/4,138) of patients receiving FDC
were dosed based on body weight and 15% (636/4,138)
based on age; and 69% (872/1,257) of patients treated
with co-blistered NFDC were dosed based on body
weight and 31% (385/1,257) based on age. Overall, only
3.4% (309/9,106) of patients received a total AQ dose
below 22.5 mg/kg, the lower bound of the currently
rec-ommended WHO therapeutic range (22.5 to 45 mg/kg
over three days) [27], most of whom (68%, 211/309) were
treated with loose NFDC-25. The proportion of patients
receiving an AQ dose below this threshold was 16.3%
(211/1,293) in those treated with loose NFDC-25, 1.7%
(41/2,418) in those treated with loose NFDC-30, 1.1%
(45/4,138) in those treated with FDC and 0.9% (12/1,257)
in those treated with co-blistered NFDC. The overall
median dose of AS administered was 12.5 mg/kg [IQR:
10.7-13.6], which was similar across diverse formulations
and age categories (Table 4 and Figure 2).
Early parasitological response
Overall, the early parasitological response to treatment
was rapid in those studies. The PPR decreased from
64.7% [95% CI: 58.5-71.0%] on day 1 to 7.1% [95% CI:
5.2-9.0%] on day 2 and 1.0% [95% CI: 0.6-1.4%] on day 3
(Table 1 in Additional file 6: Text S6). High baseline
parasitemia was the only independent risk factor
associ-ated with remaining parasitemic on day 1, day 2 and day
3 (Table 2 in Additional file 6: Text S6). The overall mg/kg
dose of AS was not a significant predictor of parasite
posi-tivity on any day for any drug formulation, either in the
overall population or in young children.
Late parasitological response
In total, 18.2% (1,657/9,106) of the patients had
parasit-emia detected during follow-up, of whom 295 (3.2%)
were confirmed as recrudescences. Of these
PCR-confirmed recrudescences, 276 (93.6%) occurred by day
28 and the remaining 19 (6.4%) between days 28 and 42.
The PCR-adjusted clinical efficacy was significantly
higher at day 28 in patients treated with FDC (98.1%
[95% CI: 97.6-98.5%]) or co-blistered NFDC (97.9% [95%
CI: 97-98.8%]) compared to patients treated with either
loose NFDC-30 (95.0% [95% CI: 94.1-95.9%]) or loose
NFDC-25 (93.4% [95% CI: 91.9-94.9%]); (P < 0.001 for all
comparisons) (Table 5, Figure 3). At day 28, the efficacy
was lowest in infants (<1 year) treated with loose
NFDC-25 (90.9% [95% CI: 85.6-96.1%]). In this age
cat-egory the efficacy of loose NFDC-30 was 93.8% [95% CI:
90.7-96.8] at day 28 and 85.7% [95% CI: 76.6-94.9%] at
day 42.
Risk factors for recrudescence
In univariable analysis, five risk factors on admission
were associated with PCR-confirmed recrudescence
Table 2 Tablet strengths of the different formulations
Formulation Tablet strength
Pediatric formulation Adult formulation AQ AS AQ AS Loose NFDC - - 200 mg 50 mg Co-blistered NFDC - - 153 mg 50 mg FDC (Trimalact®) - - 300 mg 100 mg FDC (Coarsucam®/Winthrop®) 67.5 mg 25 mg 270 mg 100 mg 135 mg 50 mg
by day 28: being under 5 years compared to
≥12 years
of age, high baseline parasitemia, baseline anemia
(Hb < 10 g/dl), and being treated with either loose
NFDC-25 or loose NFDC-30 (compared to FDC).
There was no significant difference in the efficacy
be-tween co-blistered NFDC and FDC (P = 0.950). In
multi-variable analysis, high baseline parasitemia (AHR = 1.39
[95% CI: 1.10-1.74]; P = 0.005 per 10-fold increase),
being <1 year old (AHR = 3.93 [95% CI: 1.76-8.79];
P = 0.001 compared to ≥ 12 years), and being 1 to
5 years old (AHR = 4.47 [95% CI: 2.18-9.19]; P < 0.001
compared to
≥ 12 years) were significant risk factors for
recrudescence. Patients treated with loose NFDC-25 were
at 3.5-fold increased risk of recrudescence (AHR = 3.51
[95% CI: 2.02-6.12]; P < 0.001) compared to patients
treated with FDC. This category accounted for a quarter
(PAR = 25.8%) of all recrudescent infections (Table 6).
Patients treated with loose NFDC-30 were not at higher
risk of recrudescence compared to patients treated with
FDC (Table 6). However, a higher risk of recrudescence
was observed in patients treated with loose NFDC-30 in
three study sites, in Kenya (Kisumu, n = 201), Sierra
Leone (Kailahun, n = 123) and Rwanda (Rukara, n = 137)
(AHR = 7.75 [95% CI: 4.07-14.76]; P < 0.001, compared to
FDC) (Figure 3). Patients from Asia were at seven fold
in-creased risk of recrudescence compared to patients from
Africa (AHR = 7.39 [95% CI: 3.45-15.86]; P < 0.001). The
final model accounted for 92.6% of all recrudescences,
with patients 1 to 5 years of age accounting for over
two-thirds of all failures, PAR = 69% (Table 6).
Table 3 Patient characteristics at baseline
Variable Asia Africa South Americaa Overall
N 434 (4.77%) 8635 (94.83%) 37 (0.41%) 9106
Study period 2005-2009 1999-2012 2000-2004 1999-2012
Gender
Female 38.7% [168/434] 47.0% [4,060/8,635] 18.9% [7/37] 46.5% [4,235/9,106]
Age
Median age [IQR, range] in years 17 [8-28,0.6-80] 3 [1.7-5,0-80] 20 [16-25,8-58] 3 [1.8-6, 0-80]
<1 y 0.2% [1/434] 9.1% [782/8,635] 0.0% [0/37] 8.6% [783/9,106] 1 to <5 y 7.8% [34/434] 65.1% [5,619/8,635] 0% [0/37] 62.1% [5,653/9,106] 5 to <12 y 25.3% [110/434] 16.5% [1,421/8,635] 10.8% [4/37] 16.9% [1,535/9,106] ≥12 y 66.6% [289/434] 9.4% [813/8,635] 89.2% [33/37] 12.5% [1,135/9,106] Treatment supervisionb Full 67.3% [292/434] 95.1% [8,212/8,635] 100.0% [37/37] 93.8% [8,541/9,106] Partial 32.7% [142/434] 4.9% [423/8,635] 0.0% [0/37] 6.2% [565/9,106] Drug formulation
Fixed dose combination (FDC) 78.6% [341/434] 44.0% [3,797/8,635] 0.0% [0/37] 45.4% [4,138/9,106]
Co-blistered non-fixed dose combination (co-blistered NFDC) 0.0% [0/434] 14.6% [1,257/8,635] 0.0% [0/37] 13.8% [1,257/9,106] Loose non-fixed dose combination: target dose 25 mg/kg
(loose NFDC-25)
0.0% [0/434] 15.0% [1,293/8,635] 0.0% [0/37] 14.2% [1,293/9,106] Loose non-fixed dose combination: target dose 30 mg/kg
(loose NFDC-30)
21.4% [93/434] 26.5% [2,288/8,635] 100.0% [37/37] 26.6% [2,418/9,106] Enrolment clinical variables
Geometric mean parasitemia [95% CI] in parasites/μl 8,504 [7,409-9,761] 19,508 [18,944-20,089] 80 [55-116] 18,338 [17,801-18,891]
Median weight [IQR, range] in kg 40 [20-50,7-72] 12 [10-17, 5-104] 59 [47-65,24-80] 12.7 [10-18, 5-104]
Underweight for agec 37.1% [13/35] 20.6% [1,248/5,821] - 20.7% [1,297/6,269]
Anemic (hb < 10 g/dl)d 34.3% [149/434] 59% [3,754/5,821] 13.5% [5/37] 56.6% [3,908/6,906]
Gametocytes presencee 39.4% [56/142] 10.0% [462/5,821] 24.3% [9/37] 11.0% [527/4,796]
Fever (temp > 37.5 °C) 77.7% [227/292] 66.4% [5,769/5,821] 16.2% [6/37] 68.5% [6,002/8,766]
Hemoglobin [mean ± SD] in g/dl 10.9 ± 2.29 9.5 ± 2.06 12.06 ± 1.93 9.6 ± 2.11
a
Single study from Columbia. b
Treatment supervision: The treatment was fully supervised if each dose of the three-day regimen was administered by a nurse/or any other medical staff. The treatment was partially supervised if only the dose on the first day was administered by medical staff, the dose on day 2 and day 3 being self-administered by the patients or the parents/guardians.
c
Defined using a weight-for-age score (WAZ) < -2 in children <5 years of age. WAZ scores outside the range (-6.6) were treated as outliers. d
Asia v Africa (P = 0.005), Asia v South America (P = 0.438) and Africa v South America (P = 0.042). e
Asia v Africa (P < 0.001), Asia v South America (P = 0.236) and Africa v South America (P = 0.308).
Safety parameters
Neutrophil counts were available from five studies (516
treatments), with neutropenia reported in 27 (5.2%)
patients at enrolment. In 489 patients with normal
neutrophil counts at enrolment, 21.1% (103/489) developed
neutropenia (defined as
≤1,200 neutrophils/μl for <12 years
and
≤1,500 neutrophils/μl for ≥12 years) within 28 days of
follow-up. After adjusting for age and drug formulation,
there was no dose-dependent risk of neutropenia (Table 5
in Additional file 6: Text S6).
Data on hemoglobin was available in 33 studies (6,574
treatments), with 57% (3,756/6,574) of the patients
anemic at enrolment. Follow-up data were available in
90% (2,557/2,818) of the patients who were not anemic
at baseline. In total 23% (590/2,557) developed anemia
within 28 days of the follow-up. After adjusting for age
category, drug formulation and baseline parasitemia,
there was no relationship between drug dose and anemia
(Table 5 in Additional file 6: Text S6).
Vomiting within an hour of treatment administration
was reported in 12.5% (294/2,351) from seven studies,
with the proportion highest in infants <1 year (21.4%,
27/126) and lowest in those 12 years of age or older
(4%, 11/278). Data on vomiting within 7 days of treatment
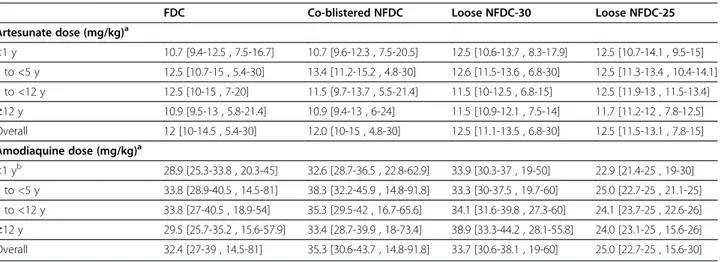
Table 4 Total mg/kg dose administered (median [IQR, (range)]) for artesunate and amodiaquine
FDC Co-blistered NFDC Loose NFDC-30 Loose NFDC-25
Artesunate dose (mg/kg)a <1 y 10.7 [9.4-12.5 , 7.5-16.7] 10.7 [9.6-12.3 , 7.5-20.5] 12.5 [10.6-13.7 , 8.3-17.9] 12.5 [10.7-14.1 , 9.5-15] 1 to <5 y 12.5 [10.7-15 , 5.4-30] 13.4 [11.2-15.2 , 4.8-30] 12.6 [11.5-13.6 , 6.8-30] 12.5 [11.3-13.4 , 10.4-14.1] 5 to <12 y 12.5 [10-15 , 7-20] 11.5 [9.7-13.7 , 5.5-21.4] 11.5 [10-12.5 , 6.8-15] 12.5 [11.9-13 , 11.5-13.4] ≥12 y 10.9 [9.5-13 , 5.8-21.4] 10.9 [9.4-13 , 6-24] 11.5 [10.9-12.1 , 7.5-14] 11.7 [11.2-12 , 7.8-12.5] Overall 12 [10-14.5 , 5.4-30] 12.0 [10-15 , 4.8-30] 12.5 [11.1-13.5 , 6.8-30] 12.5 [11.5-13.1 , 7.8-15] Amodiaquine dose (mg/kg)a <1 yb 28.9 [25.3-33.8 , 20.3-45] 32.6 [28.7-36.5 , 22.8-62.9] 33.9 [30.3-37 , 19-50] 22.9 [21.4-25 , 19-30] 1 to <5 y 33.8 [28.9-40.5 , 14.5-81] 38.3 [32.2-45.9 , 14.8-91.8] 33.3 [30-37.5 , 19.7-60] 25.0 [22.7-25 , 21.1-25] 5 to <12 y 33.8 [27-40.5 , 18.9-54] 35.3 [29.5-42 , 16.7-65.6] 34.1 [31.6-39.8 , 27.3-60] 24.1 [23.7-25 , 22.6-26] ≥12 y 29.5 [25.7-35.2 , 15.6-57.9] 33.4 [28.7-39.9 , 18-73.4] 38.9 [33.3-44.2 , 28.1-55.8] 24.0 [23.1-25 , 15.6-26] Overall 32.4 [27-39 , 14.5-81] 35.3 [30.6-43.7 , 14.8-91.8] 33.7 [30.6-38.1 , 19-60] 25.0 [22.7-25 , 15.6-30] a
The overall median mg/kg amodiaquine dose administered was 32.1 mg/kg [IQR = 25.9-38.2, range = 14.5-91.8]. The overall median mg/kg artesunate dose administered was 12.5 mg/kg [IQR = 10.7-13.6, range = 4.8-30]. b
In children <1 year, the overall median mg/kg amodiaquine dose administered was 28.9 mg/kg [IQR = 25-35.1, range = 18.9-62.7].
Figure 2 Total mg/kg dose for artesunate (A) and amodiaquine (B). The dotted line represents the WHO therapeutic dose range for artesunate (6 to 30 mg/kg) and amodiaquine (22.5 to 45 mg/kg).
Table 5 PCR-corrected adequate clinical and parasitological response (ACPR) of artesunate-amodiaquine
Survival estimates on day 28a, b Survival estimates on day 42a, b
FDC Co-blistered NFDCc Loose NFDC-30 Loose NFDC-25c FDC Loose NFDC-30
Age category At risk K-M [95% CI] At risk K-M [95% CI] At risk K-M [95% CI] At risk K-M [95% CI] At risk K-M [95% CI] At risk K-M [95% CI] <1 y 207 97.8 [95.9-99.7] 77 98.7 [96.3-100] 222 93.8 [90.7-96.8] 95 90.9 [85.6-96.1] 42 95.6 [90.9-100] 28 85.7 [76.6-94.9] 1 to <5 y 2,044 97.9 [97.3-98.5] 511 96.9 [95.4-98.3] 1,340 94 [92.8-95.2] 532 92.2 [90.2-94.2] 325 95.7 [94-97.3] 103 92.5 [90-94.9] 5 to <12 y 565 98.1 [97-99.2] 192 98.6 [97-100] 317 98.8 [97.5-100] 211 97.4 [95.3-99.5] 65 95.4 [91.6-99.2] 15 98.8 [97.5-100] ≥12 y 570 98.6 [97.6-99.5] 203 99.6 [98.9-100] 140 98.6 [96.7-100] 31 100 [88.9-100.0]d 142 97.9 [96.3-99.5] 34 93.2 [86.2-100] Region West Africa 2,167 98.1 [97.6-98.7] 959 97.8 [96.9-98.7] 337 94.9 [92.6-97.2] - - 257 95.3 [93.3-97.3] - -East Africa 299 98.9 [97.8-100] 24 100 [100-100] 921 92.8 [91.2-94.4] 869 93.4 [91.9-94.9] 81 98.9 [97.8-100] 127 89.5 [86.3-92.7] Rest of Africa 615 98.6 [97.8-99.5] - - 664 98.3 [97.3-99.2] - - 124 97.1 [94.8-99.4] - -Asia 305 95.5 [93.2-97.7] - - 69 93.2 [87.5-99] - - 112 93.8 [90.7-97] 53 90.2 [83.3-97.1] S America - - - - 30 100 [88.7-100]d - - - -Overall 3,386 98.1 [97.6-98.5] 983 97.9 [97-98.8] 2,021 95 [94.1-95.9] 869 93.4 [91.9-94.9] 574 96.1 [95-97.3] 180 92.1 [89.8-94.4] a
Kaplan-Meier estimates were generated using all the individual data rather than combining estimates from individual trials. n is the number of patients at risk (n) on day 28.
b
Pairwise comparisons at day 28 using the Mantel-Haenszel (log-rank ) test. FDC v co-blistered NFDC (P = 0.799). FDC v loose NFDC-30 (P < 0.001). FDC v loose NFDC-25 (P < 0.001). Co-blistered NFDC v loose NFDC-30 (P < 0.001). Co-blistered NFDC v loose NFDC-25 (P < 0.001). Loose NFDC-30 v loose NFDC-25 (P = 0.036). c
Patients followed up only up to 28 days.
d
Exact confidence intervals using Wilson’s method using number of patients at risk on the given day.
The W or ldWi de Anti ma lari al Re sistance N e two rk (WWA R N) A S -A Q S tu dy Gro u p BM C M ed ic in e (2015) 13:66 Page 10 of 19
were available in 12 studies (3,721 treatments); this
oc-curred in 11% (410/3,721) of the patients. In 12 studies
where data for diarrhea were available, 7.6% (290/3,821)
reported at least one episode of diarrhea within a week
after treatment (Table 7). After controlling for age and
drug formulation, the AQ dose was associated with
increased risk of diarrhea (adjusted odds ratio, AOR = 1.16
[95% CI: 1.07-1.24]; P < 0.001), vomiting (AOR = 1.20
[95% CI: 1.11-1.29]; P < 0.001) and vomiting within
one hour after treatment (AOR = 1.23 [95% CI:
1.11-1.36]; P < 0.001) for every 5 mg/kg increase (Table 5
in Additional file 6: Text S6).
Figure 3 Day 28 survival estimates. PCR adjusted recrudescence estimates on day 28 were generated using Kaplan-Meier method stratified by study sites for loose NFDC-25 [red], loose NFDC-30 [orange], co-blistered NFDC [green] and FDC [blue]. The associated error bars are 95% confidence interval (CI) for survival estimates. 95% CIs were generated using Wilson’s method in case of no failures using the number of patients at risk on day 28. Unpublished studies are represented by *. ** The risk of recrudescence by day 28 was significantly higher in three study sites (Kailahun (Sierra Leone), Kisumu (Kenya) and Rukara (Rwanda)), where patients were treated with loose NFDC-30 compared to the other study sites in the loose NFDC-30 category (hazards ratio (HR) = 6.27 [95% CI:2.40-16.32], P < 0.001). Patients treated with loose NFDC-30 in these three sites were at higher risk of recrudescence (HR = 8.40 [95% CI: 3.23-21.83], P < 0.001) compared to patients treated with FDC and those treated with co-blistered NFDC (HR = 8.22 [95% CI: 2.66-25.40], P < 0.001). The risk of recrudescence was similar between patients treated with loose NFDC-30 in the other sites compared to those treated with FDC (HR = 1.34 [95% CI: 0.77-2.34]; P = 0.300) or co-blistered NFDC (HR = 1.31 [95% CI: 0.59-2.87], P = 0.500). All the HR was derived from univariable Cox model with study sites fitted as random effect.
Table 6 Univariable and multivariable risk factors for PCR-confirmed recrudescent failures at day 28
Univariable analysis Multivariable analysisb Population attributable riskc
(N = 9,058)
Variable Totaln [n]a Crude HR [95% CI]
p-Value Adjusted HR [95% CI] P-Value Freq. PAR
Age (y) 9,095 (265) 0.92 [0.89-0.96] <0.001 - - -
-Amodiaquine dose (5 mg/kg) 9,095 (265) 0.94 [0.84-1.04] 0.220 0.94 [0.84-1.05] 0.280 -
-Enrolment clinical variables
Parasitemia (per 10-fold) 9,095 (265) 1.46 [1.16-1.84] 0.001 1.39 [1.1-1.74] 0.005 10.4% 3.7%
Parasitemia >100,000 parasites/μl 9,095 (265) 1.41 [0.98-2.05] 0.066 - - - -Fever (temp > 37.5°C) 8,755 (252) 1.05 [0.78-1.41] 0.760 - - - -Hemoglobin (g/dl) 6,895 (237) 0.93 [0.87-1.00] 0.055 - - - -Anemia (Hb < 10 g/dl) 6,895 (237) 1.37 [1.04-1.81] 0.028 - - - -Gametocytes presence 4,790 (99) 1.04 [0.54-1.98] 0.910 - - - -Underweight (WAZ <−2)d 6,260 (616) 0.87 [0.61-1.26] 0.470 - - - -Gender Female (reference) 4,231 (126) 1 - - - - -Male 4,702 (124) 0.91 [0.71-1.16] 0.450 - - - -Age category ≥12 y (reference) 1,135 (12) 1 - - - - -<1 y 782 (31) 3.15 [1.46-6.78] 0.004 3.93 [1.76-8.79] 0.001 8.6% 20.9% 1 to <5 y 5,645 (199) 3.62 [1.83-7.18] <0.001 4.47 [2.18-9.19] <0.001 62.3% 69.2% 5 to <12 y 1,533 (23) 1.90 [0.91-3.98] 0.088 2.03 [0.96-4.28] 0.064 16.9% 15.1% Drug formulation FDC (reference) 4,135 (70) 1 - - - - -Co-blistered NFDC 1,256 (21) 1.02 [0.52-2.00] 0.950 1.38 [0.75-2.57] 0.300 13.9% 5.1% Loose NFDC-25 1,291(70) 3.62 [1.79-7.30] <0.001 3.51 [2.02-6.12] <0.001 14.3% 25.8% Loose NFDC-30e In Rukara/Kailahun/Kisumuf 461 (59) 8.41 [3.24-21.84] <0.001 7.75 [4.07-14.76] <0.001 5.1% 26.3%
Rest of the sites 1,952 (45) 1.34 [0.77-2.34] 0.300 1.47 [0.91-2.38] 0.110 21.1% 8.3%
Treatment supervision
Fully supervised (reference) 8,530 (245) 1 - - - -
-Partially supervised 565 (20) 1.37 [0.45-4.17] 0.580 - - - -Parasite clearance Day3 Parasitemia 8,788 (252) 2.17 [0.88-5.35] 0.092 - - - -The W or ldWi de Anti ma lari al Re sistance N e two rk (WWA R N) A S -A Q S tu dy Gro u p BM C M ed ic in e (2015) 13:66 Page 12 of 19
Table 6 Univariable and multivariable risk factors for PCR-confirmed recrudescent failures at day 28 (Continued)
Region Africa (reference)g 8,624 (245) 1 - - - - -Asia 434 (20) 1.27 [1.83-3.55] 0.700 7.39 [3.45-15.86] <0.001 4.8% 21.6% S. Americah 37 (0) - - - -aNumber of patients [n] for each variable/levels of factor with number of PCR-confirmed recrudescence [n] by day 28.
b
Variance of the random effect = 0.22. Adding hemoglobin (AHR = 0.94 [95% CI: 0.88-1.02]; P = 0.064), day 3 parasite positivity (AHR = 2.04 [95% CI:0.83-5.00]; P = 0.107) to a model containing age, parasitemia, AQ dose, region and formulation led to a non-significant likelihood ratio test, and hence those variables were not kept for multivariable analysis. Although anemia (AHR = 1.35 [95% CI: 1.02-1.78]; P = .034) was found to be significant, a large proportion of patients had missing values. Hence, random imputation was performed for anemia, hemoglobin and gametocytemia, which showed that they were not significant in the presence of other variables (Additional file6: Text S6, Figure1). To examine the robustness of the parameter estimates, a sensitivity analysis was carried out by removing one study site at a time which showed that the overall coefficient of variation of parameter estimates in the multivariable model was small (all CV <10%) (Additional file6: Text S6, Table3).
c
Overall PAR for model = 92.6%.
d
Underweight for age defined only in children < 5 years.
e
Compared to FDC, patients treated with loose NFDC-30 were at higher risk of recrudescence (AHR = 2.89 [95% CI: 1.49-5.59]; P = 0.002) when all the sites were combined. Pairwise comparisons.
Co-blistered NFDC v loose NFDC-25 (AHR = 2.50 [95% CI: 1.18-5.44]; P = 0.016).
Co-blistered NFDC v loose NFDC-30 in Rukara/Kailahun/Kisumu (AHR = 5.61 [95% CI: 2.48-12.69]; P < 0.001). Co-blistered NFDC v loose NFDC-30 in rest of the sites (AHR = 1.07 [95% CI: 0.54-2.10]; P = 0.850). Loose NFDC-25 v loose NFDC-30 in Rukara/Kailahun/Kisumu (AHR = 2.21 [95% CI: 1.03-4.71]; P = 0.041). Loose NFDC-25 v loose NFDC-30 in rest of the sites (AHR = 0.42 [95% CI: 0.23-0.77]; P = 0.005).
f
The test for proportional hazards did not hold true for this category. The overall assumption of proportional hazards held true globally and individually for each of the covariates when these three sites were excluded from the model. The coefficients of the remaining model parameters were similar with and without these three sites kept in the model. The assumption of proportionality was tested for each of the studies separately with at least five failures (Additional file6: Text S6, Table3) and found to be satisfactory.
g
Within Africa, there were no differences between East and West Africa: AHR = 1.14 [0.62-2.15]; P = 0.690.
h
Hazards ratio could not be estimated as there were no PCR-confirmed failures in South America.
The W or ldWi de Anti ma lari al Re sistance N e two rk (WWA R N) A S -A Q S tu dy Gro u p BM C M ed ic in e (2015) 13:66 Page 13 of 19
Discussion
We collated individual patient data from 43 studies of
antimalarial therapy with AS-AQ, including more than
9,000 patients recruited between 1999 and 2012. The
data were derived predominantly from studies
con-ducted in sub-Saharan Africa, with a wide range of
patient ages, malaria transmission intensities, drug
for-mulations and dosing plans. Three different
formula-tions were included, and all of them were designed to
deliver a total target dose of 12 mg/kg of artesunate
(AS) over three days; however, the total target dose of
amodiaquine (AQ) was 30 mg/kg for FDC and
co-blistered NFDC regimens and 25 or 30 mg/kg for
loose NFDCs. Overall, the efficacy of AS-AQ was high,
but it varied with patient age, formulation and target
dose. The efficacy was similar between FDC and
co-blistered NFDC, but significantly lower in patients
treated with loose NFDCs, and lowest in those treated
with an AQ target dose of 25 mg/kg. The efficacy was
especially low in infants younger than 1 year treated
with all loose NFDCs; below 95% at day 28 and <90%
by day 42.
As observed with other ACTs, high baseline
parasit-emia and young age were significant risk factors for
treatment failure, likely explained by the lower immunity
in children less than 5 years of age, associated with
hyperparasitemia [20,28,29]. However, after controlling
for these two confounders, patients treated with the
loose NFDC with a target dose of 25 mg/kg were at
3.5-fold greater risk of treatment failure compared to those
treated with FDC. In contrast to the variable outcomes
among the studies administering loose NFDC, those
using the fixed dose combinations reported consistently
good AS-AQ efficacy in geographically diverse sites
[15,16,18,30-38], with the exception of one study
con-ducted in Myanmar [7].
Several factors could explain the difference in
effi-cacies between the different AS-AQ formulations.
The lower efficacy in patients treated with the loose
NFDC-25, especially in infants younger than 1 year, is
likely to reflect the lower overall dose of AQ
adminis-tered compared to other patients in this meta-analysis
who received a target AQ dose of 30 mg/kg for all other
formulations. Moreover, infants <1 year treated with
loose NFDC-25 received the lowest AQ dose, which
could explain the lower efficacy in this age category.
However, due to the limited number of failures in this
age group, the dose effect was not apparent in this
meta-analysis. The need to split tablets in the loose NFDC
regi-mens could also have contributed to dosing inaccuracy,
particularly in young patients, with diminished treatment
efficacy in those under-dosed with AQ [39]. Indeed, our
results show that even though patients treated with loose
NFDC-30 received the same AQ target dose (30 mg/kg)
as the patients treated with FDC, the efficacy was still
higher in the FDC group. The dosage of the fixed dose
Table 7 Table of adverse events
Neutropeniaa, bbetween day 1 and day 28
Anemiaa, bbetween day 1 and day 28
Diarrhea between day 1 and day 7
Vomitingcbetween day 1 and day 7
Acute drug vomiting AQ dose category (mg/kg)d <25 7.0% (5/71) 19.3% (79/410) 4.7% (11/232) 9.3% (24/258) 4.7% (10/214) 25 to <30 20.4% (33/162) 24.1% (190/787) 6.5% (56/857) 9.7% (81/838) 12.9% (80/622) 30 to <35 17.9% (21/117) 21.3% (132/621) 5.8% (55/955) 9.9% (92/933) 11.3% (55/486) 35 to <40 35.3% (30/85) 24.8% (96/387) 7.1% (49/693) 11.3% (74/656) 12.5% (54/433) 40 to <45 30.8% (8/26) 26.9% (58/216) 7.4% (43/580) 13.9% (76/546) 14.7% (62/423) ≥45 21.4% (6/28) 25.7% (35/136) 15.1% (76/504) 12.9% (63/490) 19.1% (33/173) Age category <1 y 30.0% (15/50) 49.6% (64/129) 18.4% (52/282) 6.6% (19/287) 21.4% (27/126) 1 to <5 y 17.3% (44/255) 28.0% (437/1,558) 7.4% (189/2,565) 8.7% (228/2,611) 13.9% (230/1,655) 5 to <12 y 13.3% (14/105) 12.4% (50/402) 3.2% (16/505) 15.8% (69/436) 8.9% (26/292) ≥12 y 38.0% (30/79) 8.3% (39/468) 7.0% (33/469) 24.3% (94/387) 4.0% (11/278) Overall 21.1% (103/489) 23.1% (590/2,557) 7.6% (290/3,821) 11.0% (410/3,721) 12.5% (294/2,351) a
Presented only for patients without neutropenia/anemia at baseline. b
Neutropenia defined as≤1,200 neutrophils/μl for <12 years and ≤1,500 neutrophils/μl for ≥12 years. Anemia defined as hemoglobin < 10 g/dl. c
Excludes acute drug vomiting within an hour of treatment administration. d
After adjusting for age category and formulation, AOR = 1.17 [95% CI: 0.95-1.46]; P = 0.144 for the risk of neutropenia for every 5 mg/kg increase in AQ dose. d
After adjusting for age category and formulation, AOR = 1.16 [95% CI: 1.07-1.24]; P < 0.001 for the risk of diarrhea for every 5 mg/kg increase in AQ dose. d
After adjusting for age category and formulation, AOR = 1.20 [95% CI: 1.11-1.29]; P < 0.001 for the risk of general vomiting for every 5 mg/kg increase in AQ dose.
d
After adjusting for age category and formulation, AOR = 1.23 [95% CI: 1.11-1.36]; P < 0.001 for the risk of acute vomiting for every 5 mg/kg increase in AQ dose.
combination of AS-AQ was developed using a
weight-for-age reference database from malaria endemic
countries, to ensure optimal dosing with the pediatric
formulation [40]. This allows the FDC prescription to
be based either on body weight or age, a notable
ad-vantage, as body weight often cannot be assessed
eas-ily or accurately in health facilities of many malaria
endemic countries. A formulation that can be applied
ei-ther by weight- or age-based criteria probably increases
dosing accuracy, and the availability of different tablet
strengths, including a pediatric formulation, obviates the
need for tablet splitting, reduces the pill burden and
po-tentially improves adherence [18,41]. The effects on AQ
drug concentrations of manufacturer, formulation, age,
nutritional status and dosage schedule are currently
being evaluated in a separate WWARN amodiaquine
PK-PD analysis [42].
In this meta-analysis, AS-AQ efficacy was particularly
low in three sites in Rwanda, Sierra Leone and Kenya
using loose NFDC with a target AQ dose of 30 mg/kg.
Based on the concomitant high failure rates for AQ
monotherapy in those sites, AQ resistance was suggested
to be a main factor contributing to poor treatment
out-comes [11,43,44]. Moreover, patients from Asia were at
seven times greater risk of treatment failure compared
to patients from Africa, suggesting also that resistance
could be responsible for the higher risk of treatment
fail-ure in Asia [7,14]. There has been concern that the
effi-cacy of AS-AQ has been compromised by antimalarial
resistance to AQ [7-11,44-46]. Parasites carrying the
76 T allele of pfcrt are associated with lower
susceptibil-ity to AQ, and these parasites are now highly prevalent
in most endemic areas [47-52]. Increasing prevalence of
the pfcrt SVMNT haplotype in some endemic areas has
also been associated with AQ use [12-14,53,54].
Resist-ance has also been invoked to explain the relatively high
risks of failure for loose NFDC in some studies [8,9],
whereas other studies found adequate efficacy of AS-AQ
with this formulation [10,55,56]. Molecular data were
not available for this meta-analysis, and associations
be-tween AQ resistance markers and treatment outcomes
could not be characterised.
Although the primary aim of this analysis was to
investi-gate the effect of AS-AQ dose and formulation on early
and late treatment outcomes, we also investigated the
ef-fect of these factors on safety outcomes. AQ has previously
been associated with neutropenia when taken as a
prophy-laxis [57] and when used in conjunction with antiretroviral
drugs [58]. With limited data, our analysis showed no
rela-tionship between the dose of AQ and neutropenia.
How-ever, a higher AQ dose was associated with increased risk
of gastrointestinal adverse events. A dose-dependent
in-crease in the risk of gastrointestinal adverse events was also
reported with artemether-lumefantrine [59].
Our analysis has a number of limitations. Although
the search was limited to prospective clinical trials
re-corded in PubMed, an additional review of
clinicaltrials.-gov identified that out of the 36 clinical studies
registered testing AS-AQ between 2000 and 2012, 28
(78%) had subsequently been published and most of
them were included in the meta-analysis. Moreover, our
meta-analysis also included seven unpublished clinical
trials that were not registered in clinicaltrials.gov. Hence
our analysis has captured the majority of published data
and constitutes the largest meta-analysis of AS-AQ
undertaken. Furthermore there were no apparent
differ-ences in patient characteristics and outcomes between
the studies included and those which were not available
(Table 6 in Additional file 6: Text S6). In addition, the
model estimates were robust, as a sensitivity analysis
showed that the coefficients of variation for the model
parameters were small and the coefficients from the final
model were similar to the estimates obtained from
boot-strap sampling (Table 3 and Figure 2 in Additional file 6:
Text S6). Another limitation of our study was that the
FDC trials were mainly conducted in West Africa and
those of loose NFDC mainly in East Africa, two regions
with reported varied degrees of AQ resistance [14].
Nonetheless, the overall efficacy of the FDC remained
consistently high in all regions of Africa and in all age
groups. Note that two different FDC formulations with
different dosing schemes were included in the analysis;
however, it was not possible to assess if that difference
could impact on efficacy, as the sample size of one of
the formulations was very small. Whilst reassuring, the
results of the South American data were limited to one
study from Colombia and hence cannot be generalised
across the continent. Finally, the information on the
ac-tual number of tablets administered, which was used to
calculate total drug doses, was available in only 28%
(2,570/9,106) of patients. However, when the method of
dose calculation was added to the model as a covariate,
there was no change in final outcomes.
In summary, this meta-analysis performed with individual
patients data highlighted marked heterogeneity in the
dos-ing of AQ between different AS-AQ formulations. These
findings also allow differentiation of the impact of
formula-tions from resistance affecting AS-AQ efficacy. The fixed
dose combination provided higher efficacy in all age
cat-egories, probably reflecting optimal dosing of AQ. AS-AQ
FDCs are currently available from five different WHO
prequalified manufacturers [60]. In addition to offering
im-proved treatment efficacy, FDCs simplify treatment
regi-mens by reducing the pill burden. A continued concern
with all ACTs is impact of resistance to both components
on treatment efficacy; thus monitoring of molecular
markers associated with resistance to AQ [61,62] and
arte-misinins [63] is warranted for the combination studied here.
The WorldWide Antimalarial Resistance Network (WWARN) AS-AQ Study Group BMC Medicine (2015) 13:66 Page 15 of 19Additional files
Additional file 1: Text S1. References of all AS-AQ clinical trials, their study designs and dosing schedules.
Additional file 2: Text S2. Map of study sites. Additional file 3: Text S3. Transmission classification.
Additional file 4: Text S4. WWARN AS-AQ statistical analytical plan. Additional file 5: Text S5. WWARN clinical data and management statistical analytical plan.
Additional file 6: Text S6. Additional tables and figures. Additional file 7: Text S7. Authors and contributions.
Abbreviations
ACT:artemisinin-based combination therapy; AHR: adjusted hazard ratio; AOR: adjusted odds ratio; AQ: amodiaquine; AS: artesunate; AS-AQ: artesunate-amodiaquine; CI: confidence interval; DMSAP: data management and statistical analytical plan; FDC: fixed dose combination; GLURP: glutamate rich protein; Hb: Hemoglobin; IQR: interquartile range; MSP1: merozoite surface protein 1; MSP2: merozoite surface protein 2; NFDC: non-fixed dose combination; OxTREC: Oxford Tropical Research Ethics Committee; PAR: population attributable risk; PCR: polymerase chain reaction; WHO: World Health Organization; WWARN: WorldWide Antimalarial Resistance Network. Competing interests
Valérie Lameyre and François Bompart are employees of Sanofi. Karen I Barnes, Emiliana Tjitra, Neena Valecha and Nicholas J White are members of the WHO Technical Expert Group on Malaria Chemotherapy. Nicholas J White chaired, Piero Olliaro co-initiated and Jean-Rene Kiechel managed the Drugs for Neglected Diseases initiative FACT project which developed fixed dose artesunate-amodiaquine. Umberto D’Alessandro has received travel funds and study drugs from Sanofi. Piero Olliaro is a staff member of the WHO; the author alone is responsible for the views expressed in this publication and they do not necessarily represent the decisions, policy or views of the WHO. None of the other authors have any conflicts of interest.
Authors’ contributions
MAA RA ARA EAA MSB HBarennes KIB QB EB AB FB MB SB PB HBukirwa FC MC UDA PDeloron MD GD AAD GD OKD EE JFE CIF JFF BFaye OG RG FG PJG JPG SH ARH VJ EJ MRK CK JRK PGK SK VL LMI SJL BL AMårtensson AMassougbodji HM DM CMenéndez MM CNabasumba MN JLN FNikiema FNtoumi BRO PO LO JBO LKP MP LP PP RNP CR PJR CER ASE BSchramm BSharma VS SBS FS FAS DS SGS TDS KSylla AOT WRJT EAT JIT ET RCKT HT MTV NV IV NJW AY IZ conceived and designed the experiments. MAA RA ARA EAA MSB HBarennes QB EB AB FB MB SB PB HBukirwa FC MC UDA PDeloron MD GD AAD GD OKD EE JFE CIF JFF BFaye OG RG FG PJG JPG SH ARH VJ EJ MRK CK JRK PGK SK VL LMI SJL BL AMårtensson AMassougbodji HM DM CMenéndez MM CNabasumba MN JLN FNikiema FNtoumi BRO PO LO JBO MP LP RNP CR PJR CER ASE BSchramm BSharma VS SBS FS FAS DS SGS TDS KSylla AOT WRJT EAT JIT ET RCKT HT MTV NV IV NJW AY IZ enrolled patients. KIB PDahal PJG GSH CMoreira CNsanzabana RNP CHS KStepinewska JT analysed the pooled individual patient data. PDahal KStepniewska performed statistical analysis. JAF PWG SIH contributed to the analysis. AS and JJS contributed to the collection of the different datasets. KIB PDahal PJG CNsanzabana RNP CHS wrote the first draft of the manuscript. All authors read and approved the final manuscript.
Acknowledgements
We thank the patients and all the staff who participated in these clinical trials at all the sites and the WWARN team for technical and administrative support. The WorldWide Antimalarial Resistance Network (WWARN) AS-AQ Study Group: Martin A Adjuik1, Richard Allan2, Anupkumar R Anvikar3, Elizabeth A Ashley4, Mamadou S Ba5, Hubert Barennes6,7, Karen I Barnes8,9, Quique Bassat10,11,
Elisabeth Baudin4, Anders Björkman12, François Bompart13, Maryline Bonnet14, Steffen Borrmann15,16, Philippe Brasseur17, Hasifa Bukirwa18, Francesco
Checchi4, Michel Cot19,20, Prabin Dahal21,22, Umberto D'Alessandro23,24, Philippe Deloron19,20, Meghna Desai25, Graciela Diap26, Abdoulaye A Djimde27,
Grant Dorsey28, Ogobara K Doumbo27, Emmanuelle Espié29, Jean-Francois Etard4,30, Caterina I Fanello22,31, Jean‐François Faucher19,20,32, Babacar Faye5,
Jennifer A Flegg21,33, Oumar Gaye5, Peter W Gething34, Raquel González10,11,
Francesco Grandesso4, Philippe J Guerin21,22*, Jean-Paul Guthmann4, Sally Hamour35, Armedy Ronny Hasugian36, Simon I Hay34, Georgina S Humphreys21,22,
Vincent Jullien37, Elizabeth Juma38, Moses R Kamya39, Corine Karema40, Jean R Kiechel26, Peter G Kremsner41,42, Sanjeev Krishna43, Valérie Lameyre13,
Laminou M Ibrahim44, Sue J Lee22,31, Bertrand Lell41,42, Andreas Mårtensson12,45,46, Achille Massougbodji47, Hervé Menan48, Didier Ménard49, Clara Menéndez10,11,
Martin Meremikwu50, Clarissa Moreira21,22, Carolyn Nabasumba4,51, Michael Nambozi, Jean-Louis Ndiaye5, Frederic Nikiema53, Christian Nsanzabana21,22*,
Francine Ntoumi42,54, Bernhards R Ogutu55, Piero Olliaro22,56, Lyda Osorio57, Jean-Bosco Ouédraogo53,58, Louis K Penali59, Mbaye Pene5, Loretxu Pinoges4,
Patrice Piola60, Ric N Price22,61, Cally Roper62, Philip J Rosenthal28, Claude Emile Rwagacondo63, Albert Same-Ekobo64, Birgit Schramm4, Amadou Seck59, Bhawna
Sharma65, Carol Hopkins Sibley21,66, Véronique Sinou67, Sodiomon B Sirima68, Jeffery J Smith69,70, Frank Smithuis71,72, Fabrice A Somé53, Doudou Sow5,
Sarah G Staedke73,74, Kasia Stepniewska21, Todd D Swarthout75, Khadime Sylla5, Ambrose O Talisuna76,77, Joel Tarning22,31,69, Walter RJ Taylor56,78,
Emmanuel A Temu2,79,80, Julie I Thwing25, Emiliana Tjitra36, Roger CK Tine5, Halidou Tinto53,58, Michel T Vaillant81,82, Neena Valecha3, Ingrid Van
den Broek75,83, Nicholas J White22,31, Adoke Yeka18,84, Issaka Zongo53
1INDEPTH NETWORK Secretariat, Accra, Ghana 2
The MENTOR Initiative, Crawley, UK
3National Institute of Malaria Research, New Delhi, India 4
Epicentre, Paris, France
5Department of Parasitology, Faculty of Medicine, University Cheikh Anta
Diop, Dakar, Senegal
6Unité d'Epidémiologie d'Intervention Centre Muraz, Bobo Dioulasso,
Burkina Faso
7French Foreign Affairs, Biarritz, France
8World Wide Antimalarial Resistance Network (WWARN), Pharmacology
module, Cape Town, South Africa
9Division of Clinical Pharmacology, Department of Medicine, University of
Cape Town, Cape Town, South Africa
10Centro de Investigacao em Saude de Manhiça, Manhiça, Mozambique 11ISGlobal, Barcelona Ctr. Int. Health Res. (CRESIB), Hospital Clínic - Universitat
de Barcelona, Barcelona, Spain
12
Dept Microbiology, Tumor and Cell Biology, Karolinska Institutet, Stockholm, Sweden
13Direction Accès au Médicament / Access to Medicines, Sanofi Aventis,
Gentilly, France
14Epicentre, Geneva, Switzerland
15Institute for Tropical Medicine, University of Tübingen, Tübingen, Germany 16German Centre for Infection Research, Tübingen, Germany
17Institut de Recherche pour le Développement (IRD), Dakar, Sénégal 18Uganda Malaria Surveillance Project, Kampala, Uganda
19Institut de Recherche pour le Développement (IRD), Mother and Child
Health in the Tropics Research Unit, Paris, France
20
PRES Sorbonne Paris Cité, Université Paris Descartes, Paris, France
21World Wide Antimalarial Resistance Network (WWARN), Oxford, UK 22
Centre for Tropical Medicine and Global Health, Nuffield Department of Clinical Medicine, University of Oxford, Oxford, UK
23Institute of Tropical Medicine, Antwerp, Belgium 24Medical Research Council Unit, Fajara, The Gambia
25Division of Parasitic Diseases and Malaria, Centers for Disease Control and
Prevention, Atlanta, Georgia
26Drugs for Neglected Diseases initiative, Geneva, Switzerland 27Malaria Research and Training Center, Department of Epidemiology of
Parasitic Diseases, Faculty of Medicine, Pharmacy and Odonto-Stomatology, University of Bamako, Bamako, Mali
28Department of Medicine, University of California San Francisco, San
Francisco, USA
29Institut Pasteur de Dakar, Dakar, Sénégal
30Institut de Recherche pour le Développement (IRD), Montpellier, France 31Mahidol Oxford Tropical Medicine Research Unit (MORU), Faculty of
Tropical Medicine, Mahidol University, Bangkok, Thailand
32
Department of Infectious Diseases, Besançon University Medical Center, Besançon, France
33School of Mathematical Sciences and Monash Academy for Cross and
Interdisciplinary Mathematical Applications, Monash University, Melbourne, Australia
34
Spatial Ecology and Epidemiology Group, Department of Zoology, University of Oxford, Oxford, UK


![Figure 3 Day 28 survival estimates. PCR adjusted recrudescence estimates on day 28 were generated using Kaplan-Meier method stratified by study sites for loose NFDC-25 [red], loose NFDC-30 [orange], co-blistered NFDC [green] and FDC [blue]](https://thumb-eu.123doks.com/thumbv2/5dokorg/4597816.118250/11.892.101.809.132.796/survival-estimates-adjusted-recrudescence-estimates-generated-stratified-blistered.webp)


