Development of Programmable Micro-Power-Meter
Testbed for Radio Modules
M. C. Ekström
∗†, M. Bergblomma
∗‡, M. Lindén
∗, M. Björkman
∗and M. Ekström
∗ ∗School of Innovation, Design and Engineering, Mälardalen University,
Gurksaltargatan 9, 7218 Västerås, Sweden
†Email: martin.ekstrom@mdh.se
‡Email: marcus.bergblomma@mdh.se
Abstract—This paper presents the POMPOM testbed for
high precision power consumption in situ measurements for interchangeable radio modules. The main requirements for the development have been;
Interchangeable radio modules to enable the same hardware testbed to be used independently of the radio standard used make comparison studies possible.
The testbed should be programmable so that the need for hardware development should be minimized. The testbed must be able to act as a controller for the communication and simultaneously make accurate in situ measurements of the energy consumption of the radio.
The required sample rate must be at least 50 kSamples per second. The range of the current measurement should cover at least 0.2 µAmpere to 60 mAmpere with at least 14-bit resolution. Mobility, low cost and small size are vital for the testbed. It must be possible to deploy several measurement testbeds to act as sensor nodes in a wireless sensor network to capture the behavior of the entire network.
The results for test measurement setup for POMPOM is presented to illustrate a typical usage of the testbed. The results presented show how the testbed can be used to investigate the correlation between distance, packet-error-rate and current consumption for a Zigbee radio.
Index Terms—Wireless, Testbed, Testbed development, Radio
modules, Energy consumption.
I. INTRODUCTION
The need for high precision in situ measurement for re-search within the domain of energy consumption of wireless technology is increasing with the development of new low energy radio standards. Jian et al. describe the need for an adaptive micro power meter that can both integrate the energy consumption over longer periods of time as well as capture high resolution power consumption of shorter bursts [1]. Jiang et.al. also emphasize the need to do this at node level for all active nodes in the network in situ.
There is increasing demand for a larger measurement range for measurement systems as radio standards and technology develop. These measurement systems should not only be able to evaluate traditional wireless communications, such as Bluetooth version 2 [2], but should also be applicable for new, low energy models, such as Bluetooth Low Energy [3]. It is claimed that Bluetooth Low Energy will consume as little as 0.4 µA, whereas Bluetooth version 2 consumes 40 µA.
Thus, there is a need for accurate models and energy consumption measurement of wireless technology with in situ
testbeds with high sample frequency and resolution. To be able to compare different wireless technologies, it is vital to be able to isolate the energy consumption of the radio from the rest of the system. One desired feature is a programmable testbed with interchangeable radio technology that can provide an accurate measurement system as well as be able to control the communication in real-time. This would mean that there would be no need to redesign the hardware when changing the radio module. Naturally the mobility and size of the measurement system are of great importance as the system may be used in situ as a sensor node in various environments. Low cost is another requirement as the need for multiple measurement points is vital to gain an understanding of the energy consumption of the entire network.
II. PROBLEM FORMULATION
This section presents the fundamental requirements of our programmable micro-power-meter for a multi-radio testbed.
A vital requirement for a measurement system that will be used for monitoring the energy consumption of various radio chips is that the range and sample rate is adequate to capture the variation in the power consumption for all radio standards that are likely to be used. The Bluetooth Low Energy device is specified to consume no more than 0.4 µA in sleep, and up to 40 mA in the transmit mode. As most of these radio standards utilize a low duty cycle scheme to preserve energy, which leads to long periods of low-power sleep modes that are punctuated with bursts of activity with relatively high energy. Bluetooth version 2.0 + EDR utilizes the low duty cycle scheme when applying the low power mode Sniff as describe by Negri et al. in [4]. Each burst lasts around 10-20ms with the high power-consumption peaks during transmission lasting 625 µs, leading to a nonlinear energy consumption during the bursts. This suggests that a sampling rate of at least tens of kHz is needed. This is supported by Jiang et al. in [1], where they state that the lowest sample rate is 40 kHz according to Nyquist’s theorem, since the highest frequency at which it is possible to attain a significant amount of energy is 20 kHz.
Perturbation is an important aspect when designing an energy monitoring system as it is vital that the system does not affects the energy consumption of the object monitored. In addition the shunt resistor should be very small and purely resistive as stated by Cawley in [5].
Distributed measurements in wireless sensor networks are vital. All nodes in a measurement setup should preferably be monitored. Consequently, it is vital that the test bed is small, mobile and low-cost. The mobility alone could cause a problem since the node should be battery powered, which implies that the measurement data must either be stored locally, or transmitted wirelessly to the collector node in wireless sensor network (WSN).
A measurement setup allowing each node to be monitored in a WSN in situ measurement is essential to get a complete overview of the energy consumption for the network. The testbed must be able to communicate and control the com-munication as well as automatically adapt the measurement procedure for different measurement setups.
III. RELATED WORK
Jinag et al. [1] presented the SPOT measurement platform for empirically evaluating the energy consumption in situ for wireless platforms. The SPOT has been developed to measure the energy consumption existing platforms such as the Telos developed by Polastre et al. [6]. The SPOT measurement platform uses a voltage to frequency converter, VFC, since the analog-to-digital converters could not provide the sample rate nor the resolution needed to sense the range of 2 µA -40 mA at -40 kSample per second, as stated.
Margii et al. presented the characterization of a visual sensor network testbed [7], where the energy consumption is measured with both an external digital multimeter connected to a PC via a GPIB cable and battery monitoring system. The latter has a sampling rate of 36.41 Hz with a 12- bit ADC resolution with a 270mOhm shunt resistor, resulting in a resolution of 0.904 mA +- 1.808 mA error. The digital multimeter setup is set to measure at 60 samples per second, but the resolution of the measurement system is not stated.
A common measurement setup that use an external digital oscilloscope that measures the voltage drop over a 0.5 Ohm shunt resistor placed on the input voltage to the WLAN card was presented by Feeney et al. in [8].
Negri et.al. presented a setup similar to that of Feeny et
al. [8] in [4], where a direct in situ measurement setup is
presented with a current datalogger to monitor the power consumption of a Bluetooth chip.
Hergenroeder presented in [9] a testbed for monitoring the whole sensor node energy consumption, a system similar to that of Jiang et al. [1] system but with a higher resolution and faster sample rate, however it does not isolate the radio chip or provide a broad enough range for the micro power measurements needed for evaluating modern radio standards. An error of up to 15% was achieved when measuring the current consumption below 5 mA. However this is more than sufficient for this type of platforms since the minimum power consumption of a whole sensor node is unlikely to be less than 5 mA.
IV. PROPOSED TESTBED SOLUTION
In this paper a programmable testbed with embedded in
situ micro-power-meter with a high resolution and fast sample
rate is presented. The most significant difference between this new testbed, POMPOM, and other existing systems is that POMPOM is a programmable testbed with interchangeable radio modules. This implies that the energy consumption can be compared for different radio modules that implement the same radio standard.
The requirements for the measurement testbed developed are presented below.
• Interchangeable radio modules: the same hardware
testbed is used independent of the radio standard chosen to make studies comparable.
• Programmable: the need for hardware development
should be minimized.
• The testbed should be able to act as a controller for the
communication and simultaneously make accurate in situ measurements of the energy consumption of the radio.
• The testbed must be able to perform integrating longterm
measurements of the energy consumption as well as be able to capture high resolution periodic measurements with high sample frequency. The required sample rate and range of the measurement is described in Section II
• Mobility: being of low cost, small in size and battery
powered are vital for this testbed. It must be possible to deploy several measurement testbeds to act as distributed sensor nodes in a wireless sensor network to capture the behavior of the entire network.
V. SYSTEM SPECIFICATION
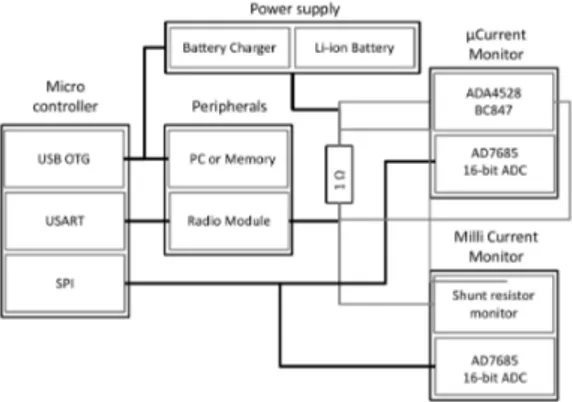
This section will describe the components and the spec-ification of the programmable micro power meter testbed developed for the radio module, POMPOM. The specifica-tions of the whole system are presented as follows; Samlpe rate and range of the system in SectionV-A,current mon-itoring system in SectionV-B, Analog-to-digital converter in sectionV-C,the microcontroller unit and its peripheral in SectionV-D and POMPOMs power supply in SectionV-E. The hardware overview of the POMPOM system depicted in figure 1.
A. Range and sample frequency
POMPOM will primarily be used for evaluating and com-paring the energy characteristics for different radio modules. As described in section IV the range of the current that need to be measured is ranging from 0.4 µA to 40 mA. The sampling rate needs to be at least 40 kHz. To meet these requirements, two analog shunt resistor monitoring systems in combination with 16-bit resolution ADC with a sample rate at 50 kSamples per second has been developed.
B. Current monitor system
The power-meter system presented in this paper uses two parallel measuring systems called the µCurrent monitor and mCurrent monitor in this paper. These are depicted in Figure 1 The micro current monitor is designed to be able to measure from 0.2 µA to 1 mA. In Figure 2 the schematics are depicted for the µCurrent analog amplifier. The operational amplifier
Fig. 1. Hardware overview of the POMPOM system specification. Including ADC, power supply, µCurrent and MilliCurrent meter, microcontroller and peripherals
Fig. 2. µCurrent Monitor schematics. The measurement range is from 0.2 µA to 1 mA
used is the ADA4528 from Analog Devices and the NPN small signal transistor is the BCW60A from Diodes.
To monitor the milli current consumption of the radio module a 1 Ohm shunt resistor is been used in combination with and current shunt monitor, INA193 [10]. The INA193 has a voltage gain of 20 and bandwidth of 400 kHz. The amplified analog signal is connected to the analog-to-digital converter presented in V-C.
C. Analog-to-Digital Converter
The central part of the measurement system is the analog-to-digital conversion, to fulfill the requirements described in II the AD7685 has been chosen. The AD7685 is an 16-bit Analog-to-digital converter with a sample rate of 250 kSps that communicates via a serial port interface, SPI, to the micro control unit.
D. Micro Control Unit
The micro control unit, MCU, that will be used for controlling the communication and measurements is the PIC24FJ256GB106. This 16-bit architecture MCU commu-nicates with the radio modules via USART and when used as a collector node via USB On-the-go, OTG, with the PC. The SPI interface is used to communicate and control the embedded measurement system described in Section V-B and Section V-C.
E. Power supply
The testbed is powered either by a 4.2 V Li-ion battery or with USB power supply. The battery is charged with the MAX1811 that utilizes the USB power supply.
F. Peripherals
This section will describe the peripherals to the POMPOM system.
1) USB OTG interface: The POMPOM testbed is USB
On-the-go compatible, which implies that it can be connected to a PC as well as a memory stick.
2) Radio Modules: The main objective and first study that
the POMPOM will be used for is to compare the most com-monly used radio standards operating in the 2.45 GHz ISM frequency band and how different parameters of the standards effect the energy consumption. The goal is to create energy consumption models for simulation studies. The following standards are of immediate interest:
• IEEE 802.15.4 based standards such as ZigBee and
WirelessHART. IEEE 802.15.4, which implements the physical layer and data link layer, is inteded for ap-plications with a low data rate and has a low power-consumption requirement [11].
• Different versions of the Bluetooth standard, especially
Bluetooth Low Energy [3]. The latter version of Blue-tooth is intended for applications with a low data rate and low power consumption, but also for applications which require a low latency.
VI. VALIDATION OF THE MEASUREMENT SYSTEM
The calibration of the energy measurement system of the POMPOM testbed and a test measurement setup for the POMPOM system with a Zigbee radio module is presented in this section.
A. Power meter calibration
For accurate measurements the whole system needs to be validated and calibrated to establish accuracy and verify the linearity of the energy consumption measurements. The cali-bration setup is depicted in figure 3. All calicali-bration required to correct the nonlinearity is made in software on the MCU in the POMPOM system. The current measurements, which are used to calculate the energy consumed, are calibrated and validated with the use of a known load and a digital multimeter (DMM), a Hewlett Packard 34401A [12].
Fig. 3. Validation measurement setup for POMPOM testbed
B. Test measurement setup
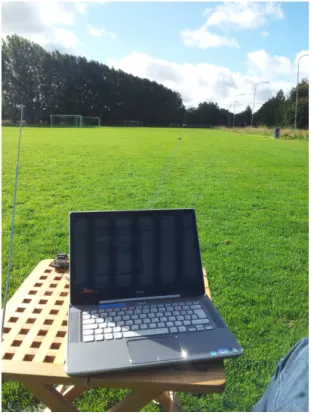
This test study aims to investigate how the distance and the packet error rate influence the average power consumption of the radio module. In this study, the Telegesis ETRX357 is investigate in two different environments: a soccer field and outdoors in an urban environment. The aim was to show that POMPOM testbed is working and to investigate the differences in the packet-error-rate and energy consumption for the radio in these environments when changing the distance between transmitter and receiver. The radio module is is running in Zigbee full function device, FFD, mode. The packet size for the payload was set to 10 bytes and the transmission interval was 500 ms in this test setup. The number of packets for all distances was set to 1000. Both of the test environments for this setup were outdoors because the range of the radio are tested and line-of-sight is desirable for the radio com-munication. The first environment is a large grass field, with three soccer fields in a row as depicted in Figure 4. The second test site is in a urban environment with asphalt roads, surrounding buildings, and trees as shown in Figure 5. For both measurements the temperature was 16 degrees Celsius and the relative humidity was 80%. The results of the measurements are described in Section VII-B.
VII. RESULTS
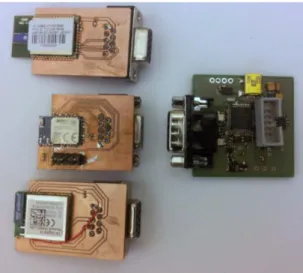
This section presents the results for the POMPOM measure-ment system. In this paper, the developmeasure-ment of an embedded measurement system that fulfills the requirements described in section II is presented. The POMPOM system in shown in Figure 6 with three different interchangeable radio modules. In this the picture is on the top left is the Jennic ZigBee JN5139 module [13]. The radio module in the middle is the Bluegiga Bluetooth Low Energy Class 2 BLE112 [14] and finally, the Telegesis ETRX357 Zigbee module [15] at the bottom.
In the last part of this section are the results of an initial measurement performed with the Telegesis ETRX357 Zigbee module presented. The measurement setup with the Telegesis ETRX357 Zigbee module was chosen as to show proof of concept that POMPOM can control and do simultaneous current consumption measurements. Future work will include comparison studies with various Bluetooth and Zigbee mod-ules.
Fig. 4. Test environment soccer field
Fig. 6. POMPOM measurement system with interchangeable radio modules: On the top left Jennic JN5139,in the middle Bluegiga BLE112 and bottom left Telegesis ETRX357 radio modules
A. Range and Resolution
This section of the paper will show the results of the control measurements needed for the calibration, range, linearity and sample rate.
1) µCurrent Monitor: The full range and linearity of
the POMPOM µCurrent monitoring system is shown in the graph 8 that described in section V-B
The lowest currents measured for the POMPOM µCurrent meter are shown with standard deviation in Figure 7. This graph shows the current measurement in the range from 0.15 to 0.85 µAmpere. The graph shows that it is possible to measure currents below the 0.4 µAmpere, as specified in Section V.
Fig. 7. µCurrent measurement. Range from 0.15 to 0.85 µA
2) mCurrent Monitor: The full range and linearity of the
POMPOM mCurrent monitoring system described in Section V-B is displayed in Figure 10. The graph shows good linearity for the range up to 155mA.
The lowest currents measured for the POMPOM mCurrent meter are shown with standard deviation in Figure 7. The graph shows the current measurement that ranges between 0.7
Fig. 8. µCurrent monitor full range and linearity
to 2 mA. However the the standard deviation for the mCurrent has an maximum value for the range as depicted in the graph at 5.49 meaning it is not visible in the graph. The graph shows that currents that currents from 0.8 mA can be measured with good linearity and will complement the µCurrent Monitor’s range of 0.2µA to 1mA.
The POMPOM current measurement system has good lin-earity within the range examined and a total range of 0.2µA to 155mA.
The sample rate for the measurement system is set to 200kSamples per second.
Fig. 9. mCurrent monitor measurement. Range from 0.7 to 2.1mA
B. Test measurement result
In this part of the results section, the test setup measure-ments are presented for a distributed Zigbee module. All measurements are performed with the Telegesis ETRX357 Zigbee module that operates as an full function device. The measurement setup and the environments in which the mea-surements were made are presented in Section VI-B.
Fig. 10. mCurrent monitor full range and linearity. Good linearity is shown up to 155mA
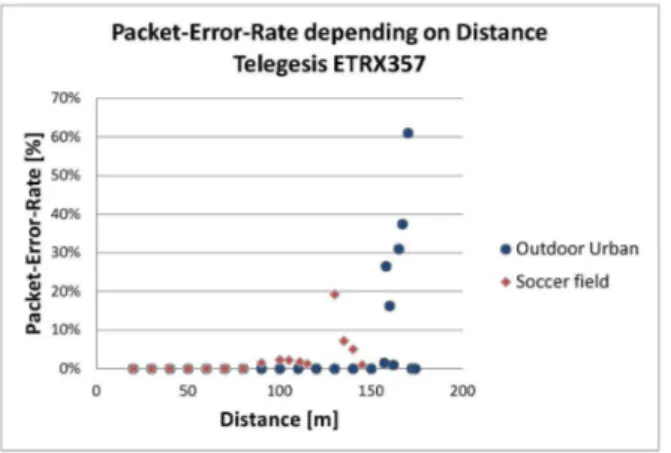
In Figureh 11, the packet-error-rate is plotted as an function of the distance for both the outdoor urban environment and the soccer field.
Fig. 11. Packet-error-rate displayed as a function of the distance from 1 to 160 meters for the Telegesis ETRX357 Zigbee module
In Figure 12, the average current consumption for the radio module depending on the distance between transmitter and receiver for both test environment.
As the radio module is operating as an full function device the current consumption in idle state is 32 mA and transmit state 36 mA according to the data sheet [15]. However the maximum current consumption is not stated nor the additional current it will draw when a packet is not acknowledged.
Finally the results for the average current consumption for the radio module as a function of the packet-error-rate are presented in graph 13.
VIII. CONCLUSION
A testbed for evaluating and testing in situ energy con-sumption of different radio modules has been developed with high resolution and a fast sample rate as required for modern
Fig. 12. Average current consumption as a function of distance for the Telegesis ETRX357 Zigbee module
Fig. 13. Average current consumption depending on packet-error-rate the Telegesis ETRX357 Zigbee module
radio modules. Unlike other platforms and testbeds intended to evaluate radio communication, as described in Section III the POMPOM offers the possibility to change the radio module without requiring any hardware reconfigurations.
The test setup measurement shows that the POMPOM testbed is suitable for in situ measurements in wireless com-munication setups when investigating the energy consumption depending on various environments or setups. The results indicate that more measurements are needed to be able to draw any firm conclusions about the correlations between the energy consumption, packet-error-rate and the distance in different types of environment. The correlation between the packet-error-rate and the current consumption for the radio module, as shown in Figure 13, demonstrates what one would expect: if the packet rate increases, so will the current consumption.
A research question that need to be answered is; What makes the packet-error-rate increase?Which leads to the fur-ther question: How can this be correlated to the environment, distance and the radio standard. The POMPOM testbed is well suited to investigate these types of questions.
Mobility, low cost and small size have been achieved for the testbed. This enables us to deploy several measurement testbeds to act as sensor nodes in a wireless sensor network to capture the behavior of the entire network.
The POMPOM testbed will foremost be used determine how parameters like the packet size, distance and the type of envi-ronment will effect the energy consumption for different radio modules. POMPOM will be used to determine which radio standard is most suitable for a variety of different environments from the point of view of the energy consumption.
REFERENCES
[1] Xiaofan Jiang, P. Dutta, D. Culler, and I. Stoica. Micro power meter for energy monitoring of wireless sensor networks at scale. In Information
Processing in Sensor Networks, 2007. IPSN 2007. 6th International Symposium on, pages 186 –195, april 2007.
[2] Bluetooth SIG. Bluetooth specification version 2.0 + enhanced data rate, 2006.
[3] Bluetooth SIG. Bluetooth Core Version 4.0, year = 2010.
[4] L. Negri, J. Beutel, and M. Dyer. The power consumption of bluetooth scatternets. In Consumer Communications and Networking Conference,
2006. CCNC 2006. 3rd IEEE, volume 1, pages 519 – 523, jan. 2006.
[5] Kevin Cawley. Power supply transient response considerations when testing portable devices. In Keithley Instruments White paper no. 2032
Cleveland, OH, volume 2, April 2003.
[6] J. Polastre, R. Szewczyk, and D. Culler. Telos: enabling ultra-low power wireless research. In Information Processing in Sensor Networks, 2005.
IPSN 2005. Fourth International Symposium on, pages 364 – 369, april
2005.
[7] C.B. Margi, V. Petkov, K. Obraczka, and R. Manduchi. Characterizing energy consumption in a visual sensor network testbed. In Testbeds
and Research Infrastructures for the Development of Networks and Communities, 2006. TRIDENTCOM 2006. 2nd International Conference on, pages 8 pp. –339, 0-0 2006.
[8] L.M. Feeney and M. Nilsson. Investigating the energy consumption of a wireless network interface in an ad hoc networking environment. In INFOCOM 2001. Twentieth Annual Joint Conference of the IEEE
Computer and Communications Societies. Proceedings. IEEE, volume 3,
pages 1548 –1557 vol.3, 2001.
[9] Anton Hergenroeder, Joachim Wilke, and Detlev Meier. Distributed energy measurements in wsn testbeds with a sensor node management device (snmd). Architecture of Computing Systems (ARCS), 2010 23rd
International Conference on, pages 1 –7, feb. 2010.
[10] Texas Instrument. Shunt resistor monitor INA194. http://focus.ti.com/docs/prod/folders/print/ina194.html, Januari 2008. [11] Ieee standard for information technology - telecommunications and
information exchange between systems - local and metropolitan area networks specific requirements part 15.4: wireless medium access con-trol (mac) and physical layer (phy) specifications for low-rate wireless personal area networks (lr-wpans), 2003.
[12] Hewlett Packard. Dmm 34401a.
http://www.home.agilent.com/agilent/product, December 2011. [13] Jennic. Jn5139 module zigbee. http://www.jennic.com/products/modules,
Feb 2009.
[14] Bluegiga. Bluetooth low energy ble112 module. http://www.bluegiga.com/bluetooth-low-energy, Feb 2009.
[15] Telegesis. Ext357 module zigbee.