ORF ISSUE BRIEF
n 2014, international tourist arrivals reached an all-time high, with a record of 1,138 million1
overnight visitors—a 4.7 percent increase from 2013. This increase follows a sustained period
I
of growth in international tourist arrivals since the financial crisis of 2008, and a 23 percent2
increase since the year before the crisis. Travel for holidays, recreation and other forms of leisure account for just over half of all international tourists (52 percent or 568 million), followed by travel for other reasons, such as visiting friends and relatives, religious reasons and pilgrimage, and health
3
treatment (27 percent). Some 14 percent of international tourists reported travelling for business and professional purposes; the purpose of visit for the remaining seven percent of arrivals is not
4 specified.
Such an increase in international tourism has been facilitated as governments have started to pay closer attention to visa procedures. One indicator of this is the fact that in 2014, 62 percent of the world's population required a traditional visa from the embassy prior to departure, down from 77
5
percent in 2008. Moreover, a total of 50 destinations significantly facilitated the visa process for citizens of 30 or more countries between 2010 and 2014, by changing their visa policies from “visa
6
required” to either “e-visa,” “visa on arrival” or “no visa required.” Of all the facilitative measures, ISSUE BRIEF # 91 MAY 2015
Introduction
Natasha Agarwal and Magnus Lodefalk
i
Atithi Devo Bhava? *
Observer Research Foundation is a public policy think tank that aims to influence formulation of policies for building a strong and prosperous India. ORF pursues these goals by providing informed and productive inputs, in-depth research and stimulating discussions. The Foundation is
supported in its mission by a cross-section of India’s leading public figures, academics and business leaders.
i. 'Atithi Devo Bhava' is a Sanskrit phrase which can literally be translated in English to mean “The guest is equivalent to God” or “Be one for whom the guest is God.” See http://en.wikipedia.org/wiki/Atithi_Devo_Bhav.
* Responsibility for the views, opinions, suggestions and analysis in this article lies solely with the authors and does not reflect the institutions they represent. The article was first published on 13 March 2015 and has been updated with policy changes made by the Government of India since 13 March 2015. On 9 April 2015, the policy brief was covered by 'Ideas for India' as a blog post titled “Getting more out of India's Tourist Visa on Arrival Scheme” (http://www.ideasforindia.in/article.aspx?article_id=1436). Wall Street Journal also covered the policy brief in its article titled “India's Incredible Quick Fix to 'Visa on Arrival' Problem” (http://blogs.wsj.com/indiarealtime/2015/04/10/indias-quick-fix-to-visa-on-arrival-confusion/). On 15 April 2015, the Wall Street Journal again covered the policy brief in its article titled “India Changes Name of Visa on Arrival after Complaints about Program” (http://blogs.wsj.com/indiarealtime/2015/04/15/india-changes-name-of-visa-on-arrival-after-complaints-about-program/). Recently, the issue was also covered by Quartz India (Shelly Walia, “What's in a name: India's e-visa is actually a smart programme,” April 20, 2015, http://qz.com/386802/whats-in-a-name-indias-e-visa-is-actually-a-smart-programme/.)
the most popular measure implemented by destinations remains the introduction of “visa on arrival”—instead of the “visa required”—where 56 percent of all improvements were made
7 between 2010 and 2014.
This issue brief analyses recent reforms of the tourist visa process of India. On the surface, recent initiatives seem impressive. However, as often, details matter, and the analysis shows that the Indian initiatives are rather void and partly poorly implemented. It is also noted that the Immigration
8
Bureau of India states that tourists coming to India still prefer to get their visas beforehand. These findings raise pertinent questions on how the e-tourist visa can make a real impact on the Indian economy. The conclusion suggests ways to fix the shortcomings of the scheme before extending it to 150 countries as suggested by the Finance Minister in his Annual Budget for 2015-2016. Such a review should preferably include learning from other countries that are also working to facilitate their visa processes, such as Australia. Importantly, the findings are of a wider interest, since the movement of persons is crucial not only for tourism but also for businesses that want to connect to global value chains as well as for partners abroad.
The Indian Tourist Visa on Arrival Scheme—Much Ado about Nothing?
Wanting to stay in the facilitator league, the Government of India, on 1 January 2010, launched the “Tourist Visa on Arrival” (TVoA) scheme on a pilot basis for a period of one year. The pilot scheme covered tourists coming from five countries, namely Singapore, Finland, New Zealand, Luxembourg and Japan. In 2011, the scheme was extended to six more countries, namely Cambodia, Vietnam, Philippines, Laos, Indonesia and Myanmar. With no additions in 2012 and 2013, the year 2014 witnessed a large number of additions to the list of countries whose nationals could be entitled for TVoA in India. In April 2014, tourists coming from South Korea were included in the scheme and in November 2014, the scheme was further extended to tourists coming from 32 other countries (see Table 1 on when and to whom India extended the TVoA facility). On 13 March 2015, the Prime Minister of India, during his visit to Sri Lanka, announced the extension of the TVoA scheme to Sri
9
Lankan citizens with effect from the Sinhala and Tamil New Year on 14 April 2015. With effect from 1 May 2015, the scheme was further extended to 31 countries, making it a total of 77 countries
ii eligible for this scheme (which includes partial opening of one country).
Since its inception on 1 January 2010, the number of tourists entering India by availing the new TVoA facility has been trending upwards (see Table 2). With an average year on year growth of 60 percent over the period 2010 to 2014, the number of tourist visas issued on arrival has gone up from as low as 6,549 in 2010 to 39,046 in 2014. Meanwhile, the absolute number of Total Foreign Tourist
10
Arrivals (TFTAs) has gone up from 5.8 million in 2010 to 75 million in 2014, signifying an average year on year growth of nine percent over the period. However, the role of the Indian scheme in
facilitating entry toward this increase is dubious. In fact, the average share of total visas issued on arrival in the TFTAs in India is below half a percent for the same period (average share of TVoAs stands at 0.27 percent of the TFTAs for the period 2010 to 2014).
Tourists do not appear inclined to opt for the “Visa on Arrival” facility. Both the growth of TVoAs over time across countries (see Table 3) and the growth of TVoAs as a share of TFTAs over time (see Table 4) does not present an encouraging picture. For instance, since its launch in 2010, tourists from
27, 28
Table 2: Performance of Tourist Visa on Arrival Scheme26,
Years Total (number) Total (number)
TVoAs as a share of TFTAs (%) Year on year growth rate (%) Year on year growth rate (%)
Tourist Visas on Arrival (TVoAs) Total Foreign Tourist Arrivals (TFTAs)
2010 2011 2012 2013 2014 2015 Average 6,549 12,761 16,084 20,294 39,046 A 25,023 B 18,947 -94.85 26.04 26.18 92.4 C -59.87 5,775,692 6,309,222 6,577,745 6,967,601 7,462,000 -6,618,452 -9.24 4.26 5.93 7.10 -9.24 0.11 0.20 0.24 0.29 0.52 -0.27 A
represents data for January 2015 only. Data on several months for several countries for 2010 was not available. Therefore, the aggregate for
29 B C
2010 was taken from a press release by the Indian government. average excludes data for January 2015. year on year growth rate for the period 2014-2015 is not calculated as the data available for 2015 only represents January 2015. Years (2010-2014) represent a calendar year, i.e. 12 months from January to December.
Table 1: Chronology of the Tourist Visa on Arrival Scheme
Announcement date
Implementation date
Countries granted Tourist Visa on Arrival
Number of added countries 11 9 December 2009 30 December 201013 25 January 201115 15 April 201417 27 November 201420 1 January 201522 13 March 201525 1 January 2010 12 1January 201014 28 January 201116 15 April 201418, 19 27 November 201421 1 January 201523, 24 14 April 2015
Singapore, Finland, New Zealand, Luxembourg and Japan Singapore, Finland, New Zealand, Luxembourg, Japan, Cambodia, Vietnam, Philippines and Laos
Singapore, Finland, New Zealand, Luxembourg, Japan, Cambodia, Vietnam, Philippines, Laos, Indonesia and Myanmar
Singapore, Finland, New Zealand, Luxembourg, Japan, Cambodia, Vietnam, Philippines, Laos, Indonesia, Myanmar and South Korea
Singapore, Finland, New Zealand, Luxembourg, Japan, Cambodia, Vietnam, Philippines, Laos, Indonesia, Myanmar, South Korea, Australia, Brazil, Cook Islands, Djibouti, Fiji, Germany, Guyana, Israel, Jordan, Kenya, Kiribati, Marshall Islands, Mauritius, Mexico, Micronesia, Nauru, Niue Island, Norway, Oman, Palau, Palestine, Papua New Guinea, Russia, Samoa,
Solomon Islands, Thailand, Tonga, Tuvalu, UAE, Ukraine, USA and Vanuatu Singapore, Finland, New Zealand, Luxembourg, Japan, Cambodia, Vietnam, Philippines, Laos, Indonesia, Myanmar, South Korea, Australia, Brazil, Cook Islands, Djibouti, Fiji, Germany, Guyana, Israel, Jordan, Kenya, Kiribati, Marshall Islands, Mauritius, Mexico, Micronesia, Nauru, Niue Island, Norway, Oman, Palau, Palestine, Papua New Guinea, Russia, Samoa, Solomon Islands, Thailand, Tonga, Tuvalu, UAE, Ukraine, USA, Vanuatu and Guyana Singapore, Finland, New Zealand, Luxembourg, Japan, Cambodia, Vietnam, Philippines, Laos, Indonesia, Myanmar, South Korea, Australia, Brazil, Cook Islands, Djibouti, Fiji, Germany, Guyana, Israel, Jordan, Kenya, Kiribati, Marshall Islands, Mauritius, Mexico, Micronesia, Nauru, Niue Island, Norway, Oman, Palau, Palestine, Papua New Guinea, Russia, Samoa, Solomon Islands, Thailand, Tonga, Tuvalu, UAE, Ukraine, USA, Vanuatu, Guyana and Sri Lankan citizens from the Sinhala and Tamil New Year
5 4 2 1 32 1 1 (partial opening)
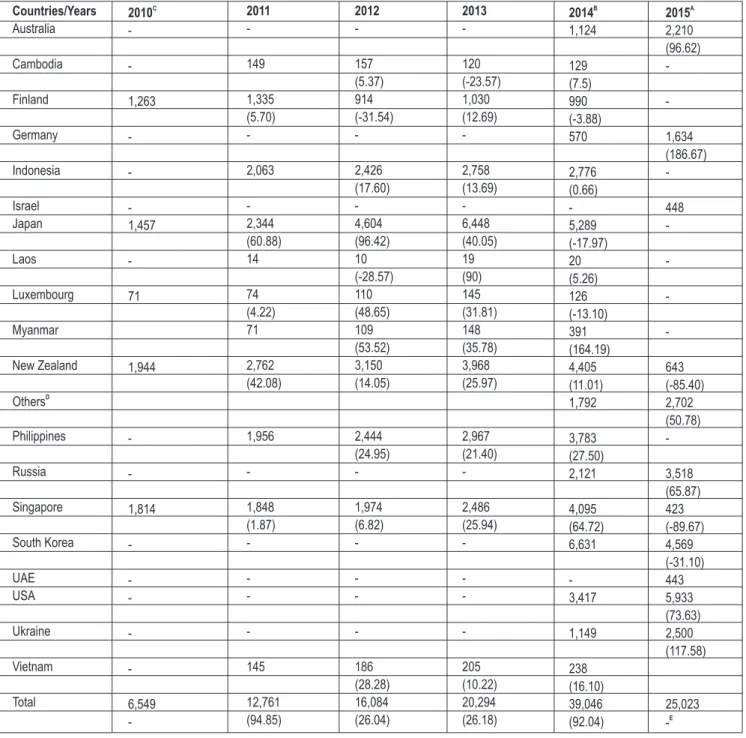
Singapore have consistently preferred to obtain their visas at the Indian mission in their home country. Although the growth rate of TVoAs issued to Singaporeans has increased from two percent in 2011 to 65 percent by 2013 (see Table 3), the average share of Singaporeans that obtained TVoA over the period 2010-2013 is less than two percent of the total arrivals of Singaporeans in India (see Table 4). Countries/Years C 2010 2011 2012 2013 B 2014 A 2015 Australia Cambodia Finland Germany Indonesia Israel Japan Laos Luxembourg Myanmar New Zealand D Others Philippines Russia Singapore South Korea UAE USA Ukraine Vietnam Total -1,263 -1,457 -71 1,944 -1,814 -6,549 -149 1,335 (5.70) -2,063 -2,344 (60.88) 14 74 (4.22) 71 2,762 (42.08) 1,956 -1,848 (1.87) -145 12,761 (94.85) -157 (5.37) 914 (-31.54) -2,426 (17.60) -4,604 (96.42) 10 (-28.57) 110 (48.65) 109 (53.52) 3,150 (14.05) 2,444 (24.95) -1,974 (6.82) -186 (28.28) 16,084 (26.04) -120 (-23.57) 1,030 (12.69) -2,758 (13.69) -6,448 (40.05) 19 (90) 145 (31.81) 148 (35.78) 3,968 (25.97) 2,967 (21.40) -2,486 (25.94) -205 (10.22) 20,294 (26.18) 1,124 129 (7.5) 990 (-3.88) 570 2,776 (0.66) -5,289 (-17.97) 20 (5.26) 126 (-13.10) 391 (164.19) 4,405 (11.01) 1,792 3,783 (27.50) 2,121 4,095 (64.72) 6,631 -3,417 1,149 238 (16.10) 39,046 (92.04) 2,210 (96.62) -1,634 (186.67) -448 -643 (-85.40) 2,702 (50.78) -3,518 (65.87) 423 (-89.67) 4,569 (-31.10) 443 5,933 (73.63) 2,500 (117.58) 25,023 E -30, 31, 32
Table 3: Performance of Tourist Visa on Arrival Scheme Over Time Across Countries
A represents data for January 2015 only. Apart from USA, Russia, South Korea, Ukraine, Australia, New Zealand, Japan, Singapore, Germany B 33
and the Philippines, data for the remaining country-wise distribution of TVoAs stands provisional as Indian government does not mention the
C
same. Data on several months for several countries for 2010 was not available. Therefore, the aggregate and the total were again taken from a
34
government press release. Figures in parentheses represent year on year growth rate.' - ' represents no information available either because
D
the countries have not yet been granted the visa on arrival eligibility or because the ministry has not published the information. Since the ministry
E
does not publish TVoAs granted to all the 44 eligible countries, the remaining have been published in the 'other' category. Year on year growth rate for the period 2014-2015 is not calculated as the data available for 2015 only represents January 2015. Years (2010-2015) represent calendar years, i.e., 12 months from January to December.
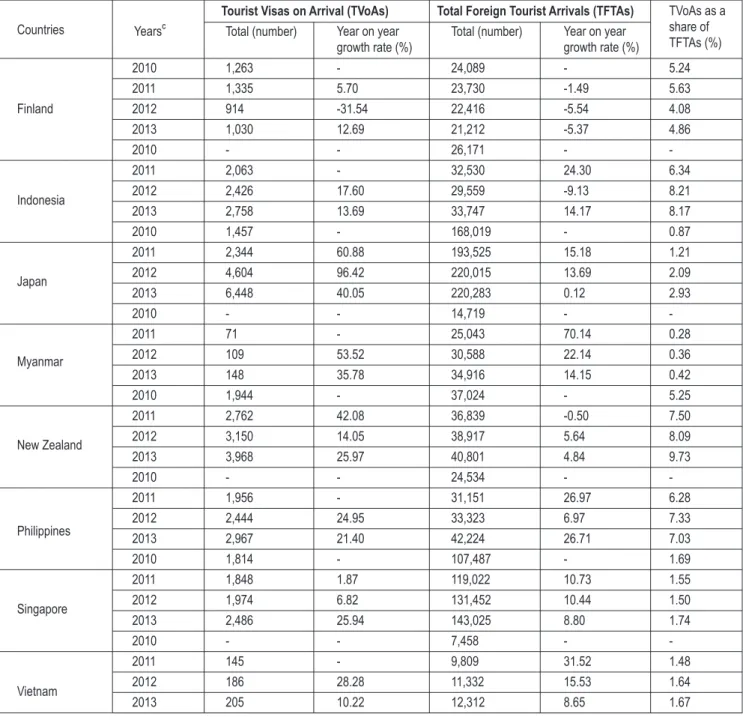
Moreover, Singaporeans' preference to obtain visa on arrival has remained volatile over the period 2010 to 2013; from 1.69 percent in 2010, the preference for a TVoA reduced to 1.55 percent and 1.50 percent in 2011 and 2012 respectively before it went up to 1.74 percent in 2013.
On the other hand, even though the growth rate of TVoAs issued to New Zealanders has slowed down from 42 percent to 11 percent in 2014 (see Table 3), New Zealanders' preference to obtain visa on arrival has increased over the period 2010 to 2013. The share of New Zealanders that obtained a TVoA in the total arrivals of New Zealanders has consistently increased over time, from five percent in 2010 to 10 percent in 2013, thus averaging at almost eight percent for the period (see Table 4).
35, 36, 37
Table 4: Performance of TVoAs as a Share of TFTAs over Time across Countries
C
Years Total (number) Total (number)
TVoAs as a share of TFTAs (%) Year on year growth rate (%) Year on year growth rate (%)
Tourist Visas on Arrival (TVoAs) Total Foreign Tourist Arrivals (TFTAs)
Countries 2010 2011 2012 2013 2010 2011 2012 2013 2010 2011 2012 2013 2010 2011 2012 2013 2010 2011 2012 2013 2010 2011 2012 2013 2010 2011 2012 2013 2010 2011 2012 2013 1,263 1,335 914 1,030 -2,063 2,426 2,758 1,457 2,344 4,604 6,448 -71 109 148 1,944 2,762 3,150 3,968 -1,956 2,444 2,967 1,814 1,848 1,974 2,486 -145 186 205 -5.70 -31.54 12.69 -17.60 13.69 -60.88 96.42 40.05 -53.52 35.78 -42.08 14.05 25.97 -24.95 21.40 -1.87 6.82 25.94 -28.28 10.22 24,089 23,730 22,416 21,212 26,171 32,530 29,559 33,747 168,019 193,525 220,015 220,283 14,719 25,043 30,588 34,916 37,024 36,839 38,917 40,801 24,534 31,151 33,323 42,224 107,487 119,022 131,452 143,025 7,458 9,809 11,332 12,312 --1.49 -5.54 -5.37 -24.30 -9.13 14.17 -15.18 13.69 0.12 -70.14 22.14 14.15 --0.50 5.64 4.84 -26.97 6.97 26.71 -10.73 10.44 8.80 -31.52 15.53 8.65 5.24 5.63 4.08 4.86 -6.34 8.21 8.17 0.87 1.21 2.09 2.93 -0.28 0.36 0.42 5.25 7.50 8.09 9.73 -6.28 7.33 7.03 1.69 1.55 1.50 1.74 -1.48 1.64 1.67 Finland Indonesia Japan Myanmar New Zealand Philippines Singapore Vietnam
Years 2014 and 2015 are not considered as country-wise foreign tourist arrivals data is only available till 2013.'-' represents no information available because the countries have not yet been granted the visa on arrival eligibility. Years (2010-2013) represent a calendar year, i.e., 12
C
months from January to December. Data on several months for several countries for 2010 was not available. Therefore, the aggregate and the
38
Despite the arguably poor performance of the TVoA scheme, the government has taken laudable initiatives by reformulating the modalities of the scheme. For instance, abolishing the restriction of
39
two months gap between two consecutive visits of a foreigner, introducing visa fees payment through debit and credit cards, increasing the number of airports for the TVoA from four to nine, simplifying the visa form, introducing local language help for foreigners in filling the online visa application form, removing the requirement of filling the Departure (Embarkation) card by outgoing foreigners and Arrival (Disembarkation) card by incoming Indians and simplifying the 40 Embarkation/Disembarkation cards, as well as introducing the Collective Landing Permit (CLP). In addition to these measures, one of the major reforms that the government initiated on 27 iii November 2014 was enabling the TVoA scheme through Electronic Travel Authorisation (ETA)
41, 42 and extending the same to all the eligible countries.
43 The recent step enabling TVoA through ETA did not fail to grab the international limelight. The ministry in its press releases highlights the successful implementation of the TVoA enabled with the ETA scheme. It repeatedly mentions that the introduction of the ETA enabled TVoA scheme for 44
44 countries in November 2014 has been the main reason for the surge in tourist arrivals in India. The alleged success received attention in the country's Annual Budget for the year 2015-2016, where the Finance Minister lauded the success of visas on arrival and proposed to extend the same to 150
45
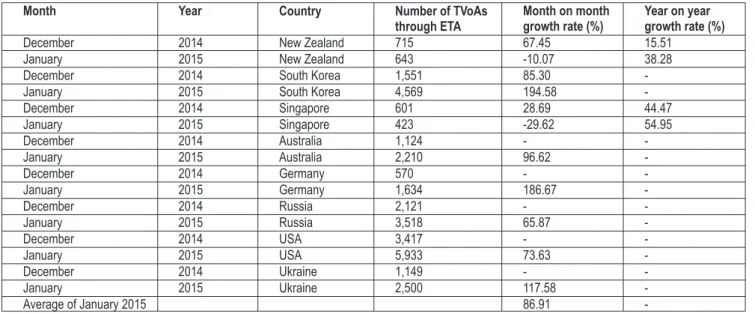
countries in a phased manner. Without doubt, the success of TVoA through ETA cannot be denied, given the impressive average growth of tourist visas on arrival since its implementation stands at almost 87 percent — the average growth of TVoAs through ETA for January 2015 from its
46 levels in December 2014 for only eight of the 44 eligible countries (see Table 5).
47
Table 5: Performance of TVoA Scheme through Electronic Travel Authorisation (ETA)
Year on year growth rate (%) Month on month growth rate (%) Number of TVoAs through ETA Country Year Month December January December January December January December January December January December January December January December January Average of January 2015 2014 2015 2014 2015 2014 2015 2014 2015 2014 2015 2014 2015 2014 2015 2014 2015 New Zealand New Zealand South Korea South Korea Singapore Singapore Australia Australia Germany Germany Russia Russia USA USA Ukraine Ukraine 715 643 1,551 4,569 601 423 1,124 2,210 570 1,634 2,121 3,518 3,417 5,933 1,149 2,500 67.45 -10.07 85.30 194.58 28.69 -29.62 -96.62 -186.67 -65.87 -73.63 -117.58 86.91 15.51 38.28 -44.47 54.95
-'-'represents no information available because the countries have not yet been granted the visa on arrival eligibility.
iii. Tourist Visa on Arrival (TVoA), introduced in 2010, literally meant that the eligible tourist could come to India and get a visa at the authorised immigration checkpoint in India. The eligible traveller did not have to apply online before departure. On 27 November 2014, the government introduced the Electronic Travel Authorisation (ETA), which means that the tourist now has to apply for the visa online, carry a copy of the visa with him/her at the time of travel, produce it at the authorised immigration checkpoint in India, and then enter India. The name “Tourist Visa on Arrival through Electronic Travel Authorisation” was misleading, as clearly it was not visa on arrival. Therefore, with effect from 15 April 2015, the government changed the name of the policy from “TVoA through ETA” to “e-Tourist Visa.” “MHA renames Tourist Visa on Arrival Scheme as e-tourist Visa from tomorrow,” Press Information Bureau, Government of India, April 14, 2015, http://pib.nic.in/newsite/PrintRelease.aspx?relid=118240.
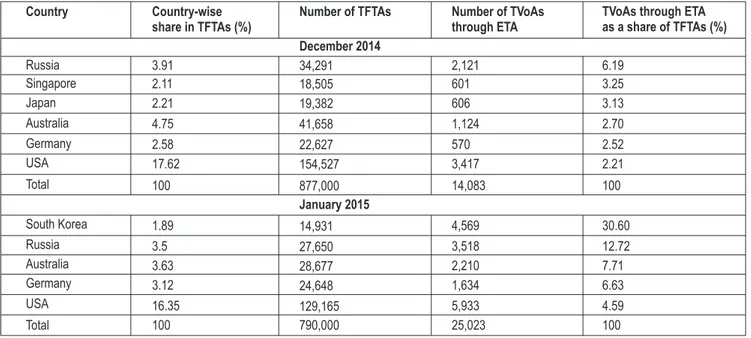
Moreover, the share of TVoAs through ETA seems to be on the rise. For instance, Table 6 shows that 4.59 percent of Americans in India in January 2015 availed TVoA through ETA, as compared to 2.21 percent in December 2014, recording a growth of 107.03 percent over the month. However, it might be too early to attribute the surge of foreign tourist arrivals in India to the scheme of TVoA through ETA. The average share of TVoAs issued through ETA in the TFTAs continues to be a very small share. For instance, in December 2014, only 2.21 percent of Americans entered India by availing the TVoA through ETA, while in January 2015, the figure stood at 4.59 percent.
To conclude, the hope of India that the new modernised and extended scheme—from just five TVoA countries in 2010 to 44 countries by the end of 2014—and TVoAs through ETA will boost
iv the tourism industry may appear a bit premature.
What Limits the Success?
In evaluating the impact of the TVoA, and particularly the TVoA through ETA, the authors attempt to assess the implementation and drafting of the scheme:
• Why has the share of TVoAs as a percent of total TFTAs not gone up in India, both over the years and across countries? Is modernising the industry by granting TVoAs through ETA the answer? If so, why does the share of TVoAs through ETA in total TFTAs not look all that
iv. At first glance, it may appear that ETA is not a great incentive, as it only avoids sending the passport to the embassies. Moreover, having to apply online is problematic for tourist-source countries with very low internet penetration. But it can also be argued that it should be easier to find a place with internet in, say, Liberia, to apply online for a visa to Sweden than it would be to engage in the usual procedure and travel to a neighbouring country that has a Swedish embassy. While no conclusion on the effectiveness of the ETA provision can be drawn just quite yet, the authors feel that ETA is a good bridge because: 1) it would be easier to get a visa beforehand rather than having to fulfil the obligations at the immigration checkpoint, where one could face infrastructural difficulties in terms of language, payment, understanding of the system at the airport, etc.; and 2) digitising systems is advantageous for authorities in getting timely information—if already enough developed in terms of electronic means—and it may in some respects be more reliable and easier to handle than applying at arrival. The authors are not ignoring the fact that the latter is related to how cumbersome the application process is, which it inevitably could be for a foreigner not familiar with the system. Moreover, digitisation goes in hand with the objective of a Digital India as the Prime Minister suggested on 20 August 2014 (http://pib.nic.in/newsite/ PrintRelease.aspx?relid=108926), which could only prove beneficial over time, as timely and immediate access to data can be used to form beneficial policies.
48, 49, 50
Table 6: Performance of TVoAs through ETA in TFTAs
Country-wise share in TFTAs (%)
Country Number of TFTAs Number of TVoAs through ETA
TVoAs through ETA as a share of TFTAs (%) Russia Singapore Japan Australia Germany USA Total South Korea Russia Australia Germany USA Total 3.91 2.11 2.21 4.75 2.58 17.62 100 1.89 3.5 3.63 3.12 16.35 100 December 2014 34,291 18,505 19,382 41,658 22,627 154,527 877,000 January 2015 14,931 27,650 28,677 24,648 129,165 790,000 2,121 601 606 1,124 570 3,417 14,083 4,569 3,518 2,210 1,634 5,933 25,023 6.19 3.25 3.13 2.70 2.52 2.21 100 30.60 12.72 7.71 6.63 4.59 100
encouraging? Is it because India does not have the required clarity and technicality to run the system smoothly and functionally?
What is clear is that the implementation of the scheme has been poor. First, there is confusion as to what the scheme really means. To a layman, a tourist visa on arrival would really mean arriving in India and receiving a 30-day tourist visa at immigration on showing
51
his/her passport. However, the official website is not very clear whether this is the case, as instruction number 5 states that the applicant from the eligible country should carry a copy of ETA with him/her at the time of travel, while instruction number 1 states that applicants from the eligible countries may apply online a minimum of four days in advance to the date of arrival with a window of 30 days. This raises the question whether the TVoA will only be granted to the applicants of eligible countries if they have a copy of the ETA along with them
v at the time of travel.
Secondly, confusion lies in the objective of the visa scheme. For instance, the official website states that those “international travellers whose sole objective of visiting India is recreation, sightseeing, casual visit to meet friends or relatives, short duration medical treatment or casual business visit” are covered. However, the official website fails to highlight what would qualify as a casual business visit. In comparison, the Australian government clearly specifies that eligible international travellers to Australia who have an Electronic Travel Authority can undertake business visitor activities which include: (1) Making general business or employment enquires; (2) investigating, negotiating, signing or reviewing a business contract; (3) activities carried out as part of an official government-to-government visit; and (4) participating in conferences, trade fairs or seminars as long as they are not being paid by the
52
organiser for their participation. The Indian definition for “short duration medical treatment” faces similar problems. The official Indian website fails to highlight what qualifies as a short duration medical treatment. Again, in comparison, the Australian government more clearly issues a “Medical Treatment Visa (subclass 602)” that allows people to travel to Australia: (1) For medical treatment or consultations; (2) to support someone needing
53 medical treatment who holds or has applied for this visa; and (3) to donate an organ.
This lack of clarity in the Indian scheme is only aggravated by the alleged technical difficulties of running the system. For instance, international travellers have consistently blogged about the difficulties of using the ETA system, including issues with uploading photos, acceptance
54 of phone numbers and the payment of $60 to obtain the ETA.
v. See the confusion being highlighted by travellers to India on http://goo.gl/g7Upo5, and http://goo.gl/ENrk4h. In its press release “MHA renames Tourist Visa on Arrival scheme as e-Tourist Visa from tomorrow,” (Press Information Bureau, Government of India, April 14, 2015, http://pib.nic.in/newsite/PrintRelease.aspx?relid=118240), the government clarifies that “...the name of the scheme (TVoA-ETA) is creating confusion among tourists. Tourist presumed as if the Visa is being granted on arrival, however in present system the pre-authorization of Visa to foreigners is being given prior to travel.” This step is viewed in a positive direction. However, the “instructions for applicant” on the official website do not lay down the guidelines clearly, particularly whether ETA is mandatory or not. Clarity on the “instructions for applicant” should be addressed as soon as possible.
55
Although there have been success stories of the TVoA enabled through ETA, complaints of getting around the online system seem to outweigh the little success it has found among
56
travellers. Given the hassles involved, travellers seem to continue to prefer to arrange for their tourist visa for India from the Indian embassy in their home country before they
57 depart.
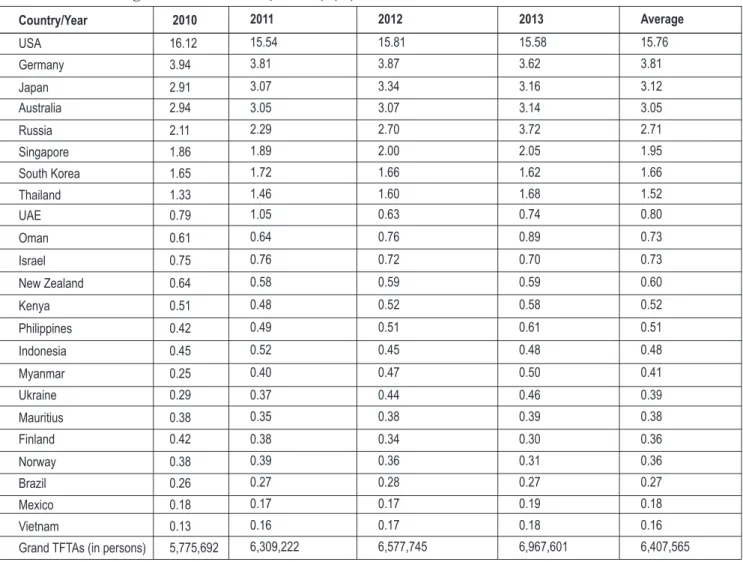
• Another question that can be posed is whether the countries to which the TVoA scheme has been extended are to be blamed. Table 7 shows that the average inbound tourist arrivals from the majority of the eligible 44 countries (and for which the data is available) do not contribute even one percent of the TFTAs in India for the period 2010-2013.
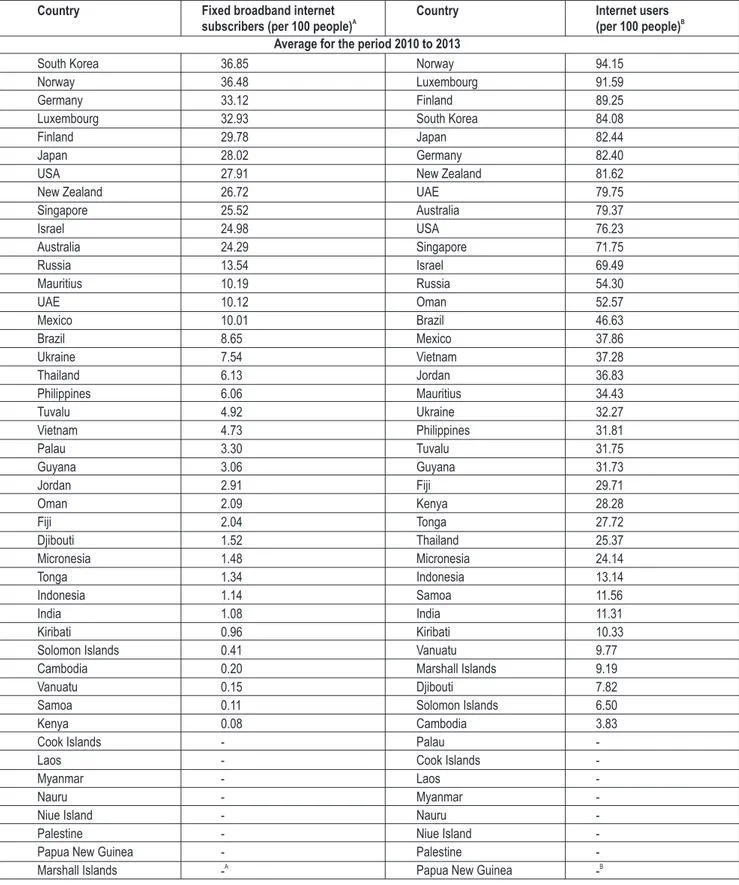
Moreover, applicants from eligible countries have to apply for a TVoA through the ETA scheme online, thereby making the latter mandatory. However, a deeper look into the countries that have to go through this process highlights the reasons for its lack of success. In the countries where information is available, Table 8 shows that the average access to the internet during the period 2010-2013 varied from as high as approximately 94 persons in every 100 in Norway to as low as
58, 59
Table 7: Total Foreign Tourist Arrivals (TFTAs) (%)
Country/Year 2010 2011 2012 2013 Average USA Germany Japan Australia Russia Singapore South Korea Thailand UAE Oman Israel New Zealand Kenya Philippines Indonesia Myanmar Ukraine Mauritius Finland Norway Brazil Mexico Vietnam
Grand TFTAs (in persons)
16.12 3.94 2.91 2.94 2.11 1.86 1.65 1.33 0.79 0.61 0.75 0.64 0.51 0.42 0.45 0.25 0.29 0.38 0.42 0.38 0.26 0.18 0.13 5,775,692 15.54 3.81 3.07 3.05 2.29 1.89 1.72 1.46 1.05 0.64 0.76 0.58 0.48 0.49 0.52 0.40 0.37 0.35 0.38 0.39 0.27 0.17 0.16 6,309,222 15.81 3.87 3.34 3.07 2.70 2.00 1.66 1.60 0.63 0.76 0.72 0.59 0.52 0.51 0.45 0.47 0.44 0.38 0.34 0.36 0.28 0.17 0.17 6,577,745 15.58 3.62 3.16 3.14 3.72 2.05 1.62 1.68 0.74 0.89 0.70 0.59 0.58 0.61 0.48 0.50 0.46 0.39 0.30 0.31 0.27 0.19 0.18 6,967,601 15.76 3.81 3.12 3.05 2.71 1.95 1.66 1.52 0.80 0.73 0.73 0.60 0.52 0.51 0.48 0.41 0.39 0.38 0.36 0.36 0.27 0.18 0.16 6,407,565
Data on the remaining 23 countries and for the year 2014 is not reported as the information in the year books and press releases by the Indian Ministry of Tourism is not available. Countries in the table are sorted in descending order on the basis of averages. Years (2010-2013) represent a calendar year, i.e.,12 months from January to December.
approximately four persons in every 100 in Cambodia. Furthermore, the average number of fixed broadband subscribers for the period 2010-2013 varied from as high as approximately 37 persons in every 100 in South Korea to almost no individual in Kenya (0.08 persons in every 100 persons).
Countries are sorted in descending order. '-' represents no information available. is the number of broadband subscribers with a digital subscriber
B
line, cable modem, or other high-speed technology. are individuals who have used the internet via a computer, mobile phone, personal digital
B
assistant, games machine, digital TV etc. (from any location) in the last 12 months. While gives a general idea of access, caution must be exercised
A
while comparing statistics across countries for . This is becaused data for A is collected by national statistics offices through household surveys and survey questions and definitions differ; these estimates may not be strictly comparable across countries. Years (2010, 2011, 2012, and 2013) represent a calendar year, i.e.,12 months from January to December. Sri Lanka has not been included in the table because it is only partially opened.
A
60
Table 8: Internet Usage Across the 44 Eligible Countries and India
Country Fixed broadband internet
A
subscribers (per 100 people)
Country Internet users
B
(per 100 people) Average for the period 2010 to 2013
South Korea Norway Germany Luxembourg Finland Japan USA New Zealand Singapore Israel Australia Russia Mauritius UAE Mexico Brazil Ukraine Thailand Philippines Tuvalu Vietnam Palau Guyana Jordan Oman Fiji Djibouti Micronesia Tonga Indonesia India Kiribati Solomon Islands Cambodia Vanuatu Samoa Kenya Cook Islands Laos Myanmar Nauru Niue Island Palestine Papua New Guinea Marshall Islands 36.85 36.48 33.12 32.93 29.78 28.02 27.91 26.72 25.52 24.98 24.29 13.54 10.19 10.12 10.01 8.65 7.54 6.13 6.06 4.92 4.73 3.30 3.06 2.91 2.09 2.04 1.52 1.48 1.34 1.14 1.08 0.96 0.41 0.20 0.15 0.11 0.08 -A -Norway Luxembourg Finland South Korea Japan Germany New Zealand UAE Australia USA Singapore Israel Russia Oman Brazil Mexico Vietnam Jordan Mauritius Ukraine Philippines Tuvalu Guyana Fiji Kenya Tonga Thailand Micronesia Indonesia Samoa India Kiribati Vanuatu Marshall Islands Djibouti Solomon Islands Cambodia Palau Cook Islands Laos Myanmar Nauru Niue Island Palestine Papua New Guinea
94.15 91.59 89.25 84.08 82.44 82.40 81.62 79.75 79.37 76.23 71.75 69.49 54.30 52.57 46.63 37.86 37.28 36.83 34.43 32.27 31.81 31.75 31.73 29.71 28.28 27.72 25.37 24.14 13.14 11.56 11.31 10.33 9.77 9.19 7.82 6.50 3.83 -B
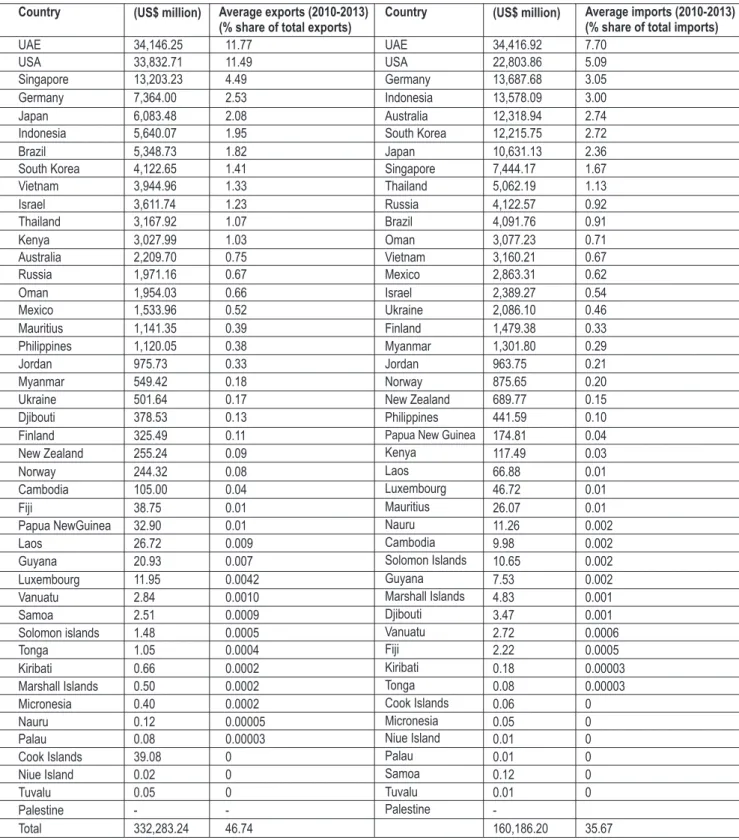
-Moreover, as seen in Table 9, the average exports and imports of India to and from the eligible countries remains less than 50 percent of India's total exports and imports; India's export share to the eligible countries in total exports stands at 47 percent while import share stands at 36per cent. As a matter of fact, for the majority of the included countries, their individual export and import vis-à-vis India accounts for less than one percent of the total exports and imports of India. For instance, India's average trade with countries like Vanuatu, Solomon Islands, Tonga and Micronesia for the period 2010-2013 is negligible.
Table 9: International Trade with the 44 Eligible Countries
Country (US$ million) Average exports (2010-2013) (% share of total exports)
Country (US$ million) Average imports (2010-2013) (% share of total imports)
UAE USA Singapore Germany Japan Indonesia Brazil South Korea Vietnam Israel Thailand Kenya Australia Russia Oman Mexico Mauritius Philippines Jordan Myanmar Ukraine Djibouti Finland New Zealand Norway Cambodia Fiji Papua NewGuinea Laos Guyana Luxembourg Vanuatu Samoa Solomon islands Tonga Kiribati Marshall Islands Micronesia Nauru Palau Cook Islands Niue Island Tuvalu Palestine Total 34,146.25 33,832.71 13,203.23 7,364.00 6,083.48 5,640.07 5,348.73 4,122.65 3,944.96 3,611.74 3,167.92 3,027.99 2,209.70 1,971.16 1,954.03 1,533.96 1,141.35 1,120.05 975.73 549.42 501.64 378.53 325.49 255.24 244.32 105.00 38.75 32.90 26.72 20.93 11.95 2.84 2.51 1.48 1.05 0.66 0.50 0.40 0.12 0.08 39.08 0.02 0.05 -332,283.24 11.77 11.49 4.49 2.53 2.08 1.95 1.82 1.41 1.33 1.23 1.07 1.03 0.75 0.67 0.66 0.52 0.39 0.38 0.33 0.18 0.17 0.13 0.11 0.09 0.08 0.04 0.01 0.01 0.009 0.007 0.0042 0.0010 0.0009 0.0005 0.0004 0.0002 0.0002 0.0002 0.00005 0.00003 0 0 0 -46.74 UAE USA Germany Indonesia Australia South Korea Japan Singapore Thailand Russia Brazil Oman Vietnam Mexico Israel Ukraine Finland Myanmar Jordan Norway New Zealand Philippines
Papua New Guinea
Kenya Laos Luxembourg Mauritius Nauru Cambodia Solomon Islands Guyana Marshall Islands Djibouti Vanuatu Fiji Kiribati Tonga Cook Islands Micronesia Niue Island Palau Samoa Tuvalu Palestine 34,416.92 22,803.86 13,687.68 13,578.09 12,318.94 12,215.75 10,631.13 7,444.17 5,062.19 4,122.57 4,091.76 3,077.23 3,160.21 2,863.31 2,389.27 2,086.10 1,479.38 1,301.80 963.75 875.65 689.77 441.59 174.81 117.49 66.88 46.72 26.07 11.26 9.98 10.65 7.53 4.83 3.47 2.72 2.22 0.18 0.08 0.06 0.05 0.01 0.01 0.12 0.01 -160,186.20 7.70 5.09 3.05 3.00 2.74 2.72 2.36 1.67 1.13 0.92 0.91 0.71 0.67 0.62 0.54 0.46 0.33 0.29 0.21 0.20 0.15 0.10 0.04 0.03 0.01 0.01 0.01 0.002 0.002 0.002 0.002 0.001 0.001 0.0006 0.0005 0.00003 0.00003 0 0 0 0 0 0 35.67
Countries are sorted in descending order.'-' represents no information available. Data is taken from the Ministry of Commerce and Industry, Government of India and is from April 2010 to March 2013.
Policy Implications
India has adopted a TVoA facility and has currently extended it to 44 countries with a partial opening to Sri Lanka. This facility has now been enabled through ETA. Despite such substantial steps, international travellers to India still seem to prefer to obtain their visas at the Indian mission in their home countries, arguably to avoid any hassles in India. The hope that the ETA would help raise the level of confidence in the TVoA does not seem to have lived up to expectations yet. In this brief, it has been noted that the growth of TVoAs and the growth of TVoAs as a share of TFTAs (whether the TVoA has been granted through ETA or not) has not significantly gained momentum among international travellers to India since implementation of the scheme in January 2010.
To strategically implement the visa facilitating steps to maximise economic benefit, the authors make two propositions. The first strategic step should focus on the smooth implementation of TVoA, which is now enabled through ETA. In this regard, India should bring in more clarity about the objective of the TVoA. Several steps need to be taken for the same. Firstly, if the objective of the policy is to also encourage businesses and medical tourism, it will help to rename the TVoA “Visa on
vi
Arrival.” This will avoid confusion as well as redirect a number of tourists who may have avoided the scheme because of its name. However, if India still wants to continue with the name “Tourist Visa on Arrival” scheme, which is now “e-Tourist Visa,” then the government should think of diversifying the objective of the implemented scheme into different groups, such as “Visa on Arrival (Business Entrant)” and “Visa on Arrival (Medical Treatment Entrant),” or have diversifying
61
options while applying, such as (1) Tourist, (2) Business and (3) Medical. This will help not only in correcting the misnomer but also in collecting data to devise ongoing strategies to maximise the economic benefit of the same. Irrespective of the change in name, India should ensure greater clarity regarding business activities and short duration medical treatments that eligible travellers can undertake while in India on this visa.
The second strategic step should focus on the countries, or rather the sequence of countries, to which the TVoA facility should be extended. From 'Look East' India has now taken a stand to 'Act
62
East.' The Finance Minister in his Annual Budget for 2015-2016 stated that the 'Act East' policy of 63 the government endeavours to cultivate extensive and strategic relations in Southeast Asia. It appears to be a good strategy that in the process of 'Acting East,' the majority of the 44 countries that are eligible for a TVoA in India are east to India (either in Asia or the Oceania region). Moreover, the United Nations World Tourist Organization in its tourism highlights for 2014 demonstrates that the large majority of international travel takes place within the travellers' own regions with about four out of five worldwide arrivals originating from the same region. Europe (52 percent) was the world's largest source region, generating over half of the world's international arrivals in 2013,
vi. The change in the name of the policy from 'Tourist Visa on Arrival through ETA' to 'e-tourist visa,' with effect from 15 April 2015, still does not resolve the problem relating to the objective of the scheme.
followed by Asia and the Pacific (23 percent), the Americas (16 percent), the Middle East (three 64
percent) and Africa (three percent).
The strategy can only be strengthened by focusing on the economic importance of the countries involved in the scheme now and in the future. One of the ways to identify the economic importance of the countries could be to look for support in the 'Make in India' global initiative launched by the
65
Prime Minister on 25 September 2014. The initiative is a major new national programme designed 66
to transform India into a global manufacturing hub. Therefore, it is suggested that India combines the 'Make in India' initiative and the 'Act East' Policy with the TVoA scheme by analysing the economic importance of countries, notwithstanding reciprocity, political diplomacy and obligations arising out of the international agreements to which India is a signatory. For instance, it is noted that
67
the average share of Chinese tourists stands at two percent of the total foreign tourist arrivals in India, while at the same time the bilateral trade deficit with China only seems to be increasing. Therefore, if one of the objectives of the TVoA scheme is to promote casual business visits, allowing Chinese to obtain their tourist visa on arrival can only prove beneficial in strengthening
vii trade ties with China along with a boost in tourism.
Moreover, the government could focus on extending the TVoA scheme to countries of economic significance. For instance, India could extend the facility to its large trading partners (for the year
68 69
2013-2014, only 11 out of the top 25 export destinations of India and only 10 out of the top 25 import sources for India were eligible for the TVoA scheme) and to partners with which it has large
70
inward and outward foreign direct investment (FDI) (for the year 2013-2014, five out of the top 10 source countries for FDI were eligible for the TVoA scheme). Thus, India could use the TVoA as bait for promoting the “Make in India” campaign as well as strengthening the “Act East” policy . India could also focus on countries that are top spenders in international tourism (only four out of the top 10 countries that undertake massive tourism spending abroad are eligible for the TVoA
71
scheme ). For instance, Chinese tourism spending abroad, which leaped to first place in 2012 and 2013, has increased almost tenfold in the 13 years since 2000. With a market share of 11.1 percent in
72 2013, Chinese tourism spending abroad increased by $27 billion to a record $129 billion.
Conclusion
In a nutshell, the Indian initiative to facilitate the visa process is to be lauded. However, the scheme needs to be closely scrutinised to ensure any substantial impact, as laid out above. The lessons of the Indian reforms also seem to be well worth considering elsewhere: Facilitating the movement of
vii. And indeed, it has very recently been confirmed that Chinese citizens will be eligible for e-tourist visa. See http://indianexpress.com/article/india/india-others/pm-narendra-modi-set-to-announce-e-visa-facility-to-chinese/. (Regarding the point made above on trade, it is acknowledged that while export of goods and services from India to China, through increased business ties and particularly in the sectors promoted by 'Make in India' campaign, and export tourism (i.e. money spent by Chinese tourists in India) may increase, an indirect spillover may occur where intra- and inter-industry imports from China rise, thereby aggravating the trade deficit.)
persons is not only important for the ever-expanding tourism industry but also for economies in general in an era of globalisation and international value chains. As one multinational firm puts it, “We work globally—we need people to meet and exchange knowledge. We also need to adapt quickly, or we lose competitive advantages. Mobility is therefore very important to us. Business is
73
better when the right people are at the right place at the right time.” To “Make [it] in India” or elsewhere, the smooth movement of persons is key.
Endnotes:
1. “World Tourism Barometer (Volume 13),” United Nations World Tourism Organization, 2015. 2. Ibid.
3. “UNWTO Tourism Highlights (2014 Edition),” United Nations World Tourism Organization, 2014. 4. Ibid.
5. “Visa Openness Report,” United Nations World Tourism Organization, 2014. 6. Ibid.
7. Ibid.
8. “Finance Minister Arun Jaitley tries to strike a balance with 'Visa on Arrival' facility,” Economic Times, July 15, 2014, http://goo.gl/lg3ht2.
9. Prime Minister's Media Statement during visit to Sri Lanka, Press Information Bureau, Government of India, March 13, 2015, http://pib.nic.in/newsite/PrintRelease.aspx?relid=116947.
10. Total foreign tourist arrivals from a given country c in a given year t in India or total foreign tourist arrivals in a given year t India represents (proxies) the total tourist visas issued to a given country c in a given year t by India or total tourist visas issued in a given year t by India.
11. “Visa on Arrival Facility introduced for tourists coming from five countries,” Press Information Bureau, Government of India, December 9, 2009, http://pib.nic.in/newsite/erelease.aspx?relid=55551.
12. “Major Initiatives and Achievements of Ministry of Tourism in the year 2010,” Press Information Bureau, Government of India, December 25, 2010, http://pib.nic.in/newsite/erelease.aspx?relid=68697.
13. “Tourist Visa on Arrival to be Introduced for Nationals of Four More Countries from Saturday,” Press Information Bureau, Government of India, December 30, 2010, http://pib.nic.in/newsite/erelease.aspx?relid=68780.
14. Ibid.
15. “Tourist Visa on Arrival Scheme Extended to Nationals of Myanmar and Indonesia,” Press Information Bureau, Government of India, January 25, 2011, http://www.pib.nic.in/newsite/erelease.aspx?relid=69340.
16. “Visa on Arrival Scheme,” Press Information Bureau, Government of India, March 1, 2011, http://pib.nic.in/newsite/erelease.aspx?relid=70406.
17. “Statement on Tourist Visa on Arrival (VoA) Scheme: May, 2014,” Press Information Bureau, Government of India, June 20, 2014, http://pib.nic.in/newsite/PrintRelease.aspx?relid=105761.
18. Ibid.
19. Since the press release for the date of announcement is not available, it has been assumed that the date of announcement and the date of implementation for tourists coming from South Korea to avail of the TVoA is the same. 20. “Year End Review,” Press Infor mation Bureau, Government of India, December 31, 2014,
http://pib.nic.in/newsite/PrintRelease.aspx?relid=114238. 21. Ibid.
22. “TVoAs in February 2015 shows an increase of 1162% over the TVoAs of February 2014. USA registers highest share of TVoAs in February, 2015,” Press Information Bureau, Government of India, March 13, 2015, http://pib.nic.in/newsite/PrintRelease.aspx?relid=117009.
23. Ibid.
24. Since the press release for the date of announcement is not available, it has been assumed that the date of announcement and date of implementation for tourists coming from Guyana to avail of the TVoA is the same.
25. “Prime Minister's Media Statement during visit to Sri Lanka,” Press Information Bureau, Government of India, March 13, 2015, http://pib.nic.in/newsite/PrintRelease.aspx?relid=116947.
26. India Tourism Statistics 2013, Ministry of Tourism, Government of India. 27. India Tourism Statistics 2012, Ministry of Tourism, Government of India. ***************************
28. Brief write-up on Tourist Visa on Arrival, 2010, 2011, 2012, 2013, 2014, Ministry of Tourism, Government of India. 29. “India Receives 5.58 million Foreign Tourists in 2010; 6459 Visitors from Five Countries Avail Visa on Arrival Scheme
Introduced in 2010,” Press Information Bureau, Government of India, January 7, 2011, http://pib.nic.in/newsite/ erelease.aspx?relid=68923.
30. India Tourism Statistics 2013, Ministry of Tourism, Government of India. 31. India Tourism Statistics 2012, Ministry of Tourism, Government of India.
32. Brief write-up on Tourist Visa on Arrival, 2010, 2011, 2012, 2013, 2014, Ministry of Tourism, Government of India. 33. “TVoA register an increase of 421.6% during December, 2014 over the same period last year” or “TVoAs register an
increase of 92.4% during January-December, 2014 over the same period,” Press Information Bureau, Government of India, January 19, 2015, http://pib.nic.in/newsite/PrintRelease.aspx?relid=114763.
34. “India Receives 5.58 million Foreign Tourists in 2010; 6459 Visitors from Five Countries Avail Visa on Arrival Scheme Introduced in 2010,” Press Infor mation Bureau, Government of India, Januar y 7, 2011, http://pib.nic.in/newsite/erelease.aspx?relid=68923.
35. India Tourism Statistics 2013, Ministry of Tourism, Government of India. 36. India Tourism Statistics 2012, Ministry of Tourism, Government of India.
37. Brief write-up on Tourist Visa on Arrival, 2010, 2011, 2012, 2013, 2014, Ministry of Tourism, Government of India. 38. “India Receives 5.58 million Foreign Tourists in 2010; 6459 Visitors from Five Countries Avail Visa on Arrival Scheme
Introduced in 2010,” Press Infor mation Bureau, Government of India, Januar y 7, 2011, http://pib.nic.in/newsite/erelease.aspx?relid=68923.
39. The exceptions were in the case of nationals of Afghanistan, Bangladesh, China, Iran, Iraq, Pakistan, Sudan, foreigners of Bangladesh and Pakistan origins and Stateless persons (“Chiranjeevi Welcomes Visa Relaxation,” Press Information Bureau, Government of India, December 4, 2012, http://www.pib.nic.in/newsite/erelease.aspx?relid=89909). 40. “Union Home Minister and Tourism Minister launch landmark Tourist Visa on Arrival Enabled with Electronic Travel
Authorization Scheme,” Press Information Bureau, Government of India, November 27, 2014, http://pib.nic.in/newsite/erelease.aspx?relid=111983.
41. “Year End Review,” Press Infor mation Bureau, Government of India, December 31, 2014, http://pib.nic.in/newsite/PrintRelease.aspx?relid=114238.
42. The (manual) tourist visa on arrival available for 12 countries (Japan, Singapore, Philippines, Finland, Luxembourg, New Zealand, Cambodia, Laos, Vietnam, Myanmar, Indonesia and South Korea) was discontinued from 27 January 2015. Now, all the eligible 44 countries plus parts of Sri Lanka (as shown in Table 1) are eligible for e-tourist visa. Source: http://goo.gl/OrgwTw.
43. See the coverage at Wall Street Journal (“India Visa-On-Arrival Expands to More Countries,” November 26, 2014, http://goo.gl/5qcyU6) and BBC (“India launches new visa rules to boost tourism,” November 28, 2014, http://goo.gl/LNnRb1), for instance.
44. See “TVoA register an increase of 421.6% during December, 2014 over the same period last year” or “ TVoA register an increase of 92.4% during January-December, 2014 over the same period,” Press Information Bureau, Government of India, January 19, 2015, http://pib.nic.in/newsite/PrintRelease.aspx?relid=114763) for December 2014, and “TVoAs Register a Growth of 1214.9% During January 2015 Over the Same Period Last Year,” Press Information Bureau, Government of India, February 25, 2015, http://pib.nic.in/newsite/PrintRelease.aspx?relid=115822 for January, 2015.
45. “Full text of Budget 2015-2016 speech,” The Hindu, February 28, 2015, http://goo.gl/A1wzKx.
46. The success of the scheme is measured for only eight of the 44 eligible countries as data is only available from “Brief Write-up during 2014 and 2015” undertaken by the Ministry of Tourism, Government of India, http://tourism.gov.in/TourismDivision/AboutDivision.aspx?Name=Market%20Research%20and%20Statistics. 47. Brief write-up on Tourist Visa on Arrival, 2010, 2011, 2012, 2013, 2014, Ministry of Tourism, Government of India. 48. India Tourism Statistics 2013, Ministry of Tourism, Government of India.
49. India Tourism Statistics 2012, Ministry of Tourism, Government of India.
50. Brief write-up on Tourist Visa on Arrival, 2010, 2011, 2012, 2013, 2014. Ministry of Tourism, Government of India. 51. The official website for applying for a visa online: https://indianvisaonline.gov.in/visa/tvoa.html.
52. See the Australian system for comparison at http://www.immi.gov.au/Visas/Pages/601.aspx. 53. See the Australian system for comparison at http://www.immi.gov.au/Visas/Pages/602.aspx.
54. See complaints of travellers to India using the online system to obtain their tourist visa at http://goo.gl/o12nFg, for instance.
55. See some happy travellers' blogging on the success of the scheme at http://goo.gl/7y1bep.
56. Although the government does need to pay attention to the complaints blogged by travellers, the authors do give some benefit of doubt to the government, as it appears that these complaints were blogged during the early stages of the
Observer Research Foundation,
20, Rouse Avenue, New Delhi-110 002
Phone: +91-11-43520020 Fax: +91-11-43520003
www.orfonline.org email: orf@orfonline.org
Natasha Agarwal is an independent consultant with Indian Institute of Foreign Trade, New Delhi. Magnus Lodefalk is a Research Fellow at Orebro University, Sweden.
ABOUT THE AUTHORS
implementation of the online system which could perhaps happen in any country. Nevertheless, the government needs to address the partially working online system swiftly.
57. Despite efforts towards modernising, travellers continue to use the 'Indian Mission' route rather than the 'online' route. See http://goo.gl/vsqEQ4, and http://goo.gl/RHQ6Es, for instance.
58. India Tourism Statistics 2013, Ministry of Tourism, Government of India. 59. India Tourism Statistics 2012, Ministry of Tourism, Government of India.
60. World Development Indicators, World Bank, 2010, 2011, 2012, 2013,data.worldbank.org/data-catalog/world-development-indicators.
61. For example, see the Australian ETA application at https://www.eta.immi.gov.au/ETAS3/etas.
62. “English Rendering of the Opening Statement by the Prime Minister at the Indian-ASEAN Summit,” Press Infor mation Bureau, Government of India, November 12, 2014, http://pib.nic.in/newsite/ PrintRelease.aspx?relid=111315.
63. “Act East Policy of the Government,” Press Information Bureau, Government of India, February 28, 2015, http://pib.nic.in/newsite/PrintRelease.aspx?relid=116168.
64. “UNWTO Tourism Highlights (2014 Edition),” United Nations World Tourism Organization, 2014.
65. “PM launches 'Make in India' global initiative,” Press Information Bureau, Government of India, September 25, 2014. 66. The official website of the 'Make in India' initiative can be found at www.makeinindia.gov.in.
67. Average of two percent has been calculated by looking at individual year foreign tourist arrivals in India from various yearbooks of India Tourism Statistics.
68. According to its share in total exports, the top 25 export destinations of India for the period 2013-2014 were USA (12.45%), UAE (9.71%), China (4.72%), Hong Kong (4.05%), Singapore (3.98%), Saudi Arabia (3.89%), UK (3.11%), Netherlands (2.54%), Germany (2.39%), Japan (2.17%), Belgium (2.03%), Bangladesh (1.96%), Brazil (1.77%), Vietnam (1.73%), Italy (1.68%), France (1.62%), South Africa (1.61%), Iran (1.58%), Indonesia (1.54%), Sri Lanka (1.44%), South Korea (1.34%), Malaysia (1.34%), Kenya (1.23%) and Israel (1.19%). Data taken from the Ministry of Commerce, Government of India.
69. According to its share in total imports, the top 25 import sources for India for the period 2013-2014 were China (11.33%), Saudi Arabia (8.09%), UAE (6.45%), USA (5.00%), Switzerland (4.29%), Iraq (4.11%), Kuwait (3.81%), Qatar (3.49%), Indonesia (3.30%), Nigeria (3.13%), Venezuela (3.10%), Germany (2.87%), South Korea (2.77%), Belgium (2.39%), Iran (2.89%), Australia (2.18%), Japan (2.11%), Malaysia (2.05%), Hong Kong (1.63%), Singapore (1.50%), South Africa (1.35%), UK (1.34%), Angola (1.33%), Thailand (1.19%) and Colombia (1.10%). Data taken from the Ministry of Commerce, Government of India.
70. According to its share in total FDI inflows, the top 10 source countries for India for the period 2013-2014 were Mauritius (44.07%), Netherlands (9.30%), Singapore (8.78%), Japan (7.33%), UK (5.59%), France (2.99%), USA (2.61%), Germany (2.55%), Cyprus (2.27%) and Spain (1.90%). Data is taken from Annual Report, Reserve Bank of India, August21, 2014, https://rbi.org.in/Scripts/AnnualReportPublications.aspx?Id=1139.
71. See table on international tourism spending on page 13 at “UNWTO Tourism Highlights (2014 Edition),” United Nations World Tourism Organization, 2014.
72. Ibid.
73. “Making Trade Happen – Business Perspective on Cross – Border Movement of Persons,” National Board of Trade, Government of Sweden, June 2013, http://www.kommers.se/Documents/dokumentarkiv/publikationer/2013/ rapporter/report-making-trade-happen.pdf.