http://www.diva-portal.org
Postprint
This is the accepted version of a paper presented at Proceeding for the Piarc International Winter Road Congress in Québec 2010.
Citation for the original published paper: Hjort, M., Wiklund, M., Öberg, G. (2010) Bus accidents in wintertime.
In: PIARC 2010 XIII International Winter Road Congress, February 8-11, 2010, Quebec, Canada: proceedings
N.B. When citing this work, cite the original published paper.
Permanent link to this version:
BUS ACCIDENTS IN WINTERTIME M. Hjort, M. Wiklund & G. Öberg
VTI, the Swedish National Road and Transport Research Institute, Linköping, Sweden mattias.hjort@vti.se, mats.wiklund@vti.se, gudrun.oberg@vti.se
ABSTRACT
Buses in Sweden have a low accident risk. However, statistics from 1996 - 2002 indicate that the number of bus accidents in Sweden with personal injuries have been increasing by 4% yearly. Buses also have a higher percentage of accidents that occur on ice/snow covered roads than other vehicles. In Sweden passenger cars must be equipped with winter tyres during the winter period. There is no such regulation for heavy vehicles, and many buses are using summer tyres all around the year. The present project had the purpose of looking at the bus-winter problem in more detail, with the main focus on tyres. Four different studies were carried out: tyre tests, focus group discussions, driving simulator tests and an accident study. Here is given a short summary concerning methods and conclusions of each sub project.
Tyre tests on smooth ice did not show any significant difference between summer tyres and studded winter tyres, while studded tyres exhibits a better ice grip than non-studded tyres. Nor did driving simulator tests with driving on ice covered road under the influence of heavy wind from the side show a difference between summer tyres and non-studded winter tyres. Also in these tests non-studded tyres were superior to non-non-studded. Accident statistics indicate that buses with summer tyres on the steering axle and winter tyres on the drive axle have the lowest estimated accident risk, which is in accordance with the results in a previous study. The results are however not statistically significant due the low number of accidents. Three focus groups were carried out and the importance of the tyres for traffic safety during winter was discussed. It is however hard from the gathered discussion material to estimate just how important the tyres really are. The results do not warrant a winter tyre regulation for heavy vehicles, and a restriction of the use of studded tyres for buses would probably have negative consequences on traffic safety.
KEYWORDS
BUSES / WINTER TYRES / ROAD FRICTION / TRAFFIC SAFETY / ACCIDENTS 1. INTRODUCTION
During bus transport there are, for obvious reasons, many people involved, either the passengers on board the bus or the other road users. This, combined with the bus being large and heavy, with the resulting disadvantages, for example, long stopping distance, is a reason to further study the safety of buses, especially for the wintertime when the roads may be slippery. A recent study shows that the annual number of passenger car occupant deaths per 100,000 cars in car-truck/bus collisions in Sweden has remained unchanged since the 1980s, but in car-car collisions it has decreased to one third of its former level. As crash objects, trucks and buses killed five times as many car occupants per truck/bus kilometre driven as did cars. The collisions were characterised by icy, snowy or wet conditions [1].
A VTI study from 2006 compared accident statistics between buses to other vehicle types during wintertime [2]. The information concerned accidents involving personal injuries that occurred in Sweden during seven winters, 1995/1996 – 2001/2002, and corresponding
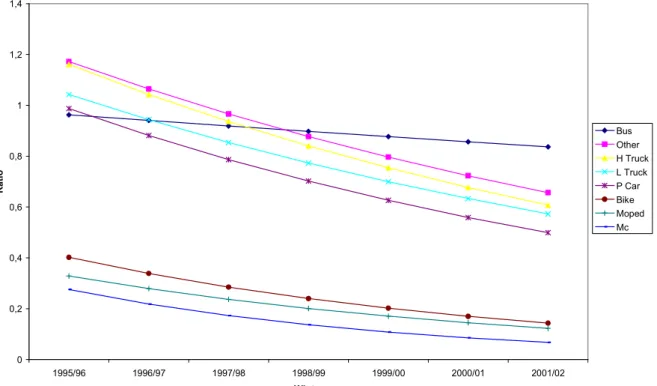
information was also collected from Finnish accident data. A Poisson regression indicates that the number of accidents with buses during wintertime in Sweden that involves personal injuries increase by 4% per year. Although the number of bus accidents wintertime is increasing, the ratio between the accidents occurring on icy/snowy roadways and those occurring on bare roadways seems to decrease. This ratio is decreasing for all vehicle types, see Figure 1, which could be a consequence of increasingly warmer winters in Sweden. Unfortunately, information about vehicle mileage for the different states of roadways is missing in the available statistics, so no conclusions can be made regarding the reason behind the decreasing ratio. It is however clear from Figure 1, that accidents with buses follow a different trend compared to other vehicle types, indicating that buses may be more sensitive to icy/snowy roadways than other vehicle types. Still, without information about the vehicle mileage, no clear conclusions can be made.
0 0,2 0,4 0,6 0,8 1 1,2 1,4 1995/96 1996/97 1997/98 1998/99 1999/00 2000/01 2001/02 Winter R a ti o Bus Other H Truck L Truck P Car Bike Moped Mc
Figure 1: Logistic regression of the ratio between accidents involving personal injuries during wintertime icy/snowy roadways and bare roadways for different vehicle types. More detailed studies where the accidents were divided into categories based on the two primary vehicle types also indicated problems with traffic safety for buses on icy or snowy roadways. The results from the Finnish accident statistics were similar. However none of the results in that study were statistically significant. The statistical uncertainty stems from a low number of accidents, but also from a lack of information regarding the actual travelled distance on different road conditions for the vehicles. To gain more insight into the problem the following studies were performed [12].
2. STATISTICAL ANALYSIS OF TYRE INFLUENCE ON ACCIDENTS
In the Swedish National database of traffic accidents, STRADA (Swedish Traffic Accident Data Acquisition) there is no information about what types of tyres the involved vehicles were equipped with. To find out whether the choice of tyres affects the accident risk for buses winter time, VTI sent out two different inquires among bus companies in Sweden. Both inquiries were carried out during two consecutive winters, 2005/2006 and 2006/2007.
The first inquiry, sent out to bus companies all over Sweden, had the purpose answer the question about the vehicle mileage on winter roads, and how this mileage was divided between icy/snowy roadways and bare roadways. In addition, detailed information about which tyres that were used was also collected. The second inquiry was sent out to all bus owners who have had one of its buses involved in a police reported accident. For this inquiry the main focus was on the tyres of these buses, but other information such as the road conditions on the scene of the accident were collected.
2.1. The inquiry regarding vehicle mileage
For the inquiries on vehicle mileage, 925 (out of 2000) questionnaires were received the first year and 884 (out of 1500) the second year. One purpose with these inquires was to map the use of tyres (winter or summer tyres), and how they are positioned on the different wheel axles. The results indicate that on the steering axle summer tyres and unstudded winter tyres are equally common (40-50% each). On the drive axle 20% of the buses had summer tyres, while 70-80% had unstudded tyres. Five percent of the buses were equipped with studded tyres on both steering axle and drive axle. These results could be compared to those from an earlier inquiry [3] conducted during the winter 1998/1999. Then, 65% of the buses had summer tyres on the steering axle, 60% had winter tyres on the drive axle. Thus, the share of summer tyres has decreased from the winter 1998/1999 to the winters 2005/2006 and 2006/2007.
The material was grouped into six different categories of tyre combinations.
Table 1: The division of tyres in different combinations. The values are given in percent. Steering axle /Drive axle Winter 2005/2006 Winter 2006/2007
summer/summer 20.0 19.1 summer/winter 28.1 22.2 winter/winter 46.3 47.8 winter/summer 0.3 0.1 studded/studded 3.9 7.1 studded/other 1.4 3.6
The inquires concerned the three winter months from December - February, and the driving distance on icy/snowy roadways during that period was derived by combining the following questions:
• What is the yearly driving distance of the bus?
• How large share of the period December – February did the bus drive on icy/snowy roadways? (multiple choice question ranging from 0 – 100% in steps of 10%)
• Was the bus driven more or less during the winter half year than the summer half year? (multiple choice question with five choices: much less, less, the same, more, much more).
For the calculation, the following weights corresponding to the last question were used: 0.33, 0.4, 0.5, 0.6, 0.67.
The winter 2006/2007 was unusually warm in Sweden which resulted in a much larger share of the vehicle mileage performed on bare roadways compared to the previous winter. The share of the estimated vehicle mileage that is performed on icy/snowy roadways is presented in table 2. The interpretation of the data in this table is not unambiguous, but it seems that buses with summer tyres on the steering axle only drive
less on ice/snow than those with summer tyres on drive axle only. Also, buses equipped with winter tyres on both axles do not seem to drive more on ice/snow than buses with winter tyres on the steering axle and summer tyres on the drive axle. Buses with studded tyres generally drive more on ice/snow than buses with other tyres.
Table 2: The share of the estimated vehicle mileage that is performed on bare roads, compared to icy/snowy roadways, divided into different tyre combinations.
Steering axle /Drive axle Bare roads Ice or snow
summer/summer 74 % 26 %
summer/winter or studded 73 % 27 %
winter/winter 67 % 33 %
studded/other 47 % 53 %
2.2. The inquiry regarding accidents
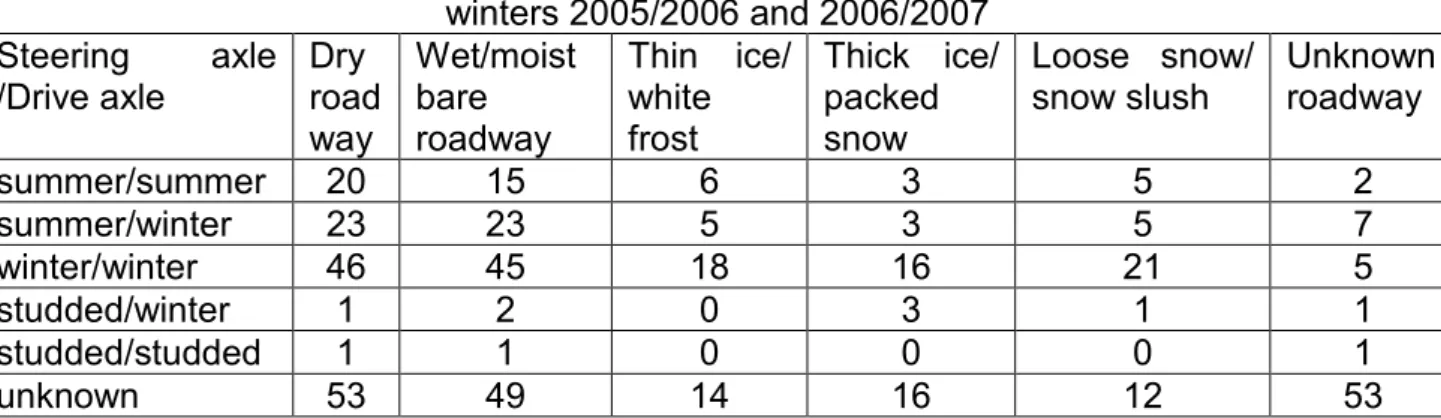
This inquiry was sent out to all bus owners who, according to STRADA, have had one of its buses involved in an accident with personal injuries during the months October – April for the two winters 2005/2006 and 2006/2007. In total 442 questionnaires were sent out and 285 of those were answered. The questions concerned among other things the tyres of the particular bus and the state of roadway at the accident. In Table 3 the accidents are divided into different tyre combinations and states of roadway.
Table 3: Number of police reported bus accidents with personal injuries during the two winters 2005/2006 and 2006/2007 Steering axle /Drive axle Dry road way Wet/moist bare roadway Thin ice/ white frost Thick ice/ packed snow Loose snow/ snow slush Unknown roadway summer/summer 20 15 6 3 5 2 summer/winter 23 23 5 3 5 7 winter/winter 46 45 18 16 21 5 studded/winter 1 2 0 3 1 1 studded/studded 1 1 0 0 0 1 unknown 53 49 14 16 12 53
Note that the row unknown in Table 3 includes those who did not answer the questionnaire and those eight that did answer the questionnaire but did not fill out the requested tyre information. For the statistical analysis the number of categories in Table 3 was reduced since each cell should contain at least five accidents. The tyres were divided into four different combinations, and the state of roadway into two. The accidents for these categories are presented in Table 4.
Table 4: The police reported bus accidents with personal injuries during the two winters 2005/2006 and 2006/2007 that was part of the accident analysis
Steering axle /Drive axle Bare roadway Ice or snow
A (summer/summer) 35 14
B (summer/winter or studded) 46 13
C (winter/winter) 93 55
2.3. Combined result of the two inquires
From the vehicle mileage inquiry, the driving distance on different roadway states was estimated for the three months December – February for the two investigated winters. To estimate also the vehicle mileage for the full winter period October – April, data from the Swedish Road Administration’s system for weather information, VViS, was used. By comparing the so called weather index [4] from 14 weather systems in Sweden for the three months December – February with the roadway information from the inquiry, a connection between weather index and the state of the roadway could be made. This was done separately for three different regions, the South, the Middle and the North of Sweden. Using the connection, and weather index information for the whole winter periods, the vehicle mileage for the buses was estimated for the whole period October to April. By using the same tyre combinations as in Table 4, comparable information regarding the vehicle mileage is presented in Table 5.
Table 5: The estimated distribution of the vehicle mileage between different states of roadways for the whole winter periods 2005/2006 and 2006/2007
Steering axle /Drive axle Bare roadway Ice or snow
A (summer/summer) 74 % 26 %
B (summer/winter or studded) 73 % 27 %
C (winter/winter) 67 % 33 %
D (studded/other) 47 % 53 %
By combining the results of Table 4 and 5, the risk for a bus accident with personal injury on icy/snowy roadways can be calculated relative the risk on bare roadways. The relative risk is constructed in order to decrease the possibility that other factors than tyres affect the accident risk. The choice of tyres is probably not independent on the type of bus, and if, for instance, different bus types have different accident risks it should not be included as a tyre type effect. The relative risk is presented in Table 6.
Table 6: The relative risk of an accident on icy/snowy roadways versus bare roadways
Steering axle /Drive axle Relative risk Confidence
interval (95%)
A (summer/summer) 1.15 (0.62; 2.14)
B (summer/winter or studded) 0.76 (0.41; 1.41)
C (winter/winter) 1.20 (0.86; 1.68)
D (studded/other) 1.17 (0.26; 5.23)
The lowest relative accident risk, 0.76, is achieved when the bus is equipped with winter tyres (studded or unstudded) on the drive axle and summer tyres on the steering axle. This was also the case in the previous study [3]. The other tyre combinations have approximately the same relative accident risk, 1.15 – 1.20. None of the results are statistically significant however. The confidence intervals have been calculated only with respect to the uncertainty in the accident data. For buses with studded tyres on both axles, the relative risk can not be estimated. They have only been involved in two accidents, both on bare roadway, and should thus be safe tyre combination on icy/snow.
3. TYRE TESTS AND DRIVING SIMULATOR STUDY
An earlier VTI study [3] of road grip for heavy vehicle tyres showed that there was little difference in grip on ice between unstudded winter tyres and worn summer tyres. It was concluded that studded tyres was the only way to prevent a dramatic decrease of available friction forces when a driver tries to utilise more than the maximum available friction, for example with a too large steering input. Advances in tyre technology with new rubber mixtures and an increased use of thin cutted slits across the rubber surface, so called sipes, have potentially lead to better winter tyres for heavy vehicles. Thus, to get a better understanding of the safety problem with buses on winter roadways, the performance of modern summer and winter tyres had to be determined.
3.1. Tyre friction measurements on ice
The VTI tyre test facility is a unique installation that was originally designed to measure tyre forces on low friction surfaces such as ice. It consists of a measurement rig where the wheel is mounted and a 55 meter long moving track inside a climate controlled building. The track can be covered with a very uniform, smooth layer of ice. It is capable of measuring tyre forces and moments both for passenger vehicles and heavy vehicle tyres also for high mu surfaces. The facility is depicted in Figure 2 and is further described in [5].
Figure 2: the VTI Tyre Test Facility, a close-up of the measurement rig.
In this study a total of 10 different tyres have been measured. The tyres are listed in Table 7. Four different categories of tyres were chosen: summer tyre, winter tyre that can be equipped with studs, studded winter tyre, and winter tyre that cannot be equipped with studs. The winter tyres that cannot be equipped with studs usually have more sipes compared to those that can be equipped with studs. Since tyres for the steering axle are different from those positioned on the drive axle, tyres of both types had to be included. For a better understanding of the effect of studs, a steering tyre equipped with the double amount of studs with respect to the normal number, and thus surpassing the legal limit of 150 studs, was included.
The tyres had to be evaluated with respect to both to their braking (longitudinal friction force) and steering (lateral friction force) abilities. The lateral friction performance is
important also for tyres on the drive axle, as the rear tyres produce part of the side force when driving in a curve. Lateral friction on the rear tyres is also needed for vehicle stability. Typical friction curves for a studded and non studded bus tyre on ice are displayed in Figure 3 for both steering (left figure) and braking (right figure).
-15 -10 -5 0 5 10 15 -0.2 -0.15 -0.1 -0.05 0 0.05 0.1 0.15 0.2
Wheel angle [degrees]
L a te ra l f ri c ti o n (µ y ) Unstudded Studded 0 20 40 60 80 100 0 0.02 0.04 0.06 0.08 0.1 0.12 0.14 Slip [%] L o n g it u d in a l f ri c tio n (µx ) Unstudded Studded
Figure 3: Typical friction curves for a studded and non studded bus tyre on ice, measured by VTI.
As can be seen in the right figure, maximum brake friction forces are achieved at 15-20 % slip (slip is a measure of the degree of wheel lock, where 0 % corresponds to an unbraked free rolling tyre, and 100% to a non rotating totally locked wheel). The friction at locked wheel on ice is less than half the maximum friction. This illustrates the importance of ABS brakes, which regulates the slip around the optimum value during braking. Analogously, the lateral friction forces during steering reach a peak value at 2 - 3 degrees wheel angle, and are then rapidly decreasing if the wheel angle is further increased. As shown in the left figure, for an unstudded tyre the friction at 15 degrees wheel angle is less than 50 % of the peak friction. This makes it difficult to perform a rapid steering manoeuvre, a lane change for example, and there is no help system (like ABS for braking) keeping the wheel angle close the optimum angle. A studded tyre can maintain more of the lateral forces for large wheel angles than an unstudded, which is one of the reasons that studded tyres are safer on icy roads.
Based on the longitudinal and lateral friction properties, VTI has developed a method to compare different tyres from a safety point of view. The so called ‘total ice grip value’ is a weighted average of different friction properties and was introduced in [6], where it was used for comparing the ice grip of more than 60 different passenger car tyres on different kind of ice, investigating the influence of age, tread depth, tread rubber hardness, stud protrusion and stud force. The concept has also been used for comparing the ice grip of different kinds of SUV (sport utility vehicle) tyres [7]. The following formula was used: Total ice grip value = N⋅(10⋅(2
µ
maxbrake+µ
lockedbrake +2µ
maxsteering +2µ
15steering)+Kbrake +2Ksteering)Equation 1 – The total ice grip value where
N = normalisation constant
= brake
= brake locked
µ brake friction at locked wheel
= steering
max
µ maximum lateral friction
= steering
15
µ lateral friction at 15° wheel angle
Kbrake = brake = brake locked max
µ
µ
brake stability Ksteering = steering = steering max 15µ
µ
steer stabilityThe two last parameters, brake and steer stability may need some explanation.
The brake stability is defined as the ratio between the brake friction at locked wheel and the maximum brake friction. A large difference between maximum brake friction and locked wheel friction results in a low stability value, which is considered to be bad since increased brake pedal pressure results in a decreased braking ability, contrary to the expected. The greater the decrease, the greater the negative surprise for the driver. The benefit of having a large maximum brake friction is hence reduced if the stability value is too low. ABS brakes prevent wheel lock which makes the brake stability less important. The efficiency of the ABS brakes is however negatively affected by a low stability value, as it becomes harder for the system to regulate close to the maximum friction.
The steer stability is defined, analogously, as the lateral friction at 15° wheel angle divided by the maximum lateral friction. If the maximum lateral friction is surpassed first on the rear wheels, the vehicle will start skidding with the rear end, resulting in an unwanted vehicle rotation. The lower the stability value, the faster will the skidding rotation develop, and is then naturally more difficult for the driver to suppress by steering corrections. If, instead, the front wheels surpass the angle for maximum lateral friction, the steering ability decreases as the steering wheel angle is increased. The lower the stability value, the greater is the decrease of the steering ability, which is experienced by the driver as if the vehicle lost its ability to steer and the vehicle is ploughing straight ahead. According to a Finnish study, skidding is the dominating cause for accidents on winter road conditions [8]. The steer stability is thus considered to be more important than brake stability. Electronic stability systems (ESC) are designed to intervene during a skidding situation, and have shown to be of great importance to traffic safety for passenger cars. It is however not yet clear how effective these systems are on very slippery road conditions like ice. On the contrary, a very recent VTI study with passenger cars indicated ESC can not compensate for bad tyres when driving on ice [9].
Table 7: The tested tyres.
Short name Name Category Placement
GY_F Good Year Ultra Grip WTS
295/80-R22,5
Winter
(can be equipped with studs) Steering
GY_D Good Year Ultra Grip WTD
295/80-R22,5
Winter
(can be equipped with studs) Drive
GY_F_Stud Good Year Ultra Grip WTS
295/80-R22,5 Studded (120 studs) Steering
GY_D_Stud Good Year Ultra Grip WTD
295/80-R22,5 Studded (96 studs) Drive
GY_F_Stud2 Good Year Ultra Grip WTS
MI_F Michelin X Pilote XFN 295/80-R22,5
Winter
(can not be equipped with studs)
Steering
MI_D Michelin XDN2 Grip
295/80-R22,5
Winter
(can not be equipped with studs)
Drive
SUM_CO Continental HSR Regional
Traffic 295/80-R22,5 Summer Steering
SUM_BR Bridgestone R249
295/80-R22,5 Summer Steering
SUM_MI Michelin XZE2+
295/80-R22,5 Summer Steering
The braking and steering friction for each tyre in Table 7 were measured in the VTI tyre test facility on smooth ice. The ice temperature was kept to -4 ± 0.5 degrees. Two different wheel loads, 20 and 40 kN, were used in these measurements for representing an empty and a fully loaded bus. The total ice grip value was calculated for both wheel loads, and the average values for the two loads are displayed in Figure 4. The normalisation constant was chosen so that the tyre labelled GY_F was given the value 100.
0 20 40 60 80 100 120 140 160 180 200 GY_ F GY_ D GY_ F_St ud GY_ D_S tud GY_ F_St ud2 MI_F MI_D SUM _BR SUM _M I SUM _CO T o ta l ic e g ri p v a lu e
Figure 4: The total ice grip values for the tyres listed in Table 7.
From Figure 4 we conclude that the difference over all between the unstudded winter tyres (GY_F, GY_D, MI_F, MI_D) and the summer tyres (SUM_BR, SUM_MI, SUM_CO) is small. Only the studded tyres as a group stand out, and among those especially the superstudded tyre with an illegal amount of studs (GY_F_Stud2). It is interesting to compare the ice friction for the bus tyres with the ice friction values of SUV tyres during similar conditions, from an earlier study [6]. In Figure 5 the average values for each group of bus tyres and SUV tyres are shown for the four different friction categories. In the figure Fx_max denotes the maximum brake friction, Fx_locked the brake friction at locked wheel, Fy_max the maximum lateral friction, and Fy_15 the lateral friction at 15 degrees wheel angle. The number of tyres in each group is indicated in the figure.
Comparison Bus tyres and SUV tyres 0,000 0,050 0,100 0,150 0,200 0,250
Fx_max Fx_locked Fy_max Fy_15
F ri c ti o n c o e ff ic ie n
t Bus: unstudded winter (4)
Bus: studded (2) Bus: superstudded (1) Bus: summer (3)
SUV: unstudded winter (10) SUV: studded (7)
SUV: off road (6) SUV: summer (1)
Figure 5: Comparison between bus and SUV tyre ice friction.
From Figure 5 it is clear that for buses, the maximum friction values for the studded tyres (excluding the superstudded) are not significantly higher than for the summer tyres. The higher ice grip values for the studded tyres is mostly an effect of much higher brake and steer stability compared to the unstudded tyres. The measured friction levels for the bus tyres are of the same order as for the tyres tested 10 years ago [3], indicating that the ice grip for bus tyres has not evolved during that time period. A comparison between bus tyres and SUV tyres (for a Volvo XC90) show that the SUV tyres have significantly higher friction values. Even the studded bus tyres in general have much worse ice grip than a typical SUV summer tyre, which is evident also from Figure 6. The difference between bus tyres and ordinary passenger car winter tyres are expected to be even greater.
Comparison bus tyres and SUV tyres
0 50 100 150 200 250 T o ta l ic e g ri p v a lu e
Bus: unstudded winter (4) Bus: studded (2)
Bus: superstudded (1) Bus: summer (3)
SUV: unstudded winter (10) SUV: studded (7)
SUV: off road (6) SUV: summer (1)
Figure 6: Comparison between bus and SUV tyre ice grip values.
The comparison of tyre performance has so far been based on a few discrete points on the tyre friction curves similar to those in Figure 3. The weights used for the total ice grip value calculation was also, admittedly, chosen quite rudimentary. To use more of the information from the friction curves, and especially investigate how the tyres behave at manoeuvres performed at the grip limit, driving simulator studies were performed.
3.2. Driving simulator study
VTI has one of the World’s most advanced driving simulators. The simulator has a moving base that creates realistic forces, and is suitable for handling tests. The study that was performed made it possible to evaluate the effect of putting different tyres on the steering and drive axle, while the driver was being exposed to a common critical situation for bus drivers in Sweden, strong side wind when driving on slippery roads. A recent study points out the threatening combination of wind in combination with vehicle speed and low friction [10]. The driving simulator study and its results are presented in detail in [11]. The results are in agreement with the total ice grip analysis. It was also concluded that for this particular situation, good grip on the steering axle is preferred to good grip on the drive axle.
4. SUMMARY AND RECOMMENDATIONS
Tests in VTI’s tyre test facility on smooth ice did not show any significant difference between summer tyres and non-studded winter tyres, while studded tyres exhibit a better ice grip than non-studded tyres. The difference in these tests is, however, not very large, and in a comparison with a prior study, the ice grip on smooth ice for even the studded bus tyres, is worse than for a typical summer tyre for a passenger car of type Volvo XC90. Nor did driving simulator tests with driving on ice covered road under the influence of heavy wind from the side show a difference between summer tyres and non-studded winter tyres. Also in these tests the studded tyres were superior to the non-studded. If studded tyres are used only on one axle, the driving simulator study showed that in the side wind the ability to steer is important. Studded tyres on the steering axle paired with non-studded tyres on the drive axle performed better than the opposite combination. It is, however, important to note that the combination with studded tyres on the steering axle and non-studded tyres on the drive axle normally could lead to vehicle instability, with a risk for skidding during curve driving. Complementary tests should be carried out before conclusions can be made regarding the safety when using studded tyres on the steering axle only.
Doubling the amount of studs (surpassing the legal limit) had a positive effect on ice grip, both on friction levels and in the driving simulator test.
Accident statistics from winter periods, 2005/2006 and 2006/2007 indicate that buses with summer tyres on the steering axle and winter tyres on the drive axle have the lowest estimated accident risk, which is in accordance with the results in a previous study. The results are however not statistically significant due the low number of accidents. The buses equipped with studded tyres on both axles could not be statistically analysed since only two accidents occurred on bare roadways, and none on icy/snowy roadways, while at the same time the buses in this category drive a lot on icy/snowy roadways. This probably makes these buses the safest on winter roadways.
The buses equipped with studded tyres are the ones that are driven the most on icy/snowy roadways, and those equipped with summer tyres are the ones that are driven the least on icy/snowy roadways.
Three focus groups were carried out, with a) Swedish bus drivers, b) Swedish bus mechanics, and c) Norwegian bus drivers. The importance of the tyres for traffic safety during winter was discussed. It is, however, hard from the gathered discussion material to estimate just how important the tyres really are. It was clear that the time table has a great influence on the creating of stress and the demands on the drivers to keep the speed even when the roadways are slippery. Many bus drivers experience large problems with bad snow clearance, or other winter maintenance. At the same time there is a large
consciousness among the drivers’ that it is always their own way of handling the vehicle that is the determining factor for traffic safety. The drivers were expressing a lack of further education and practical exercises with buses on slippery roads.
Finally, if one compare the results from the different studies that have been used in this project to evaluate the effect of different types of tyres for buses, the conclusion is that while ice grip studies on smooth ice do not show a difference between summer tyres and non-studded tyres, accident data indicate that winter tyres on the drive axle paired with a summer tyre on the steering axle has a positive effect. In contrast to the ice grip study, the accident data study comprises all kinds of roadways, and also driver dependent effects. These results do not warrant a winter tyre regulation for heavy vehicles. The grip studies show that studded tyres are good for the grip on ice, and since the accident data indicate that the use of studded tyres is good also for the traffic safety, we believe that a restriction with respect to the use of studded tyres on buses probably will have negative consequences on the traffic safety.
ACKNOWLEDGEMENTS
Funding from the Swedish Road Administration and the Norwegian Public Roads Administration is gratefully acknowledged
REFERENCES
[1] Björnstig et al. (2008). Passenger car collision fatalities – with special emphasis on collisions with heavy vehicles, Accident Analysis and Prevention 40 (2008) pp 158-156.
[2] Wiklund and Hjort (2006). A survey of bus accidents during winter time. VTI notat 10-2006, the Swedish National Road and Transport Research Institute, Linköping, 2006. (In Swedish)
[3] Öberg et al. (2000). The effects of using heavy vehicle tyres in icy and snowy road conditions, VTI meddelande 884, the Swedish National Road and Transport Research Institute, Linköping, 2000. (In Swedish)
[4] Möller (2001). Calculation model in VädErs, version 2.03. Detailed description with comments. VTI notat 57-2001, the Swedish National Road and Transport Research Institute, Linköping, 2001. (In Swedish) [5] Nordström (1994). The VTI flat bed tyre test facility – A new tool for testing commercial tyre characteristics. Reprint from SAE Technical paper series, SP 1003 – The influence of tire, axle and brake characteristics on truck braking and steering performance, paper 93306, pp. 13–23 (International truck and bus meeting and exposition, Detroit, Michigan, November 1–4, 1993). VTI reprint nr 220, the Swedish National Road and Transport Research Institute, Linköping.
[6] Nordström (2004). Friction on ice for new and used winter tyres. Summary report. An investigation concerning the influence of age, tread depth, tread rubber hardness, stud protrusion and stud force. , VTI meddelande 996, the Swedish National Road and Transport Research Institute, Linköping, 2004. (In Swedish)
[7] Hjort (2005). SUV tyre’s grip on ice, VTI notat 58-2005, the Swedish National Road and Transport Research Institute, Linköping, 2006. (In Swedish)
[8] Craelius and Nokia Tyres Ltd. (1989). Safe winter driving: Grip as for winter, driving properites as for summer. SAE paper 890006. SECC Subzero Engineering Conditions Conference Proceedings P220 Rovaniemi Finland 9–11 January 1989, pp. 61–66.
[9] Hjort and Andersson. (2009). The importance of tyre grip for the function of ESC systems on icy roads. VTI rapport 662, the Swedish National Road and Transport Research Institute, Linköping, 2009. (In Swedish) [10] Petzäll et al.(2005). Wind Forces and Aerodynamics, Contributing Factors to Compromise Bus and Coach Safety? International Journal of Crashworthiness 2005;10(5), pp. 435-444.
[11] Hjort and Jansson (2009). Handling of Busses on Slippery Roads During the Influence of Side wind – a Study of the Effects of Different Tyres, Accident Analysis and Prevention, in press.
[12] Hjort et al. (2008) Traffic safety of buses at winter road conditions. VTI rapport 618, the Swedish National Road and Transport Research Institute, Linköping, 2008. (In Swedish)