V¨
aster˚
as, Sweden
Thesis for the Degree of Master of Science in Engineering - Robotics
30.0 credits
MULTI-DRONE CONTROL SYSTEM
David Songmahadthai
dsi12002@student.mdh.se
Simon Norlin
snn12009@student.mdh.se
Examiner: Baran C¨
ur¨
ukl¨
u
M¨
alardalen University, V¨
aster˚
as, Sweden
Supervisor: Fredrik Ekstrand
M¨
alardalen University, V¨
aster˚
as, Sweden
Company supervisor: Julius Elof Winroth,
Nordluft automation AB, Stockholm, Sweden
Abstract
Planning and controlling traffic for multiple drones in a system without intercommunication between the drones is a daunting proposition. This paper presents a thesis work developing a multi-drone control system capable of planning and executing missions in a 3-D aerial space. Generic 2-D path planning algorithms are extended into the 3-D space to handle multiple parts of the path planning, creating highways through a gridded area which is used as obstacles for other drones.
Three path planning algorithm are compared with other each other wavefront, Astar and po-tential fields, scheduling is also documented to find the optimal drone amount that the system can handle given an area of interest, this is done to see how often and for how long drones stand idle. Simulations and equations have been implemented to verify and compare results.
Table of Contents
1 Introduction 3
2 Background 4
2.1 Robotic Operating System . . . 4
2.2 Overview . . . 4
2.3 Coverage Path Planning . . . 4
2.3.1 Cellular Decomposition . . . 5
2.3.2 Grid based cellular decomposition . . . 5
2.4 Wavefront algorithm for grid-based path planning . . . 5
2.5 Astar . . . 6
2.6 Potential Fields . . . 6
2.7 Centralized and Decentralized systems . . . 6
2.8 Landing and Take-Off Cycle . . . 6
3 Problem Formulation 8 3.1 Traffic . . . 8
3.2 Landing and Takeoff Cycle . . . 8
3.3 Optimizing the system . . . 8
4 Method 9 4.1 Wavefront in 3D grid . . . 9 4.1.1 Goal-cell assignment . . . 9 4.1.2 Path Planning . . . 10 4.1.3 CPP . . . 10 4.2 Astar . . . 11
4.3 Artificial potential fields . . . 12
4.4 Live battery checking . . . 12
4.5 Landing Take-Off Cycle . . . 12
4.6 Verification . . . 12 5 Results 16 5.1 Path Results . . . 16 5.2 Path Efficiency . . . 16 5.2.1 Wavefront . . . 16 5.2.2 Astar . . . 16
5.2.3 Artificial potential fields . . . 16
5.3 Idle time . . . 17 5.4 Work Allocation . . . 18 6 Discussion 23 6.1 Path Planning . . . 23 6.2 Path Efficiency . . . 23 6.2.1 Wavefront . . . 23 6.2.2 Astar . . . 23
6.2.3 Artificial Potential fields . . . 23
6.3 Idle Time . . . 23
6.4 Work Allocation . . . 24
6.5 Efficiency future work . . . 24
7 Conclusion 25
8 Future work 26
9 Acknowledgement 27
1
Introduction
Drones are becoming more widely used in order to optimize and solve issues previously done with heavy machinery, such as transporting goods or tasks involving coverage of large areas[1][2]. Navigation in robotics has been heavily researched for a long time, a newer and rarer field is to autonomously navigate in 3D space with multiple unites[3][4].
The purpose of this thesis is to present a path planning(PP) method and evaluate it in different scenarios. Several drones are tasked to completely cover and survey a large area in a regular and timely manner, with constraints on the system such as flight time and avoidance of other known units in the field. They navigate from a refill station where a payload is attached and where its battery gets changed, then they travel towards a work area where they will execute PP and finally returns to the refill station. The methods explored to solve the PP problem is a generic grid based wavefront[5] implemented in 3D space, Astar algorithm, artificial potential fields as well some CPP algorithms[6] to cover smaller simple spaces. The system is centralized meaning that all communication and most decision making go through a main coordinator, much like an air traffic control tower.
A major concern with controlling several unmanned aerial vehicles(UAVs) that are unable to make decisions, is minimizing the risk of collisions between the them, both at the refill stations and while they are traveling to the work area. The system also has to maximize the reliability in unforeseen scenarios such as communication loss or unexpected low battery levels.
After the system has been confirmed to work reliably with no collisions occurring, there is an evaluation of the systems optimization zones, which will be to find(shows) the optimal amount of drones and refill stations relative to battery time and size of area to survey.
The paper contain the following sections, section 1 contains the background to the methods and algorithms that are used in the solutions. Section 2 identifying the difficulties and problems with developing a control system for drones. Section 3 explains the methods and the algorithms as well as how they are used. Section 4 presents the the data and results from simulating the system. Section 5 summarizes and draws a conclusion from the work as well as discusses future work that can be explored.
2
Background
This section will go through concepts needed to understand the solutions later in the paper.
2.1
Robotic Operating System
ROS is the development framework used in this thesis.
”The Robot Operating System (ROS) is a flexible framework for writing robot software. It is a collection of tools, libraries, and conventions that aim to simplify the task of creating complex and robust robot behavior across a wide variety of robotic platforms.” [7]
The core parts of ROS is its communication, robotics-specific features and its tools. This thesis has utilized mostly the communication to increase encapsulation and easy to read code.
• Nodes: ROS has a high focus on being modular so processes that preform different functions are divided into Nodes. A system often contains many nodes, one might handle the camera input, while another computes path planning for the best route depending and that input. • Master: The ROS master is a node that provides the name registration of nodes in the
system. Making sure that nodes can find each other when they need to communicate. • Messages: The communication between nodes is done by passing messages. The message it
self is a data structure that can contain standard primitive types(int, char, etc.).
• Topics: For the nodes to send messages they publish that message on a topic. If there is a node that is interested in a message, that node has to subscribe to that topic where the message was published. A node can publish and subscribe to multiple topics and there can be multiple nodes subscribed/publishing to one topic. The messages passed over the topics are completely anonymous, the nodes are not aware of any other node then it self. This makes the system robust with that if one node where to crash, the system as a whole would go on.
• Services: Services are a synchronous way for nodes to communicate. With one node request-ing somethrequest-ing from a service and a another node handles that request and sends a response back over the service.
• Bags: Is a format for storing messages sent over topics, can later be replayed and is mostly used for debugging purposes.
2.2
Overview
In this thesis a multi-drone system with a centralized coordinator will work to cover an area. The system is developed and verified through simulation.
One of the tasks the drones have is to systematically cover a large area in its entirety and to deliver a payload to its destination. This will create a situation where the drones go back and forth over the area to refill the load and change battery. The traffic of drones is handled in a way so that they do not risk collision when flying in close proximity to each other.
The drones do not have any intercommunication due to the limitations of the drones on-board equipment. They only communicate with the central coordinator by transmitting GPS, battery and altitude data, they also receive orders from the coordinator.
2.3
Coverage Path Planning
One aspect of many robotic applications is that of path planning. Path planning can be about finding the shortest or most efficient route from point A to point B around obstacles or it could be Coverage Path Planning(CPP). CPP is where the robot not only navigates through an area but also makes sure it covers all points of interest. This is maybe most commonly seen in lawn mower or vacuum cleaning robots, where it is important to cover the whole area. There are a few CPP algorithms developed over the years, Galceran and Carreras[6] presents the most common ones.
2.3.1 Cellular Decomposition
A way to do path planning is to divide an area into sub areas called cells. The cells are obstacle free and non-overlapping areas that are easy to cover for example with zigzag motion known as the seed spreader, figure1, documented by Lumelsky [8], Choset and Pignon [9].
Figure 1: Seed spreader coverage motion over a grid of cells, gray represent covered cells. Latombe [10] presents the Trapezoidal Decomposition which is later improved upon by Choset and Pignon [9] when they present the Boustrophedon Decomposition.
2.3.2 Grid based cellular decomposition
Moravec and Elfes[11] were the first to introduce grid cells and Lumelsky[8] used it to implement a CPP. Grid based cellular decomposition is where all the cells are uniform over the entire area. One cell may be empty, contain an obstacle or part of a obstacle, therefor the resolution of the grid can determine the coverage accuracy of the path planning [6]. The cells of the grid can be the size of the coverage radius of the robot that moves through them, that way the robot can always be sure that it can pass a clear cell. But this can also result in the robot missing parts due to if an obstacle is within a small part of the cell.
2.4
Wavefront algorithm for grid-based path planning
In a grid where a robot is to move to a specific cell (goal cell) a general wavefront algorithm calculates a distance each cell is for the goal cell that the wave expands form, figure2.
From this distance transform a robot can then find a path from the start cell to the goal cell, there are likely multiple paths that the wavefront can find and so by going to the neighboring cells with lowest numbers the distance needed for travel is the lowest found by the algorithm. The wavefront also take in consideration for obstacles that can be in the grid, and so finding ways around them. These obstacles is static and marked in the grid as shown in figure2.
2.5
Astar
Astar is a widely used path planning algorithm it is used in robotics, games and database handling[12]. It is a fairly fast algorithm which is the main appeal of using Astar. One method of using is with the euclidean distances to know weather a path is better or not. This is done with the use of nodes, these nodes are different destinations that the path planner can consider, the nodes save two values, one is the euclidean distance to the goal, and the other is the distance from the node it came from as well as when node it was. When it has reached a new node it then compares the combined euclidean distance and previous node it came from to see if the new node is further or closer to the goal. It visits all the neighboring nodes until it finds the shortest path. Then it goes backwards and gets all the nodes for the shortest path.
2.6
Potential Fields
The core concept of a potential fields in path planning is its action vectors [13] which show the desired direction and distance to a target point. These vector could be a representation of attraction or repellent from different sources3, in path planning there is one point of attraction that a robot desires to go to. The path the robot will take depends on obstacles, which will create fields of repulsion pushing the unit away from specific zones. For obstacles/repulsion zones there is a point where the field becomes infinite, in path planning this is to make sure that the robot dose not enter/collide with zones it should not.
Figure 3: potential field pushing from an obstacle
2.7
Centralized and Decentralized systems
Decentralized SWARM is when there is no central coordinator, an example of such an approach is in the work of Jager and Markus [1], they were tasked to clean and cover an area. The tasks were assigned dynamically from an algorithm where several factors were considered, such as where neighboring robots are located as well as how close they are to an area which has not been cleaned yet. This method is suitable to use when the robot has computational power to spare. The drones in this thesis has minimal computational power.
In the paper Wan and his colleges did. [14]. They have a centralized approach where three robot arms cooperate in a task where all the instructions are redirected through a central coordinator in a star topology.
2.8
Landing and Take-Off Cycle
The landing and take-off will be an issue which has to be handled safely and effectively. This is because the amount of refill stations will always be less than the amount of drones in the system, this will create a bottle neck at the refill station if several drones arrive at the same time frame.
This topic has been well documented for airplanes and airports and is referred to as the Aircraft Landing Problem (ALP), where there is a bottleneck when multiple airplanes are landing at an airport with fewer landing strips than planes. Today most of the airport traffic is handled by people, however Ben[15] and Wens’[16] scheduling algorithms has shown promise. The drone application
will not be the same as the ALP, however for this project a landing and take-off cycle(LTO) will assist with scheduling the incoming and outgoing drones.
3
Problem Formulation
This section have descriptions of the kind of problems that need to be handled.
3.1
Traffic
A centralized system with a coordinator responsible for the planning introduces problems such as communication issues. What happens if the drones lose connection to the coordinator while on a mission or if the drones go off course, how can the system maximize a drones safety from the other units in the field? The problem becomes more of an issue with the introduction of more units in the system.
3.2
Landing and Takeoff Cycle
Drone traffic safety is the major concern when it comes to LTO due to the fact that drones are most likely to come in close proximity to each other when attempting to land and take-off, making it the most critical area for collision and bottleneck issues. Scheduling the LTO is a major part and needs to consider worst case scenarios such as, when more drones wants to land than there are landing zones. This could create a queue where a drone has to hover in a safe position until a zone is clear as shown in figure4.
Figure 4: Work area and refill station, traffic to and from the grid and refill station. The green drone is returning to its safe zone, while the red drone waits in its safe zone until the yellow drone leaves the refill station.
3.3
Optimizing the system
A challenge will be to find optimal number of drones and refill stations relative to how large the area is and the type of drone in the system. If there is constantly a queue to the refill station the flight time of the drone might be to short or there might have to be two refill stations to accommodate the amount of drones present in the system.
4
Method
This section explain the 3D wavefront together with the path planner as well as how the centralized system is structured and the solution to the landing bottle neck problem. Because navigation in 3D is difficult, a simple 2D-Wavefront path finding solution has been extended to work in a 3D-grid based map.
The control system implements a star topology network as shown in figure 10. The drones periodically update the central coordinator on its status and location, so the coordinator can take note of unexpected events such as extensive battery drainage or communication loss.
4.1
Wavefront in 3D grid
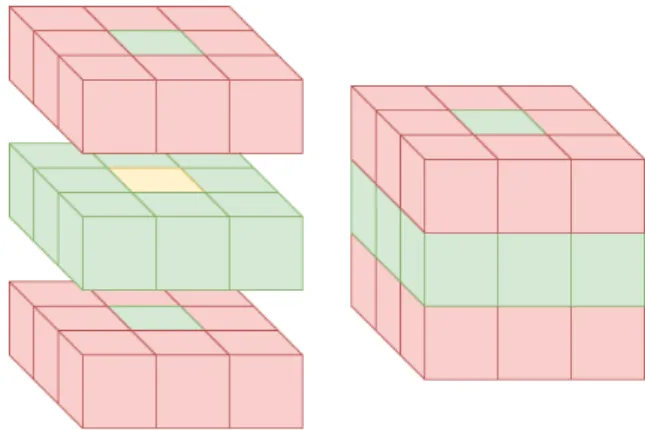
Performing the wavefront in a 3D grid is done by having the wave expand in a spherical motion from the goal cell. That would give the expansion cell a potential of 26 bordering cells for the wave to expand to. In this implementation the wavefront does not consider all the 26 cells around for expansion only the ones ones the same plane and the one directly above and the only directly below the expansion cell, figure5. This is so the path planner prioritize a movement on the current plane instead of changing altitude.
Figure 5: The yellow cell is the expansion cell and where the green cells are of interest for wave expansion. The red cells are not considered for expansion.
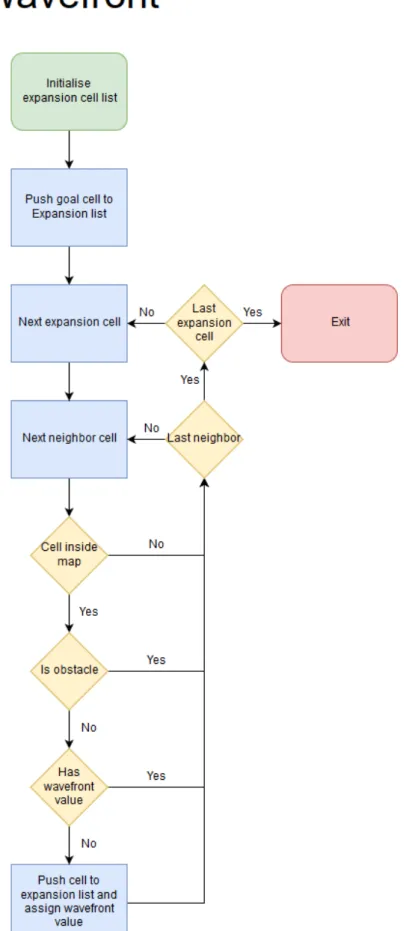
As shown in figure 12the first step in the algorithm is to check if the neighbor cell is within the current map or if it has a obstacle value if ether is true then the cell is ignored because if it is outside the map then it is forbidden for the drone to fly there. If it has a obstacle value then is not safe to fly there due to another drones flight path is going through that cell. If the cell is within the map and is not a obstacle the cell is assigned a value depending on the distance for the wave origin and added to the expansion list. The expansion list is instantiated with the goal cell where the wave starts from. All the steps are repeated until the cells in the expansion list has no valid neighbors.
4.1.1 Goal-cell assignment
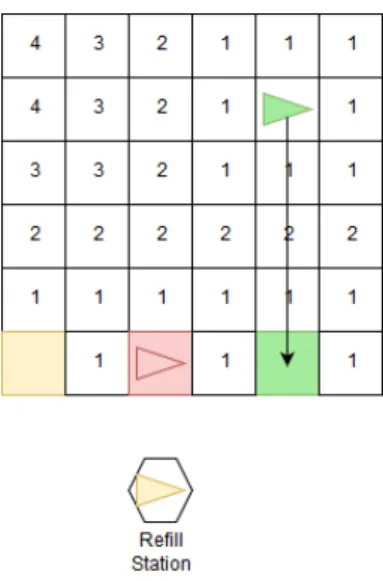
The work area for drones that have completed their previous task is assigned by process of elimi-nation from criteria to find the safest area to work in. The first criteria is the distance from other drones, the distance is found out by imposing a wavefront algorithm on a top layer grid as shown in figure6. The cells with higher value are seen as safer areas to work in because of the distance from other drones. The second criteria is the remaining charge left on the battery. If there is a low charge on the battery the drone are not assigned a cell far away from the refill station as seen in figure7.
Figure 6: The cells with a higher number are seen as a more attractive area to work in.
Figure 7: The values indicates how attractive an area is to work in depending on distance from the safe zone. darker colored cells are for drones with higher battery charge left.
4.1.2 Path Planning
Given a wavefront map for the goal cell and the start position for the drone the path planning algorithm,11, begins with checking all the start positions neighboring cells. The neighboring cells of interest is shown in figure8. The first step when checking a cell for possible movement is to see if that cell is the goal cell, if it is not the goal cell then the algorithm checks if it is an obstacle. Then if it is nether the goal nor an obstacle then it checks the wavefront value and compares it with the rest of the possible neighbors and picks the one with the lowest value, that will be the expansion cell for the next iteration.
4.1.3 CPP
At the goal cell the drone drops down to the work level altitude and executes a zigzag coverage motion of the full sub area,9. The work level altitude is below traffic altitudes, the area is a square zone of appropriate size for the work to be executed there.
Figure 8: The yellow cell is the expansion cell and where the green cells are of interest for possible movement. The red cells are not checked, this is to stop the drones from moving in certain ways.
Figure 9: Traffic over the grid. The box is the work grid, with the red drone getting a path first to its work cell represented by the red pillars. The green drone then has to calculate a path around the red drones path. The path the green takes is an example of an available route to its work cell.
4.2
Astar
Astar as a path planner is designed a bit different from how the implemented wavefront algorithm functions. The way Astar is implemented is that the 3D grid is only used to know the positions of the obstacles as well as giving the Astar nodes a value to know the position so the distance can be calculated.
The path the drone would take is imposed on to the 3D grid and became obstacles. This method makes it so that the drones are able to turn at any angle to change direction. The way this was achieved was by first deciding what the Astar nodes were. In our case we had two instances where nodes were created for a drones path.
1. The first path the path planner makes is a straight path from where the drone is to where its goal is. If this path intersects with another drones path six nodes are created, two nodes for X, Y and Z on each side of where the paths intersect. IMAGE
2. Whenever another working drones makes a turn in its path, a node is created at that turns corner. (maybe insert picture)
After all the nodes were created the start, end and all of the nodes became neighbour nodes with each other. After that the neighbour nodes paths that intersected with obstacles had their neighbour connection removed.
A generic Astar algorithm was then used to find the shortest path from start to goal.(kanske lgg dit mer info)
The last step is to make the path into obstacles in the 3D grid map, this was done by making every nearby cell the path passed trough into an obstacle.
4.3
Artificial potential fields
The implemented Artificial potential fields is to see if soft turns would be more efficient compared to sharp turns. The implement potential fields emits a pushing force whenever the path planner comes close to an obstacle. An exponentially decreasing function was used for the pushing force1.
e(−x) (1)
The first step is to make the path planner move towards the goal at a linear speed, whenever it is within the the pushing boundaries, which in our case was 10 meters of the obstacles, it started pushing softly and gradually it pushes harder as it approaches because of the use of an exponentially decreasing function, until it passes by the obstacles and reaches the goal.?? Each cell was used as an obstacle emitted a pushing force. when it has found its path, just like in Astar all of the cells the path intersected became obstacles for other drones.
4.4
Live battery checking
To ensure that the drone does not crash due to unusual battery drainage a check on the current level needs to be done periodically and compared to the average battery drainage. The first step is to approximate the expected drainage for the distance of one way point, both for a diagonal and straight movement in the grid, this can be an initial random value, it does not matter because the value will be updated through out the runtime of the system. The entire journeys expected drainage is calculated to be used for the live checking. When the drone has traveled from one way point to the next it first looks if it is a diagonal or straight movement from the manometer and then it checks how much of the battery was drained. It compares this value with the approximated value and checks whether it has enough battery to complete the remaining journey. If it did drain more than expected the initial battery drainage approximation is updated, and the extra battery drainage is also expected to be the same on the return journey, it does this for every way point towards the work area, if the value comes close to the point of no return then the drone is instructed to abandon the given task and return to the refill station.
4.5
Landing Take-Off Cycle
LTO is a critical area of interest because of high traffic and limited space, how this is handled in this thesis is by having a separate program called marshaler. The marshaler exclusively handles the queue. If the refill station is occupied, then the drone is placed in a queue, each drone is designated an exclusive safe zones to be used whenever it returns from a mission or is required to idly wait in the queue.
The first thing a drone will do when it returns from a mission will be to ask the marshaler if the refill station is available, the steps are shown in figure10. The marshaler will then check in its queue to see if another drone is occupying the refill station and answer with a yes or no. If the drone control receives a no it will land the drone in its designated safe zone, if the refill station is unoccupied it may fly and attempt to land there. When the drone is done at the refill station it will then return to its safe zone and receive a new mission, the drone control will confirm this with the marshaler and request the next drones to be sent to the refill station.
4.6
Verification
A software in the loop(SITL) simulation program is used to verify the majority of the algorithms applied.
Dronekits[17] SITL is used to simulate the drones dynamics, mavlink is also used to handle the communication between the drone, the control system and the ground control station(GCS), however, the GCS is only used to observe the drone in real time.
Figure 10: Algorithm flow and connection
Data from the Simulated drones GPS will be used to verify how closely the drones follow their given paths. The X, Y and Z coordinates generated are to be compared with the GPS results to compare the path given with the path taken.
Several drones are also simulated simultaneously to ensure that some drones cross paths, those drones paths are then displayed to verify that the drones travel at different altitudes when crossing paths.
The drones idle time are logged and are compared. they are compared in tree map sizes, 250 000 m2, 1 000 000 m2and 2 250 000 m2 with tree, six, nine and twelve drones in every map size.
this is then displayed in a graph and table.
The work allocation algorithm which uses wavefront is verified by observing if the work is distributed equally over the map.
5
Results
The following section will present the results. The accuracy of the path is evaluated as well as the idle time of drones in different groups sizes and varying map sizes. The allocation of work will also be observed in order to verify that the drones rarely work in close proximity of each other.
5.1
Path Results
The figure 13 shows one drone completing four different missions with the wavefront algorithm, one after the another, all having slightly different goals. The figure also show that the simulated drones consistently follow the given path with no diversion in its course. In the same figure the CPP is implemented when the drone arrives at the work location and it can be seen that it also follows the path correctly.
In figure 15 and16 there are two different drones working simultaneously. At first the black drone is given a task and is out on that mission, shortly after the red drone is given a task and in the 3D figure 15it is seen that the red drone path is elevates to a higher level in order to avoid traversing in the black drones path, this is the same for all the drones.
To ensure that the path given from the path planner is reflected in the simulated results, both of them are plotted and compared. As seen in figure18they are similar, only differing in length proportion because of the difference in data types, one being GPS and altitude data and the other being regular X, Y and Z coordinates.
5.2
Path Efficiency
In this section the results for the three different path planning algorithms are presented. 5.2.1 Wavefront
The paths taken are not 100% efficient, with the drones at most being able to take 90 or 45 degrees turns, therefore a comparison of distance is made between the path planners path and a straight line. As shown in figure 21 a 5x5 grid system the blue arrow shows the most inefficient path possible in a square grid based map, while the green arrow is the most efficient with it taking a straight line from A to B. With triangulation we know that the blue arrows path is 8% longer in distance than the green path, however this type of path is only taken a few times per map. The inefficiency for the rest of the paths will also gradually decrees when moving towards the most top, bottom or diagonal square, this can be seen in figure23. If we do this math with the intent of traversing the entire map we get the following results as shown in figure 22. We can see that the graph looks similar to a logarithmic functions with hardly any difference in efficiency in the beginning because of the small map size, however as the size increases so does the extra distance taken, however it peaks at 5% no matter how large we make the map size, as long as it is a square based map.
5.2.2 Astar
When Astar does not have any obstacles obscuring its path it always takes the most efficient path possible, however when it does encounter obstacles the results can be seen in figure19. The first test was conducted by first making one drone do a task by having a predesignated route with two turns to make it so that the second drone would have two corners to create for nodes. The seconds drone goal was also placed so that it intersected with the first drones path making it so that six additional nodes would be created. this can be more clearly seen in the forth image. The second test was merely to demonstrate that there are no issues even when a more complex obstacle path is introduced.
5.2.3 Artificial potential fields
The results for artificial potential fields can be seen in figure20, this test was conducted with three drones, first the black drone was given a task which created a straight path from start to goal.
Figure 13: GPS data of one simulated drones paths over four missions
Afterwards the red drone was given a task while the black drone was still doing its mission, to avid the black drones path the red drone elevate to a higher altitude. Lastly the blue drone was given a task while both the black and red are still on their mission, this makes the blue drone descend to avoid both the red and black drones path.
5.3
Idle time
The idle time were recorded in order to find a correlation between map size and the number of drones in the system.
Figure 14: The CPP is implemented at the work location
Figure 15: Red drone avoiding the black drones path by elevating to higher level
As seen in the first graph in figure24the average idle time increases with the addition of more drones, however, there comes a point when the average idle time converges and stay the same.
The table1 shows that average idle time decreases when the map size enlarges, as expected.
5.4
Work Allocation
The work allocation is designed to be safe, which is reflected in the results as shown in figure17. The figure also shows a pattern that confirms that the work areas chosen are always far away from each other.
Figure 16: An image from a Ground control program to display the simulated movement in real time.
Figure 17: An image of the path planner, displaying that only four out of twelve drones are able to work at the same time in a map size of 250 000 m2 at a set speed of 10 m/s.
average idle time for one drone
250 000 m2 1 000 000 m2 2 250 000 m2
three drones 77 sec 77 sec 27 sec
six drones 417 sec 177 sec 223 sec
nine drones 1005 sec 651 sec 528 sec
twelve drones 1540 sec 1215 sec 991 sec
Figure 18: The figure with the blue line represent the path from a simple x, y and z coordinate, while the red represent the GPS data from the simulations.
Figure 19: The first two images show a simpler obstacle that a drone needs to navigate. the black lines represents the all path the second drone is able to take, while the red line represents the shortest possible path. The blue line represent the first drones path which is an obstacle for the second drone The first image excludes all the paths that goes trough the blue line, while the second includes all the paths created from the corners. The third image showed a more complicated obstacle path.
Figure 20: The black drone is introduced first, then the red and lastly the blue drone.
Figure 21: The blue line represents our path planners path, the green one is the optimal path which goes straight from A to B.
Figure 22: The X-Axis represents the map size while the Y-Axis represents the percentage increase in distance.
Figure 23: The figure represents the difference in distance when traveling in a straight path com-pared to our path.
Figure 24: An image of the average drone time spent while waiting for the refill station to become available.
6
Discussion
6.1
Path Planning
The path planning has been proven to be functional and manages to control the traffic so that the drones do not occupy the same space. However, while the paths do not cross they are likely not the most effective routes that can be taken, as the path planner chooses a location that will need a route to go around another drone’s path. Here it would be better if the planner could chose a different location for the drone to go to so there is no need to cross paths with other drones if possible and so further increases safety.
6.2
Path Efficiency
In this section the discussion for the three different path planning algorithms are presented. 6.2.1 Wavefront
As we could see in the results there is a slight difference if distance when taking our path planner’s route compared to the most efficient one, however it is not a significant difference when considering the benefits with having a grid-based path, such as safety and the modularity of the system. However these results only take one drone and one altitude into account, when introducing more drones to the system they will sometimes change altitude to avoid each others paths. Distance is also necessarily not equivalent to battery usage, in our path we sometimes change direction, this means that the drones will decelerate and accelerate, this will require more energy than simply going in a straight path.
6.2.2 Astar
The result from Astar is the most promising, it is both effective with finding the the shortest path as well as being able to handle more complex paths. However while it is effective it can become computationally heavy if several drones as well as complex paths are present when a new drone is given a new mission. This is because every node new node the path planner needs to consider exponentially increases the computational power needed because all nodes are connected to each other at the start, they all also need to be checked if they are acceptable paths to use or if they intersect with other drones paths. This might not be an issue because of the path planning being done before the drone is sent of to a mission, however it is something to consider.
6.2.3 Artificial Potential fields
The artificial potential fields also show promise, however it has several flaws that makes it unsuit-able for this application. The first issue is that it is easy to get stuck on local minimums when it attempts to avoid obstacles as well as find a short path, this is because the paths only repel if a the path planner gets to close to the obstacle, so in the worst case scenario the path planner could make a horribly inefficient path for itself because of it not knowing that there were several more obstacles in its first diversion, this could maybe have been avoided if it choose another direction when first avoiding an obstacle even if it might have seemed to be the wrong choice at the start. This might not be a problem if some foresight could be done or several iterations of the path plan-ner were to be made for one drone to make sure that the most efficient path were taken, however it would be better to just use another path planner where this issue is better dealt with.
Secondly it is a bit to unstable when there are several drone simultaneously on the same map. There seems to be to many forces pushing one the path planner to make it reliably find a good path.
6.3
Idle Time
When looking at the results from the drones idle time, it can clearly be seen that increasing the map size can ease the load on a single refill station, however there is always some idle time when there is a moderate amount of drones and only one refill station. Even if the map size can be
enlarged there is a limitations to the drones battery capacity. A better alternative than simply enlarging the map size would be to increase the number of refill stations. As shown in figure17
the maximum number of drones working at the same time are four, this could be doubled if one more refill station would be added. This is also shown in table1, the only reason there is any idle time at three drones is because of the drones starting at the same time and the first task is to go to the refill station.
To find the most optimal number of drones in a system would be to first, test how far the battery allows the drone to travel and to set the map size as the furthest away work area. Then add drones until there is always one drone idly waiting. Then to double the drones, simply by adding one more refill station
6.4
Work Allocation
The work allocation is very simple and limited. It does achieve the desired goal of separating the work areas of the drones. However, it does not take into account efficiency, this introduces scheduling problems. There is a higher chance of two drones returning to the refill station because of the timing of when the drones start working and for how long they work. It might even be redundantly safe. Because of the precision of a drone a safety margin of 30 m is enough. Currently the drones always choose a isolated work area, they are mostly over 100 m apart, this could be considered unnecessary.
6.5
Efficiency future work
The focus of the methods proposed have been on simplicity and safety, so the system as a whole might be ineffective. Instead having the drones move back and forth, an alternative would be to have two refill station on opposite sides, this way the map size could be doubled because of not needing to return back when working at the furthest work area, the energy consumption would be halved. The path towards the goal would also be removed and replaced with a new path when the drone has arrived at the destination. However, this would make the problem more complex. Such as which refill station should a drone choose to return to. This could also introduce a starvation problem where one refill station in never used. It would also require more preparation because now there are two refill station on two different locations.
7
Conclusion
This paper has presented a centralized multi-drone control system that uses generic wavefront algorithms for path planning in a semi-static environment. The path planning was done in a 3D grid of uniform cells, when one drone has got a path through the grid the cells that the drones uses for its path becomes unavailable for other units in the system to use until the drone is back to its safe zone and the cells are unblocked. This creates personal ways/tunnels through the grid that only that one drone is allowed to fly in during its mission.
Simulation shows that the system is functional and that depending on the size of the map the system can handle different number of drones. With only one refill station it is easy to see the correlation between the idle time, refill time and average mission time.
8
Future work
As brought up in the conclusion one major part is increasing the optimization of the system, it is not only to increase the number of refill stations but also to find the optimal location to place the stations depending on a given area so that drones can have easy access to them.
Another part would be to find a way to plan the UAVs path so that they time the arrival to the refill stations so that there is a minimal idle time waiting for the station to be available.
Work allocation with battery consideration, find a zone for the drones depending on the status of the battery level.
9
Acknowledgement
We would like to thank m¨alardalens university for this thesis.
We would also like to Nordluft for the opportunity to develop a drone control system.
Fredrik Ekstrand has been an amazing supervisor, giving us advice whenever we got stuck or needed additional guidance.
References
[1] M. Jager and B. Nebel, “Dynamic decentralized area partitioning for cooperating cleaning robots,” in Robotics and Automation, 2002. Proceedings. ICRA’02. IEEE International Con-ference on, vol. 4. IEEE, 2002, pp. 3577–3582.
[2] M. R. Brust and B. M. Strimbu, “A networked swarm model for uav deployment in the as-sessment of forest environments,” in 2015 IEEE Tenth International Conference on Intelligent Sensors, Sensor Networks and Information Processing (ISSNIP), April 2015, pp. 1–6. [3] A. R. Vetrella and G. Fasano, “Cooperative uav navigation under nominal gps coverage and
in gps-challenging environments,” in 2016 IEEE 2nd International Forum on Research and Technologies for Society and Industry Leveraging a better tomorrow (RTSI), Sept 2016, pp. 1–5.
[4] S. Waharte, N. Trigoni, and S. Julier, “Coordinated search with a swarm of uavs,” in 2009 6th IEEE Annual Communications Society Conference on Sensor, Mesh and Ad Hoc Com-munications and Networks Workshops, June 2009, pp. 1–3.
[5] A. Zelinsky, R. A. Jarvis, J. Byrne, and S. Yuta, “Planning paths of complete coverage of an unstructured environment by a mobile robot,” in Proceedings of international conference on advanced robotics, vol. 13, 1993, pp. 533–538.
[6] E. Galceran and M. Carreras, “A survey on coverage path planning for robotics,” Robotics and Autonomous systems, vol. 61, no. 12, pp. 1258–1276, 2013.
[7] “Robotic operating system,”http://www.ros.org/, accessed: 2019-01-15.
[8] V. J. Lumelsky, S. Mukhopadhyay, and K. Sun, “Dynamic path planning in sensor-based terrain acquisition,” IEEE Transactions on Robotics and Automation, vol. 6, no. 4, pp. 462– 472, 1990.
[9] H. Choset and P. Pignon, “Coverage path planning: The boustrophedon cellular decomposi-tion,” in Field and service robotics. Springer, 1998, pp. 203–209.
[10] J. Barraquand and J.-C. Latombe, “Robot motion planning: A distributed representation approach,” The International Journal of Robotics Research, vol. 10, no. 6, pp. 628–649, 1991. [11] H. Moravec and A. Elfes, “High resolution maps from wide angle sonar,” in Robotics and Automation. Proceedings. 1985 IEEE International Conference on, vol. 2. IEEE, 1985, pp. 116–121.
[12] P. Yap, N. Burch, R. C. Holte, and J. Schaeffer, “Block a*: Database-driven search with applications in any-angle path-planning.” in AAAI, 2011.
[13] M. A. Goodrich, “Potential fields tutorial,” Class Notes, vol. 157, 2002.
[14] J. Wan, Y. Wang, Q. Qin, and Y. Li, “Multi-robots’ communication system based on zig-bee network,” in Electronic Measurement & Instruments, 2009. ICEMI’09. 9th International Conference on. IEEE, 2009, pp. 3–14.
[15] M. B. Messaoud, K. Ghedira, and R. Harizi, “The multiple runway aircraft landing problem: A case study for tunis carthage airport.”
[16] M. Wen, “Algorithms of scheduling aircraft landing problem,” Master’s thesis, Technical Uni-versity of Denmark, DTU, DK-2800 Kgs. Lyngby, Denmark, 2005.