Non-Exhaust PM
10
and
Road Dust
JOACIM LUNDBERG
Licentiate Thesis, 2018
KTH Royal Institute of Technology
School of Architecture and the Built Environment Department of Civil and Architectural Engineering Division of Building Materials
TRITA-ABE-DLT-1802003 ISBN 978-91-7729-689-8
© Joacim Lundberg, 2018
Akademisk avhandling som med tillstånd av KTH i Stockholm framlägges till offentlig granskning för avläggande av teknisk licentiatexamen torsdagen den 1 mars, kl. 10:00 i sal F3, KTH, Lindstedtsvägen 26, Stockholm. Avhandlingen försvaras på engelska.
i
Preface
The idea behind this thesis is to provide an overview of the wide research area that is non-exhaust PM10 emissions and road dust, as well as the relation to asphalt surfacings and their properties. This work has been limited to mainly Swedish or Nordic conditions. Another idea with this thesis is to start thinking in holistic terms regarding urban environment and the need of looking at several aspects at once, rather than separately, which is done by the cooperation between myself and my fellow PhD student Tiago Vieira who works with road surface and tyre interaction with focus on noise emissions and rolling resistance.This thesis is constructed in such way that the reader first gets an introduction to the problems related to PM10 pollution, followed by some useful definitions in the area. The reader then gets an introduction to the road surface and tyre interaction, specifically how a tyre is constructed, how studded tyres interact with the pavement surface, followed by a description of properties of the asphalt surfacing relevant to particle emissions mainly related to abrasion wear and road surface macro texture. This is followed up with some methods used for determination of these properties and their effect on e.g. non-exhaust PM10 emissions. This is further followed up by giving a description on an election of equipment’s allowing for measurement of PM and road dust. Also introduced is how abrasion wear, and in continuation non-exhaust PM emissions can be modelled. Since build-up of road dust and the following emissions to the air is problematic two chapters are dedicated to road operations having an impact on these processes together with some options used to reduce the influence. The last chapter prior to the concluding remarks and future research required and planned is about the combined issue of particle emissions and road noise emissions. Finally, as stated, the final chapter deals with the concluding remarks of this thesis, namely identified knowledge gaps as well as which direction the continuation of this thesis work will take. Appended to this thesis is also two conference papers. The
ii
first which presents a deepened description of one of the models described in the thesis, together with the implications for the emission model. The second paper is instead a trial performed regarding how the road surface macro texture influence the ability to retain a maximum theoretical road dust load when exposed to rolling tyres.
Linköping, February 2018 Joacim Lundberg
iii
Acknowledgement
There are many persons I would like to thank for making this thesis possible. The first to thank would be my family for their support. This also applies to my friends. My supervisors Sigurdur, Mats, Sara and Göran also have my appreciations for their supervision, which have steadily increased my knowledge and understanding in this subject, as well as all surrounding aspects which are part of becoming a researcher. Also greatly appreciated is my fellow PhD student Tiago Vieira, who have helped me with both understanding the basics in road noise and rolling resistance, but also helped my understanding greatly in general. A very special appreciation is also given to my co-workers at VTI, both specifically at the environmental unit, as well as the other units, for the great support, the great company and great fun I have while working at VTI.Special thanks also go to the reference group in this project consisting of Jan Skoog, Peter Smeds, Robert Karlsson, Julia Bermlid, Martin Juneholm and Lars Dahlbom, all from the Swedish Transport Administration.
Special thanks also goes to Katharina Lindroos at KTH for all help with the administration.
This thesis work was carried out between September 2015 and February 2018 at VTI in collaboration with the Division of Building Materials at KTH. The work was financed by the Swedish Transport Administration and VTI, for which I’m grateful.
Linköping, February 2018
v
Abstract
Non-exhaust PM10 is an issue in the urban environment linked to several health issues. The emissions of non-exhaust PM10 is relatable to pavement properties determining the emission due to abrasion wear of studded tyres, as well due to wear of the tyres and brakes. Another important factor is resuspension of road dust stored on the surface. This is depending on several traffic and metrological conditions, such as amount of traffic, tyre types, traffic type, precipitation, road surface moisture etc. Given this, the purpose of the thesis was to give an overview limited to Sweden and the Nordic countries regarding non-exhaust PM10 emissions and road dust.The tyre is a complex composite construction consisting of many different materials and is optimized depending on the needs. Winter tyres (studded and non-studded) are optimized for colder conditions than summer tyres, impacting on material selection and properties. In countries such as Sweden, the usage of winter tyres is mandatory during the winter, and a large proportion of the light traffic (50-99%) use studded winter tyres depending on the region. This gives a high impact on the surface courses of the roads in form of abrasion wear, which produces both primary emissions due to direct emission of particles, but also secondary emissions from road dust through resuspension. This abrasion wear is the direct cause of stricter regulations of studded tyres in Sweden, Finland and Norway, and is also the cause of the heavy use of Stone Mastic Asphalts in Sweden. Another aspect of the surface course is the macro texture. Not much research is available but there is a link between PM10 emissions and the texture depth, as well as a link between the road dust storage capabilities and the macro texture. One of the studies performed and appended to this thesis found that the macro texture could likely be used as a base to predict the theoretical maximum dust load.
A large variety of measurement devices exists for ambient measurement of particle concentrations, both regarding number and mass concentration. These measurement devices are based on different principles, such as e.g.
vi
gravimetric properties of particles. These devices can be used as stationary measurement station but can also be used for mobile measurements by utilising them in a system mounted on a vehicle or a trailer. For road dust sampling, no uniform measurement method exists. Methods using dry methods, such as vacuuming, exists which samples the suspendable fraction of the road dust. There also exists a wet sampling method used to sample the total road dust load available.
To be able to optimize e.g. maintenance or operation procedures such as dust binding, modelling of particle emissions is required. One such model is the Non-Exhaust Road Traffic Induced Particle emission (NORTRIP) model. NORTRIP is a process-based model taking several complex processes such as e.g. road surface moisture, into account to predict the non-exhaust emissions. NORTRIP uses the Swedish studded tyre abrasion wear model which was developed at VTI to predict the contribution of road abrasion wear to the particle emissions and road dust. A study, with a paper appended to this thesis investigated the model validity. The studded tyre abrasion wear model was found to be inaccurate and was calibrated for further use. It was also found that the implication for NORTRIP was an overestimation of the contribution from pavement abrasion wear to the total modelled PM10.
To decrease the problems of resuspension and non-exhaust particle emissions, known from measurements or modelling, several options is available. One such thing is to reduce the use of traction sanding, which is known to both increase the abrasion wear through the sandpaper effect but also by being crushed into suspendable fractions. Another option is to utilize dust-binding to keep the dust from suspending, and removing it by using different cleaning methods, such as vacuum suction. Other possibilities exist which are not linked to a road operation perspective. One such possibility is to replace the surface course with a more abrasion resistant type, by reducing the share of studded tyre users or other types of traffic related options.
vii A currently major environmental problem is the lack of holistic view. Other major urban environmental problems such as road traffic noise exists and usually no idea behind decreasing the total environmental impact is used. Instead the responsible rather focus on the (currently) largest issue. One such example is to introduce smaller aggregate sizes to reduce road traffic noise, which will in turn increase the abrasion wear and thus also the particle emission.
Finally, much knowledge is available regarding particle emissions from road surface and tyre interaction and the impacting factors, but several important knowledge gaps have been identified. These gaps can be essential for continued understanding of processes and the impact on emissions. Amongst others it was identified a greater need of understanding the road surface and tyre interaction and the road surface macro textures influence on road dust and non-exhaust PM10 emissions. The continued work will be focused on, amongst other, the combined issue of road surface and tyre interaction and the impact road surface macro texture have on road dust and non-exhaust PM10 emissions together with impact on road noise emissions in a collaboration with a fellow PhD student.
Keywords
Road Dust, Abrasion Wear, Road Surface Macro Texture, Mean Profile Depth, Mean Texture Depth, Emissions, Abrasion Wear Model, NORTRIP, PM10, Air Quality, Particles
ix
Sammanfattning
Icke-avgasemissioner av PM10 är ett problem i den urbana miljön och är kopplad till flertalet hälsoaspekter. Dessa emissioner är relaterade till flertalet beläggningsegenskaper, nötningsslitage av vägbeläggningar samt till emissioner av broms- och däckpartiklar. An annan viktig faktor är suspensionen av vägdamm som finns lagrad på vägytan. Denna suspension beror på flertalet faktorer relaterade till trafik och metrologiska förhållanden, såsom mängden fordon, däcktyper, trafiktyp, nederbörd, ytfuktighet m.m. Givet detta var syftet med denna avhandling att ge en överblick av nuvarande forskning, begränsat till Sverige och Norden, kring icke-avgasemissioner av PM10 och vägdamm.Däcket är en komplex kompositkonstruktion bestående av flertalet material och optimeras beroende på behovet. Vinterdäck (dubbade och ej dubbade) är optimerade för kallare klimat än sommardäcken vilket inverkar på valet av material och egenskaper. I länder såsom Sverige är användandet av vinterdäck obligatorisk under vintern, och en stor andel av den lätta trafiken (50-99%) använder dubbade däck beroende på region. Detta medför an stor inverkan på vägens slitlager i form av nötningsslitage vilket producerar både primära emissioner från direktemissioner av partiklar, men även sekundära emissioner från vägdamm genom suspension. Nötningslitaget är den direkta orsaken till allt mer strikta lagar kring dubbdäck i Sverige, Finland och Norge, och är även orsaken till den höga användningen av stenrika beläggningar. En annan aspekt gällande slitlagrets yta är makrotexturen. Endast begränsad kunskap finns, men en koppling ses mellan PM10 emissioner och texturens djup samt en länk mellan vägdammsförrådet förvaringsmöjlighet och makrotexturen. En av studierna, bifogad denna avhandling, drog slutsatsen att makrotexturen troligtvis kan användas för att bestämma det teoretiskt maximala vägdammsförrådet.
En stor mängd och variation av mätinstrument finns för mätning av partiklar i luften, både i form av nummer- och masskoncentrationer. Dessa
x
instrument bygger på flertalet olika principer, såsom t.ex. gravimetriska egenskaper hos partiklarna. Dessa mätinstrument kan användas som stationära mätstationer, men kan även användas för mobila mätningar genom att nyttja dem i fordon eller släpvagn. För provtagandet av vägdamm finns ingen uniform mätmetod. Det finns torra metoder (baserade på dammsugning och introduktion av suspension) vilka provtar den supenderbara fraktionen av vägdamm, men även en våt metod finns som istället provtar den totala vägdammsfraktionen.
För att optimera t.ex. underhåll eller driftåtgärder såsom dammbindning, krävs modellering av partikelemissioner. En sådan modell är Non-Exhaust Road Traffic Induced Particle emission (NORTRIP) modellen. NORTRIP modellen är en processbaserad modell vilket tar hänsyn till flera komplexa processer såsom t.ex. vägytans fuktförhållanden vid prediktionen av icke-avgasemissioner. NORTRIP använder den svenska nötningslitagemodellen, som utvecklades vid VTI, för att prediktera nötningsslitagets tillskott till både partiklar och vägdamm. En studie, bifogat denna avhandling, drog slutsatsen att nötningsslitagemodellen överskattade slitaget och kalibrerades därför. Detta gav implikationen att NORTRIP överskattar bidraget från beläggningsslitaget till den totala PM10 emissionen.
För att minska problemen med suspension av vägdamm och icke-avgasemissioner, kända från mätningar eller modellering, finns flertalet möjligheter. En sådan är att minska användningen sand på gator vilket dels ökar vägslitaget genom sandpappereffekten, och dels som krossas ner till finare suspenderbara fraktioner. En annan möjlighet är att använda dammbindning för att förhindra suspension, samt att genomföra städåtgärder (såsom vacuumdammsugning) för att ta bort dammförråd. Det finns fler åtgärder som ej är länkade till driftåtgärder. En sådan är att ersätta det befintliga slitlagret med en mer nötningsresistent variant, alternativt att minska andelen dubbdäck eller andra trafikåtgärder.
xi Ett för närvarande stort miljöproblem är avsaknaden av ett helhetsperspektiv. Andra stora urbana miljöproblem såsom trafikbuller existerar och vanligtvis finns inte en överhängande plan kring den total inverkan på miljön. Istället brukar fokus ligga på det (för närvarande) värsta problemet. Ett sådant exempel är att använda ett slitlager med mindre stenstorlekar, vilket minskar bullernivåerna, men samtidigt ökar nötningsslitaget och därigenom partikelemissionerna.
Slutligen, finns mycket kunskap kring partikelemissioner och inverkande faktorer, men det finns även flertalet viktiga kunskapsluckor som har identifierats. Dessa luckor är viktiga för en fortsatt förståelse kring de olika processerna och dess inverkan på emissioner. Bland slutsatserna identifierades ett behov av ökad förståelse kring vägyta-däckinteraktionen och hur beläggningars makrotextur inverkar på vägdamm och icke-avgasemissioner. Det fortsatta arbetet kommer att fokusera på, bland annat, just detta samt dess inverkan på vägtrafikbuller i samarbete med en annan doktorand.
Nyckelord
Vägdamm, Vägslitage, Dubbslitage, Textur, Emissioner, Slitagemodell, NORTRIP, PM10, Partiklar, Luftkvalitet
xiii
List of Appended Papers
This licentiate thesis is based upon the following scientific articles:Paper A
Lundberg, J., Janhäll, S., Gustafsson, M. & Erlingsson, S. 2018. Calibration of the Swedish Studded Tyre Abrasion Wear Prediction Model and the Implications for the NORTRIP Road Dust Emission Model.
Transportation Research Board 97th Annual Meeting conference proceedings. Washington D.C., U.S.A.
Lundberg performed the data gathering, the analysis and the recommendations as well as wrote the paper. Janhäll, Gustafsson and Erlingsson supervised the work.
Paper B
Lundberg, J., Blomqvist, G., Gustafsson, M. & Janhäll, S. 2017. Texture influence on road dust load. Transport and Air Pollution conference
proceedings. Zürich, Switzerland.
Lundberg planned and performed the experiment, the analysis and the conclusions, as well as wrote the paper. Blomqvist, Gustafsson and Janhäll supervised the work.
xv
Abbreviations
AADT Annual Average Daily TrafficAPMP Ambient Particulate Matter Pollution CEN European Committee for Standardization
CPX Close Proximity
DAC Dense Asphalt Concrete HMA Hot Mixed Asphalt MPD Mean Profile Depth MTD Mean Texture Depth
PA Porous Asphalt
PM Particulate Matter with any aerodynamic diameter PM10 Particulate Matter with aerodynamic diameter < 10 µm PM2.5 Particulate Matter with aerodynamic diameter < 2.5 µm PM2.5-10 Coarse particle span
PIXE Particle Induced X-ray Emission PWR Pavement Wearing Ration
RS Road Simulator
SA Silent Asphalt
SEM Scanning Electron Microscope SMA Stone Mastic Asphalt
SPL Sound Pressure Level SSA Steel Slag Aggregate
STA Swedish Transport Administration TEM Transmission Electron Microscope
VTI Swedish National Road and Transport Research Institute WDS Wet Dust Sampler
xvii
List of Figures
Figure 1. An example of a particle of given geometric shape (left) and itsequivalent aerodynamic diameter (right) with corresponding particle diameters, densities, shape factor and terminal settling velocities. Source: Hinds (1999). ... 8 Figure 2. Illustration of a particle compacting on a, in this case, single
fiber. Source: Hinds (1999). ... 12 Figure 3. Isokinetic sampling. Source: Hinds (1999). ... 13 Figure 4. Three cases of anisokinetic sampling where: (a) represent
misalignment, (b) represent superisokinetic sampling, i.e. U > U0, (c) represent subisokinetic sampling, i.e. U < U0. Source: Hinds (1999). ... 14 Figure 5. Illustration of some of the transport processes available in the
urban environment. Top figure illustrates particle transports linked to precipitation (rain and snow). The middle figure illustrates the transport processes due to heat radiation. The bottom figure
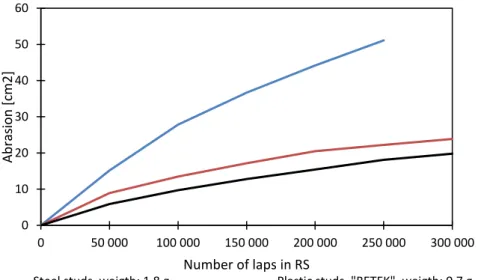
illustrates transport processes linked to turbulence. ... 17 Figure 6. The radial tyres different components. Source: Gent and Walter (2005). ... 20 Figure 7. The results from testing different stud types in the RS. The
pavement type was a Swedish HABT16 porphyry (Hard Dense Asphalt Concrete, maximum aggregate size 16 mm of type porphyry). Observe that the y-axis is expressed as the abraded area of the cross section, cm2. Also observe that steel studs (blue line) was
conventional at the time the trials were made. The plastic studs (orange line) had a body of plastic, but the pins were in metal. Tyres used was Gislaved Nord Frost and Good Year Ultra Grip 300. Both cases had about 110 studs per tyre. Graph based on Gustafson (1992, table 6, p. 50). ... 22 Figure 8. The different types of stud construction. Left is multi-flange
construction and right is single flange construction. Source: Simon Company Group, 2003 [as cited in (Zubeck et al., 2004)]... 23
xviii
Figure 9. The contact between the studs on a rolling tyre and a surface. Source: Gültlinger et al. (2014). ... 25 Figure 10. Estimations of the national mean share of different types of
tyres used during the Swedish winter (January – March) during the years 2010 - 2016. Based on data from Trafikverket (2016). ... 26 Figure 11. Estimated share of tyre type during the Swedish winter
(January – March) for each region during the years 2010 – 2016. Drawn from data in Trafikverket (2016). ... 27 Figure 12. The Swedish Traffic Administrations traffic regions. Adapted
and modified from: Trafikverket (2015). ... 28 Figure 13. The PM10 concentration due to wear from studded tyres (S) and
friction tyre (F) for two different pavements in VTIs’ RS. ABT = AC, G = Granite, ABS = SMA, Q = Quartzite. Source: Gustafsson et al. (2008). ... 33 Figure 14. A comparison between the PM10 emission in the RS tests for
several different types of SMA (ABS 16, 11 and 8) and several types of aggregates in order of legend appearance: syenite, diabase, quartzite, porphyry granite, mylonite, steel slag, steel slag, quartzite and rhyolite. Source: Viman and Gustafsson (2015). ... 34 Figure 15. Mass size distribution for three different pavements (SMA16, 11
and 8) with three different types of mineral aggregate (Quartzite, Porphyries and Mylonite) at three different speeds. Source:
Gustafsson et al. (2011b). ... 35 Figure 16. Impact on PM10 concentration depending on share of studded
tyres in the RS. Source: Gustafsson et al. (2011b). ... 36 Figure 17. Upper figure shows an example of positive texture while the
bottom figure shows an example of negative texture. ... 40 Figure 18. Schematic drawing of the laser profilometer method. Adapted
from: Moffatt and Urbain (2016). ... 42 Figure 19. Degree of explanation, R2, and regression equation between
Nordic abrasion value (y-axis) and road abrasion wear (x-axis). The correlation is between wear measured in the field on test slabs and the results from the Nordic ball mill test. In the white bubbles (from left to right) it says: porphyry, quartzite, fine-grained granite,
xix medium-grained granite, and gneiss. Source: Jacobson and Wågberg (2007). ... 48 Figure 20. VTIs circular road simulator (RS), in this case without wheels
mounted on the axles and with slabs of concrete mounted on the track. ... 54 Figure 21. The APS inlet system for APS 3300 (without proper scaling).
Adapted from Baron (1986). ... 60 Figure 22. Illustration of an impactor. Source: Hinds (1999). ... 63 Figure 23. A figure over the Sniffers measurements and the measurement setup. Source: Pirjola et al. (2004) ... 67 Figure 24. Schematic over TRAKER equipment and inlet positioning.
Figure source: Etyemezian et al. (2003b). ... 69 Figure 25. The isokinetic sampling probe with the different parts to gain
isokinetic conditions. Source: Fitz (2001). ... 75 Figure 26. A schematic of the position of the trailer in reference to the
vehicle, with the configuration of the sampling equipment. Source: Fitz (2001). ... 76 Figure 27. Presented results from the Mineral aggregate sub-model: (a)
rut depth development (blue line) and allowed rut depth from user input, (b) the transverse rut profile over a fixed lane width. Similar graphs are produced when using the Prall sub-model. ... 83 Figure 28. Schematic outline of the NORTRIP model. Source: Johansson
et al. (2012). ... 85 Figure 29. The relation between speed [km/h] and the mean
concentration of particles of size 0,523-10 µm [µm/m3] (upper figure) and 16-723 nm [#/m3] (lower figure) for studded tyres and non-studded (friction) tyres on an SMA with quartzite. The blue lines are studded tyres and the red lines are non-studded tyres. The investigation was made in the VTI RS. Source: Gustafsson et al. (2005) ... 99 Figure 30. A schematic over the different mechanisms controlling noise
generation due to the road surface – tyre interaction. The red bars are the different vibrational mechanisms, the purple bars are the different aerodynamical mechanisms and the orange bars are the
xx
different amplification mechanisms. Figure produced by and used with permission from Tiago Vieira, who adapted it from Sandberg and Ejsmont (2002). ... 104 Figure 31. Schematic figure over the different phases of a double layered
porous pavement. Black is the bitumen/mastic phase, grey is the aggregate phase and white is the void/air phase. ... 106
xxi
List of Tables
Table 1. Different definitions regarding road dust. Partly from Gustafssonet al. (2016). ...10 Table 2. Common surface courses on state-level road network in Sweden
calculated from information of total road length with the
corresponding surface type, given by Fredrik Lindström, Swedish Transport Administration. The different categories are the summarised type of all different subtypes in the category. The remaining share is different types of repair and maintenance
pavements. ... 31 Table 3. The classification of different irregularities on the road pavement
surface. Table adopted from PIARC (1987) and Moffatt and Urbain (2016). ... 39 Table 4. Consumption of traction sand per winter season in the Nordic
countries and the Faroe Island. Source: Knudsen et al. (2014). ... 88 Table 5. Consumption of road salt per winter season in the Nordic
xxiii
Contents
1. Introduction... 1
1.1. Health aspects of PM emissions ... 2 1.2. Socio-economic impact of PM emissions ... 4 1.3. Non-exhaust PM emissions... 5 1.4. Purpose ... 52. Road Dust and Particle Transport Processes ... 7
2.1. Definition of aerosols, particulate matter and road dust ... 7 2.2. Basic particle physics for transport in air ... 10 2.3. Particle system transport processes ... 153. Road Surface and Tyre Interaction ... 19
3.1. General tyre construction and materials... 19 3.1.1. Studded tyres ... 22 3.2. Tyre usage in Sweden, Norway and Finland ... 26 3.3. Surface course properties related to road dust and PM10 generation ... 29 3.4. Road surface texture ... 38 3.4.1. Road surface texture and its impact on road dust and PM emissions. . 424. Determination of Wear Course Properties ... 47
4.1. Mineral aggregate properties ... 47 4.1.1. Nordic abrasion method ... 47 4.1.2. Micro-DeVal ... 48 4.1.3. Los Angeles Index ... 49 4.1.4. Impact value ... 49 4.2. Surface mix type properties ... 50 4.2.1. Prall abrasion method ... 50 4.2.2. Pavement wearing ratio ... 51 4.2.3. Tröger ... 52 4.3. Large scale testing ... 535. Road Dust and PM Measurement Methods ... 57
5.1. Ambient measurement equipment for particle measurements ... 57 5.1.1. Gravimetrical Methods ... 58 5.1.2. Optical methods ... 58 5.1.3. Electrical methods ... 61xxiv
5.2. Methods for particle collection ... 62 5.2.1. Cascade and virtual impactors ... 62 5.2.2. Filter collection ... 64 5.2.3. Cyclone ... 64 5.3. Mobile measurement methods ... 65 5.3.1. Sniffer ... 65 5.3.2. TRAKER ... 68 5.3.3. EMMA ... 72 5.3.4. SCAMPER ... 75 5.4. Road dust sampling methods ... 77 5.4.1. Wet Dust Sampler ... 77 5.4.2. Dust vacuuming method ... 79 5.4.3. AP-42 ... 79
6. Modelling of Abrasion Wear and Non-Exhaust PM
10... 81
6.1. Swedish studded tyre abrasion wear model ... 81 6.2. NORTRIP emission model ... 84
7. Road Operation Effect on Road Dust and PM
10... 87
7.1. Traction sanding ... 87 7.2. De-icing and dust binding ... 89 7.3. Cleaning of road surfaces for reduction of dust load ... 93
8. Other Options to Reduce Traffic-related Non-Exhaust
PM
10... 97
8.1. Altering of traffic situation ... 97 8.2. Altering of pavement properties ... 100
9. Environmental Issues Related to Road Surface and Tyre
Interaction ... 101
9.1. Road traffic noise basics... 101 9.2. The combined issue of road noise and road dust/PM10 emissions ... 10510. Conclusions, Research Needs and Continued Work .. 111
References ... 115
1
1. Introduction
High concentrations of inhalable and respirable particles in urban areas is an increasing problem, not only in Sweden and the Nordic countries but also in the rest of the world. Within the European Union (EU) the limit values for Particulate Matter (PM) with an aerodynamic diameter smaller than 10 micrometres (PM10) is exceeded by nearly all countries in the entity of Europe (Johansson et al., 2012). Furthermore, it is mentioned that up to 49 percent of the urban populations in Europe is exposed to concentrations far over the EU daily air quality limit value, and no downward trend is seen in the majority of the cities. Currently, the limit value for PM10 is set to 50 µg/m3 in average over 24 hours, which is permitted to be exceeded 35 times per year (European Comission, 2016). There is also given an annual limit value, set to 40 µg/m3. For PM2.5 the annual limit value is set to 25 µg/m3.There are many sources of PM and Kampa and Castanas (2008) lines up a few examples of the major sources, including factories, power plants, construction activities, road traffic as well as natural windblown dust amongst others. The wind is also one transport mechanism that can affect air quality in distant regions regarding aerosols. A study by Furusjo et al. (2007) identified that resuspension, long-way transport was the dominating factors for the PM10 levels in urban street canyons together with a vehicle derived factor, in contrast to a highway location where long-way transport was the dominating source. The authors were not able to determine if the resuspension originated from soil dust or road abrasion. Querol et al. (2004) compared PM from seven different countries in the EU consisting of Austria, Germany, Spain, Sweden, the Netherlands, United Kingdom and Switzerland. They investigated both PM10 and PM2.5 for kerbside sites, as well as at urban and regional levels They found that (based on annual mean) PM10 varied between 19-24 µg/m3, 28-42 µg/m3 and 37-53 µg/m3 at regional background sites, urban background sites and kerbside sites. For Sweden, the concentrations varied between 8-16 µg/m3, 17-23 µg/m3 and 26-51 µg/m3. For the regional background, mineral content accounted for 25 %, while it for the urban background and the
2
kerbside background accounted for 39-41% and 59-65%. The authors mention that the urban background of mineral content can be accounted to demolition work, construction work and road dust. At kerbside, the contribution of mineral content is corresponding to the road dust emissions from streets, which is partly due to the usage of studded tyres in Sweden. Another example on investigations of sources is found in Zeng et al. (2010) who used receptor modelling to determine sources and found that vehicle exhaust contributed with 13% and resuspended dust contributed with 26% to the total PM10 in the city of Taiyuan in China.
1.1. Health aspects of PM emissions
The main reason PM is a large problem is the health impact on the human population, and likely on the populations of domestic animals and wildlife. Perez et al. (2009) concluded that increased levels of PM2.5-10 as well as PM1 is associated with increased levels of both cardiovascular and cerebrovascular mortality. For fine particles (PM2.5-1) they found an association to respiratory mortality. Similar results were achieved by Stafoggia et al. (2013) who showed a connection between cardiovascular and respiratory admission for PM2.5-10 and PM2.5 in eight different Mediterranean cities. In another study where air pollution was investigated it was concluded that the short-term exposure of air pollution (NO2, NOx, PM10 and PM2.5) could initiate hospital admission for asthma in children (Iskandar et al., 2012). There was also non-significant indications that infants showed a stronger association than the older children. Adar et al. (2014) performed another study to investigate hospital admission and exposure of PM2.5-10. They found suggestive evidence of increased admission to hospital and mortality with higher levels of short term PM2.5-10 concentrations, although they could not see the same effect for the long-term concentrations.
Other studies investigate the connection between the air pollution and lung cancer. Raaschou-Nielsen et al. (2013) performed a large multicentre study to investigate the suspected connection between long exposure of ambient
3 air pollution and lung cancer incidence, in which they assessed the air pollution by land-used regression models for both PM10, PM2.5 and PM2.5 – 10 (amongst others). They concluded that there is an association between PM air pollution exposure and the incidence of lung cancer in Europe. In another article, Raaschou-Nielsen et al. (2016) further investigated the connection between air pollution and lung cancer for eight different elements (Cu, Fe, K, Ni, S, Si, V and Zn) in the size fractions of PM2.5 and PM10. They conclude that there are indications that several PM elements from different size fractions have associations with the risk of lung cancer. For ultrafine particles (PM < 100 nm) which are not under such strict regulations as PM10, Lanzinger et al. (2016b) describes that ultrafine particles generally are not under regular monitoring as a cause of the limited evidence of the health effects. The authors made their investigation in five different central and east European cities and concluded that there was a non-significant statistically positive relationship between lengthy exposure between ultrafine particles and respiratory mortality, independently of particle mass exposures.
There are also Swedish studies regarding the health and its’ association to PM. In a study regarding central Stockholm elevated urban background levels of PM2.5-10, Meister et al. (2012) concluded that there was an increased daily mortality. In another study, Gustafsson et al. (2006) mentions that it is generally considered that the particle content in the air is associated with health risks, even though other factors such as genetic set and the overall health status is relevant for the particles’ ability to trigger illness. Furthermore, epidemiological studies show a convincing connection between the content of PM10 in the surrounding air and the occurrence of respiratory and cardiovascular diseases in the population as well as in the populations’ mortality. Estimations of the reduced life expectancy and premature deaths per year performed by Forsberg et al. (2005) estimated up to 10 months of reduced life expectancy and as many as 5 300 premature deaths due to the long-time exposure of PM10.
4
Research have shown that a large part of the particle mass concentration measured in urban environments consists of wear particles from pavements tyres and breaks (WHO, 2005, Gustafsson et al., 2011d). For the Nordic countries (except for Denmark) who allow the usage of studded tyres and have a high share of studded tyres during the winter, pavement wear is of special interest. A toxicologic cell study performed by Gustafsson et al. (2005) indicates that particles from studded tyres have a similar inflammation potential as PM10 from a city street environment as well as from diesel exhaust particles, while PM10 from a subway environment had lower potential. Denier van der Gon et al. (2013) came to a consensus statement that more toxicological and epidemiological evidence regarding wear emissions are needed to tackle the problematics as wells as to help the policy makers, since the health risks associated with wear emissions were agreed to be non-neglectable. Amato et al. (2014) performed another review article regarding the problematics and difficulties of non-exhaust PM and concluded that, after reviewing available data and articles, there is indications that non-exhaust PM can be as hazardous as exhaust (tail-pipe) PM.
1.2. Socio-economic impact of PM emissions
The health problems from PM emissions results in higher socio-economics cost in the form of loss of life, reduced life expectancy, increased cost for healthcare and reduced productivity. There are different estimations to what the socio-economic cost is due to the premature deaths caused by the particle levels. According to WHO Regional Office for Europe OECD (2015) the ambient particulate matter pollution (APMP) caused 565 271 and 498 538 premature deaths in 2005 and 2010 respectively, with an estimated socio-economic cost of 1 007 223 and 1 156 118 million US$ for 2005 and 2010 respectively for the whole European region. Of these numbers, Sweden had 1 003 and 1 040 premature deaths due to APMP in 2005 and 2010 respectively, with an estimated socio-economic cost of 3 219 and 3 641 million US$ for 2005 and 2010 respectively. Swedish estimations of the socio-economic cost (as loss in welfare) of the health
5 effects of high annual mean levels of PM to about 26 billion SEK in 2005 (Sjöberg et al., 2009). In a later study, Gustafsson et al. (2014b) estimated the socio-economic cost (still as loss in welfare) to 35 billion SEK in 2010 for PM (from road dust, domestic heating and other sources). Another investigation of the total external cost of mortality for the total PM emissions estimated a cost of 16.3 – 47.1 million €, of which 0 – 1.4 million € was from non-exhaust road traffic sources in the Stockholm (Sweden) area (Nerhagen et al., 2009).
1.3. Non-exhaust PM emissions
Non-exhaust PM problem is highly seasonal, with the highest levels measured during dry winters and spring, when the roads start to dry up and particles previously bound to wet surfaces, snow and ice are suspended (e.g. Gustafsson et al., 2011d, Gustafsson et al., 2015). The generation of PM10 from the tyre – pavement interaction depends on a wide number of things. Among these are the traffic amounts and speed, the mineral aggregate quality, largest stone size used, type of tyres (studded, non-studded), type of pavement (AC, SMA) and the meteorology.
1.4. Purpose
The purpose of this thesis based on the background description given earlier in this chapter is to summarize current research efforts of non-exhaust PM10 in Sweden, limited to the road dust contributions from the road surface and tyre interaction. Furthermore, this thesis aims to, based on the literature review, identify knowledge gaps. Also described is the direction and focus of the continued studies.
This report also describes some models used for this purpose (fully or partly) as well as methods to measure road dust loads. Well established measurement methods or analysis methods will not be described in full detail.
7
2. Road Dust and Particle Transport Processes
One important aspect regarding road dust and particle emissions is the transport process. Depending on size and surrounding conditions the particle will behave differently and be to greater or lesser extent affected by different transport processes. This chapter first provides some definitions for aerosol, particles and road dust followed by a brief description of some particle physics in air most relevant for coarse particles. Last a brief introduction to some transport processes of road dust and particle emissions will be given.2.1. Definition of aerosols, particulate matter and road
dust
Particles are usually defined based on their diameter. This can be problematic since most particles are non-spherical. To mitigate this problem equivalent sizes are used.
One way to determine equivalent particle sizes is to use microscopes, e.g. SEM (Scanning Electron Microscope) or TEM (Transmission Electron Microscope) in which the particles are size determined based on their two-dimensional projected image (Hinds, 1999). One problem with this is that the size will be determined only from the geometrical aspects of the particle and not its physical (or electrical) properties.
Another way to determine an equivalent size is to use the aerodynamic diameter. Hinds (1999) defines the aerodynamic diameter as the diameter of a specific particle which have the same settling velocity as a particle of a standardized shape, in this case spherical, with a density of 1000 kg/m3. An illustrative example is given in Figure 1. In relation, other types of equivalent diameters exist even though the aerodynamic is the more commonly used.
8
Figure 1. An example of a particle of given geometric shape (left) and its equivalent aerodynamic diameter (right) with corresponding particle diameters, densities, shape factor and terminal settling velocities. Source: Hinds (1999).
Another useful diameter is the one based around electrical mobility, which is used in several measurement instrument types. Hinds (1999) mentions that this electrical mobility is given by quote between the terminal electrostatic velocity and the field strength at the particle. This is in turn dependant on the electron charge and the number of these charges, the dynamic viscosity, a drag coefficient and the particle diameter.
One problem regarding the area of aerosols and particulate matter is the lack of strict classifications, although there exist rough definitions for common usage. Hinds (1999) tells that an aerosol is defined as solid or liquid particles suspended in air. This term includes both the particles and the gas they are suspended in (commonly air). The time of suspension varies with the particles, where the aerosol can be stable for a few seconds or lasting for a year or more in other cases. The size range of particles in an aerosol is in the range of 0.001 – 100 µm. Some other divisions are also presented by the author:
• Fine particle / coarse particle: particles smaller / larger than 2 µm in diameter.
• Dust: a solid particle aerosol. This particle is formed by mechanical disintegration of a material, e.g. by crushing or grinding of a
9 material (such as traction sand). The size of these dust particles varies from sub-micrometre up to visible sizes.
Another slightly different definition is given by Kampa and Castanas (2008), where different categories is defined:
• Fine particles / coarse particles: particles smaller/ larger than 1 µm in diameter.
• Ultrafine particles: particles smaller than 0.1 µm in diameter, which is also used by others (e.g. Gustafsson et al., 2011c, Kumar et al., 2014, Lanzinger et al., 2016a).
The most common definition seems to be the one different governmental sources use, since it is this definition the legal documents usually refer to. According to both the United States Environmental Protection Agency (2016) as well as the European Comission (2016) the following definitions are used:
• Coarse particles: PM2.5-10 • Fine particles: PM2.5
These different definitions are important to keep in mind, since different terminology and definitions may lead to confusion depending on what is discussed. PM is usually also the total amount of particles and that includes both exhaust as well as non-exhaust particles, although in this report the focus is on the non-exhaust particles.
For road dust the following definitions from Gustafsson et al. (2016) are given in Table 1 as an example of definitions which can be used.
10
Table 1. Different definitions regarding road dust. Partly from Gustafsson et al. (2016).
Terminology Definition
Dust / Road dust Particles of sufficient small sizes for suspension from the road surface
Dust load Total amount of dust available on a given surface Dusting The process leading to suspension / resuspension of
dust
Dust emission The flow of dust from the dust storage to the air Dusting potential The amount of dust available for dusting
Dusting tendency How easily accessible the dust in the dust storage is for dusting
2.2. Basic particle physics for transport in air
There exist several phenomena causing transport of particle suspended in a gas (the air in this case) which cause particles to deposit on surfaces (and thus be removed from the air). Hinds (1999) mentions several transport processes, of which the first five are considered the basic transport processes: • Gravitational settling • Impaction • Interception • Diffusion • Electrostatic attraction • Thermophoresis / Photophoresis • Radiation Pressure • Diffusiophoretic force • Stefan flow
Of these, the first two process of gravitational settling and (inertial) impaction is of most importance for the coarse (heavier) particles, such as PM2.5-10, and thus these will be further explained.
11 The gravitational settling is the process of particles settling through the air due to the impact of the gravimetrical force (Hinds, 1999). The terminal settling velocity is reached when the drag force is equal to the gravitational force and is proportional to the particles square diameter. This terminal settling velocity for irregular particles depend on several aspects, such as the laminar flow (determined by Reynolds number), particle density and diameter, the gravitational acceleration, the coefficient of dynamic viscosity, a dynamic shape factor governing different particle shapes and the Cunningham’s slip correction factor. The last factor accounts for the assumption that the relative velocity of the gas at the surface of the particle is zero (Stokes’s Law), which is not true when the size of particles approaches the mean free path of gases. This error is, according to Hinds (1999), significant for particle diameters smaller than 1 µm.
Impaction is the second major transport process for coarse particles in which the particle flowing along a gas streamline is unable to adjust to the change of trajectory due to its inertia (Figure 2). This process, given the example of a fibre, depends on several aspects such as the particle density and diameter, the Cunningham’s slip correction factor, the undisturbed air velocity, the dynamic viscosity of the gas and the fibre diameter (Hinds, 1999). This calculation gives Stokes number. When Stokes number increases (the ratio of particle stopping distance to fibre dimeter) the efficiency of single fibre impaction increase.
12
Figure 2. Illustration of a particle compacting on a, in this case, single fiber. Source: Hinds (1999).
Impaction on single fibres is one of the five aspects used to determine filter efficiency. The total efficiency is made up by the first four transport processes listed earlier together with an interaction term (Hinds, 1999). It is important to have some knowledge regarding this when setting up for measurement with the intention of filter collection, since this will impact on which particle sizes the filter will effectively sample.
One special aspect related to the impaction is the cut-off size of particles, which is important for some measurement devices, such as the cascade impactor. The cut-off size (also known as cut off diameter or d50) is the size at which 50% of the particles passing through is collected, where larger particles have less probability to pass through (Hinds, 1999). This is used, given the geometrical design and flow rates of the impactor, possibilities to design which size fractions are collected at different stages of an impactor, which can be used for further analyses and determination of mass size distributions.
Another important aspect to consider regarding particle measurements, for any type of concentration or if the goal is to collect particles on filter, is the isokinetic flow. Isokinetic sampling is used to gain a representative sample of the aerosol entering an inlet of a sampling tube Hinds (1999), as illustrated by Figure 3.
13
Figure 3. Isokinetic sampling. Source: Hinds (1999).
There exist three possible types of anisokinetic sampling: misalignment, super- and subisokinetic sampling, as illustrated by Figure 4. In case (a), misalignment of the probe with a certain angle (θ) from the gas streamlines will give a measurement biased towards smaller particle fractions, due to the larger particles having higher inertia and not being able to follow the drastic change of the streamline. In case (b), probes aligned to the streamlines with a higher gas velocity inside the probe (U) than the outside free-stream velocity (U0) will have problems of biasness to smaller particle fractions. This is due to larger particles having a higher inertia and thus cannot follow the streamline, while smaller particles will continue to follow the streamline. For the last case (c), probes aligned to the gas streamlines with a higher gas velocity inside the probe than the free free-stream velocity outside of the probe will have a biasness to larger particle fractions. This is, again, due to the inertia of the larger particles.
Isokinetic sampling only asserts that the same concentration occurs inside the sampling inlet as outside it. Losses in sampling tubes due to transport of the aerosol (e.g. gravimetrical deposition, deposition due to diffusion etc.) will still have to be accounted for through calculations, using formulas presented in e.g. Hinds (1999).
14
Figure 4. Three cases of anisokinetic sampling where: (a) represent misalignment, (b) represent superisokinetic sampling, i.e. U > U0, (c) represent subisokinetic
sampling, i.e. U < U0. Source: Hinds (1999).
Finally, it should be mentioned that the particles chemical properties will also have in impact on the transportation processes. Such processes are condensation, evaporation and solubility of particles, causing growth or decrease of particle sizes and thus also affecting which transport process will be the most dominating.
15
2.3. Particle system transport processes
Transport of particles in air depends on many different aspects, both regarding particle properties, but also the gas properties of the aerosol (which in this case is air). But particles are not only transported in air, but also in other mediums. Figure 5 gives a simplified illustration of the complex processes and their interaction affecting particle and road dust transport.
Depending on the geographical location, the background content of PM may vary. Some examples are coastal cities which have extra salt particles from the ocean, such as Gothenburg, or cities located around forests which will have in influx of particles from forests. Another example is particle contribution from surrounding farmland. This makes up the regional background, which also will be present in the urban environment. Another aspect is long transport of particles due to wind, such as e.g. wind from heavy industrial complex in other countries. In the urban areas, there are several contributions, such as local industry, wood burning etc. Local contributions in the urban areas consists mainly with emissions from traffic, both from exhaust but also from non-exhaust due to wear of brakes, tyres and pavements. In countries with studded tyres, the contribution from abrasion wear of pavement is especially high. All these makes up primary emissions, i.e. emissions directly emitted to the air.
These emissions are affected by several surrounding processes. The metrology is one such aspect with a large impact on the emissions. Wind can transport particles away, mix them up locally or transport particles to a location depending on wind direction, strength and the geometric of the area. Urban vegetation will have an effect on the deposition and dispersion of particles (Janhäll, 2015). During dry conditions dry deposition of particles takes place on different surfaces (e.g. road, building and vegetation surfaces etc.). During precipitation of rain or snow particles will be transported to the ground, due to particles depositing on rain droplets or snowflakes. The ground, not moist or wet will bind the particles.
16
Depending on the amount of water or snow, some particles will be transported away with the surface run-off water or melt water, some will be transported by splash or spray from tyres interacting with the wet pavement surface, and some will be transported away from ploughing with the snow. Other aspects such as radiation and winds will impact on the drying up process of the pavement surface. Evaporation will transport particles, and when the surface has dried up the road dust stored and built up by the moisture will (fully or partly) be available to be suspended the wind or by the tyres interacting with the pavement surface and road dust. Other aspects are the use of dust binding and cleaning of the road surface which will impact on the processes by artificially bind particles or remove them from the system, which is further described later.
17
Figure 5. Illustration of some of the transport processes available in the urban environment. Top figure illustrates particle transports linked to precipitation (rain and snow). The middle figure illustrates the transport processes due to heat radiation. The bottom figure illustrates transport processes linked to turbulence.
19
3. Road Surface and Tyre Interaction
Road surface and tyre interaction is a very wide and extensive scientific field. The contact between the road surface and the tyres is important in several areas of road and vehicle research, e.g. fuel consumption and exhaust emissions (e.g. the rolling resistance of the surface) and traffic safety aspects (e.g. friction). It is at the same time important from several environmental aspects such as road traffic noise (e.g. Brown, 2015, Vaitkus et al., 2017), but also in form of the non-exhaust PM emissions from the traffic, which is one of the major sources contributing to air quality, especially in areas where studded tyres are used. The latter subject will be the focus in this chapter. Before describing road dust and PM aspects, some initial description regarding tyres and pavements are required.3.1. General tyre construction and materials
When discussing tyres, it should be clear that it is the pneumatic tyres that are referred to in this report. The tyre have four main functions (Gent and Walter, 2005):
• Providing a vehicle to road interface. • Supporting the vehicle load.
• Providing road surface friction. • Absorbing road irregularities.
The tyre exists in three main tyres: Diagonal (bias) tyres, belted bias and radial tyres and the latter type is used for personal vehicles and is available in some variations (Gent and Walter, 2005). These tyres have radial body plies. These plies are laid at 90° from the centreline nominally. This type of tyre has several advantages due to the easier deflection under loading conditions: (i) better high-speed performance, (ii) less heat, (iii) lower rolling resistance and (iv) higher tread stiffness giving better handling and
20
less wear. This type of construction has a higher cost regarding materials and manufacturing to the complex construction.
The tyre in general consists of several different material components such as rubber compounds (e.g. polymers, fillers, softeners etc.) and reinforcement materials (e.g. nylon, steel cord, bead wire etc.) and more as presented in Figure 6 (Gent and Walter, 2005):
Figure 6. The radial tyres different components. Source: Gent and Walter (2005).
Another area of interest is that the tyre must be engineered to meet the criteria, since the common tyre for personal vehicles consists of around 60 different materials and changing one property in the tyre usually changes or affects other tyre properties (Gent and Walter, 2005).
There exist three different types of tyres: summer tyres, winter friction tyres and studded winter tyres (later described). Winter friction tyres can be subdivided into two types based on how they are optimized: continental or Nordic, where the former is optimized towards wet road surfaces and
21 the latter towards icy and slushy road surfaces. This is done not only through materials but also through the design of the tyre.
From a PM emission point of view, tyres is one of the aspects contributing to the total non-exhaust PM, both by tyre wear itself (Thorpe and Harrison, 2008) as well as how different tyre types affect the resuspension rates of road dust. The latter is mentioned in e.g. Kupiainen and Pirjola (2011) where an investigation using mobile measurement vehicle Sniffer (described in chapter 5.3.1 Sniffer) showed that studded tyres and light vehicle studded tyres in comparison to non-studded winter tyres (van tyres). Especially at speeds of 50 km/h or higher this difference was clear. Factors influencing this was both speed, the number of studs per tyre together with the weight of the studs.
An earlier investigation by Hussein et al. (2008b) using another measurement van (described in chapter 5.3.3 EMMA) also investigated the impact of tyres on emitted PM from the road surface and tyre interaction. They compared a studded tyre to a non-studded (winter friction) tyre as well as a summer tyre and found that studded tyres increased emission by 2 – 6,4 times compared to the friction tyres. The friction tyre in turn caused an increase of particle emissions by 4.4 – 17 times compared to summer tyres. The authors conclude that abrasion wear of pavements is the main cause to the higher emissions from studded tyres, while suspension is the main contributor for the winter friction tyres. The authors point out that more studies are required using light vehicle tyres rather than van tyres.
As indicated by the results, care is required since the measurement takes place behind the wheel, the results will be influenced by eventual braking events (direct brake wear emissions), emissions from tyre wear and emissions from pavement wear.
22
3.1.1. Studded tyres
Studded tyres have another component than the regular winter tyres; the studs. During the development and introduction of studded tyres during the late 1950s (Angerinos et al., 1999) or 1960-1970 the studs were manufactured in steel (Zubeck et al., 2004, Doré and Zubeck, 2009). The development since then have gone towards introducing lighter studs. The main reason for this development is due to the weight having a negative effect on the abrasion wear of pavements. One example of study on this is done by Gustafson (1992). He found in a trial in the circular Road Simulator (RS) at VTI where lighter studs used (light weight metal studs with jacket of aluminium, and plastic studs in comparison to traditional steel studs) gave a significant reduction of the abrasion wear, see Figure 7.
Figure 7. The results from testing different stud types in the RS. The pavement type was a Swedish HABT16 porphyry (Hard Dense Asphalt Concrete, maximum aggregate size 16 mm of type porphyry). Observe that the y-axis is expressed as the abraded area of the cross section, cm2. Also observe that steel studs (blue line) was
conventional at the time the trials were made. The plastic studs (orange line) had a body of plastic, but the pins were in metal. Tyres used was Gislaved Nord Frost and Good Year Ultra Grip 300. Both cases had about 110 studs per tyre. Graph based on Gustafson (1992, table 6, p. 50). 0 10 20 30 40 50 60 0 50 000 100 000 150 000 200 000 250 000 300 000 Ab ra sion [c m 2] Number of laps in RS
Pavement abrasion for different stud types
Steel studs, weigth: 1,8 g Plastic studs, "BETEK", weigth: 0,7 g Light studs, Eurometec, weight: 0,95g
23 According to Zubeck et al. (2004) two different types of studs are available in Anchorage (Alaska, U.S.A): conventional and light weight studs. The conventional stud has a steel jacket with tungsten carbide pins, usually with one flange (see Figure 8). The mass of these studs varies for different vehicle types but is commonly 1.9 grams for personal vehicles. The lightweight studs usually have a mass of 1.1 grams for personal vehicles and consists of a polymer jacket (or light metal composite) with tungsten carbide pins. These studs have one or two flanges (see Figure 8).
Figure 8. The different types of stud construction. Left is multi-flange construction and right is single flange construction. Source: Simon Company Group, 2003 [as cited in (Zubeck et al., 2004)].
In Sweden, regulations exist describing the number of studs per tyre, the weight of the studs, the mean and maximum protrusion and the static dub force (TSFS, 2009:90, TSFS, 2009:19). The regulations states that for light vehicles:
• The number of studs should not differ more than 25% from the tyre with most studs mounted on the vehicle.
• A combination of studded and non-studded tyres may not be mounted on a vehicle.
• Studs may be mounted in tyres determined by tyre manufacture. • Tyres used after 1 October 1998 must fulfil the requirements
24
Pipe studs are not allowed.1
Studs may not have a mass larger than 1.1 g.
From 2013, the number of studs can be maximum 50 per meter of rolling circumference.
The mean protrusion over the tyres surrounding tread may not exceed 1.2 mm for newly studded tyres or for tyres where new studs have been mounted.
The maximum protrusion may not exceed 2.0 mm for tyres in use.
The minimum protrusion should not be less than 0.9 mm for tyres in use.
The static stud force (measured at a protrusion of 1.2 mm at 20°C ± 4°C) may not be more than 120 N for newly studded tyres.
Similar legislations are available in both Norway and Finland. This legislation also state under which time periods the different tyre types are allowed, while also regulating during which conditions outside of the normal period winter tyres (studded tyres) are allowed.
The interaction between the road surface and the studded tyres is described by Gültlinger et al. (2014). The authors described the mechanical process according to Figure 9 and consists of six different phases:
1. The impact of the stud and pavement, meaning the first moment of this interaction contact.
2. Intrusion of the stud into the tyre (and the pavement depending on type)
3. Adhesion between the rubber and stud to the surface. If the tyre is running with slip, uniform deflection is present.
1 Pipe studs was an older technology used in studded tyres, which have since been banned.
25 4. Transition between adhesion (3) and sliding (5), which depending on the friction between the different studs and rubber materials and the track, sliding will occur for one of the two, while the other will continue to adhere to the surface until the limit of adhesion is reached.
5. At sufficient slip values both rubber and stud slides.
6. Snap out. This phase can be considered as the opposite of phase 2 (the process of when the stud lose contact with the surface)
Figure 9. The contact between the studs on a rolling tyre and a surface. Source: Gültlinger et al. (2014).
All these phases affect the abrasion damage according to the author by means of impact damage (e.g. energy from impact damaging the pavement), scratching damage (due to relative movement under vertical load) and compressive damage (the vertical load exceeding the compressive strength of the material underneath the stud).
According to the author, the impact damage is influenced by both driving speed, tyre slip, stud protrusion as well as the shape of the loaded tyre. The scratching damage instead is considered to be a minor part of the road wear, with the relative movement dependable on the slip condition of the complete tyre. This is due to the horizontal force being very low due to low friction between hard metal (i.e. studs) and stone. The compressive damage is assumed by the authors to be due to local stress peaks.
26
3.2. Tyre usage in Sweden, Norway and Finland
The Swedish Transport Administration (STA) has measured the number of vehicles with studded tyres in different cities. From these measurements they estimated the usage of different types of tyres used during the winter (January - March): summer tyres, non-studded tyres and studded tyres, see Figure 10. STA also present the tyre type usage divided into different Swedish regions, see Figure 11. The different regions are shown in Figure 12.
Figure 10. Estimations of the national mean share of different types of tyres used during the Swedish winter (January – March) during the years 2010 - 2016. Based on data from Trafikverket (2016). 0 10 20 30 40 50 60 70 80 2010 2011 2012 2013 2014 2015 2016 Sh ar e o f ty re ty p e [% ]
Share of tyres used in Sweden during winter
27
Figure 11. Estimated share of tyre type during the Swedish winter (January – March) for each region during the years 2010 – 2016. Drawn from data in Trafikverket (2016).
0 10 20 30 40 50 60 70 80 90 100
South West East Stockholm Middle North
Sh ar e o f ty re ty p e [% ]
The different regions of Sweden
Tyre types during winter in the different
Swedish traffic regions
2010 - Studded tyres 2011 - Studded tyres 2012 - Studded tyres
2013 - Studded tyres 2014 - Studded tyres 2015 - Studded tyres
2016 - Studded tyres 2010 - Non-studded tyres 2011 - Non-studded tyres 2012 - Non-studded tyres 2013 - Non-studded tyres 2014 - Non-studded tyres 2015 - Non-studded tyres 2016 - Non-studded tyres 2010 - Summer tyres
2011 - Summer tyres 2012 - Summer tyres 2013 - Summer tyres
28
Figure 12. The Swedish Traffic Administrations traffic regions. Adapted and modified from: Trafikverket (2015).
These figures show, on a national level, a relative stable usage of studded tyres and non-studded tyres for the last 5 years, with a clear majority using studded tyres, with exception of region south. It is also clear that while going from southern Sweden to northern Sweden the proportion of studded tyre usage increases. It should also be pointed out that due to larger population in the regions of South, West, East and Stockholm, as well as the coastal area of the regions Mid and North, most of the traffic is situated there. For Norway, the range of studded tyre usage is between 12-79% for the different regions (Statens Vegvesen, 2015) and in Finland, depending on the region, the numbers are about 76-99% (Unhola, 2016).
29
3.3. Surface course properties related to road dust and
PM
10generation
The other part affecting the road surface and tyre interaction and the emissions of PM is the surface course. With this is meant the inherent material properties as well as the mixes used, not the texture of such surfaces, which is described in chapter 3.4 Road surface texture. Unless otherwise stated, surface course or similar wordings implies bituminous mixes.
Surface courses has several characterising properties which should be considered including durability, safety and economical aspects. Heather (1998) gives some example on characteristics which could be considered when determining which surfacing to use, such as being durable to resist wear and deformations, to be economical to place and maintain and be able to provide sufficient friction among others. These characteristics of the surface course is dependent on several variables not limited to the material itself:
• The binder:
type (cement/bitumen),
modifications of the binder (e.g. Polymer Modified Bitumen, PMB),
properties of the binder (e.g. penetration, the time-temperature dependency of properties etc.) and
the amount of binder used in the mix. • The mineral aggregate:
properties of the aggregate (e.g. resistance against abrasion wear),
mix of aggregates (e.g. different shares of high quality aggregates in an aggregate mix),
largest stone size used, and