www.vti.se/publications
Ulf Hammarström Mohammad-Reza Yahya
An analysis of the Swedish HGV fleet
with driving resistance in focus –
vehicle parameters as a basis for
HBEFA emission factor estimation
VTI notat 11A–2013 Published 2013
Preface
On commission of IVL AB and Tyréns, VTI has made a study of driving resistance parameters for Heavy Goods Vehicles.1 The contact persons have been Åke Sjödin at IVL AB and Kjell Ericson at Tyréns. This project is included in an implementation program for the HBEFA model financed by the Transport Administration. The contact at the Transport Administration has been Håkan Johansson.
Ulf Hammarström
Projektledare
1
Two projects: ”Förbättrade fordonsparametrar och körmotstånd för tunga fordon 40-60 ton” (dnr: 2008/0543-24) and ” Svenska insatser inom ERMES - samarbete 2012 - SERMES -2012” (dnr:
Kvalitetsgranskning
Peer review har genomförts i december 2012 av Annelie Carlson, VTI. Ulf
Hammarström har genomfört justeringar av slutligt rapportmanus. Projektledarens närmaste chef, Maud Göthe-Lundgren, VTI, har därefter granskat och godkänt publikationen för publicering 18 april 2013.
Quality review
Peer review was performed in December 2012 by Annelie Carlson. Ulf Hammarström has made alterations to the final manuscript of the report. The research director Maud Göthe-Lundgren, VTI, examined and approved the report for publication on18 April 2013.
Table of content
Summary ... 5 Sammanfattning ... 7 1 Introduction ... 9 2 Objective ... 15 3 Method ... 16 3.1 Introduction ... 16 3.2 Survey data ... 193.3 The national vehicle register ... 21
3.4 Estimation of vehicle parameters, on the road averages, when survey data is not available ... 22
3.5 Analysis of results ... 24
4 Statistics, survey data and vehicle register data ... 25
4.1 Survey data ... 25
4.2 Vehicle register data (HBEFA segment level 1) ... 39
5 On the road vehicle parameter values ... 67
6 PHEM/HBEFA vehicle parameters compared to Swedish parameters .. 70
6.1 PHEM/HBEFA vehicle parameters ... 70
6.2 Swedish fleet data compared to PHEM/HBEFA conditions ... 72
7 Discussion ... 85
8 Conclusions ... 96
List of references ... 100
Appendices
Appendix 1 Survey data 1997 (excl. tractor) Appendix 2 Survey data 2003 (excl. tractor)
Appendix 3 Rigid truck (excl. tractor) data in national vehicle register at the end of 1997
Appendix 4 Rigid truck data (excl. tractor) in vehicle register at the end of 2004
Appendix 5 Rigid truck data (excl. tractor) in vehicle register at the end of 2009
Appendix 6 Engine power correction factors from road average (segment level 1) to vehicle combinations (segment level 2)
An analysis of the Swedish HGV fleet with driving resistance in focus – vehicle parameters as a basis for HBEFA emission factor estimation
by Ulf Hammarström and Mohammad Reza-Yahaya VTI (National Road and Transport Research Institute) SE-581 95 Linköping, Sweden
Summary
In order to estimate energy use and exhaust emissions from road traffic, on a regional or a national level, one needs representative emission factors. Emission factors are
estimated based on vehicle driving resistance. Driving resistance is estimated based on representative driving patterns and vehicle parameters.
In the HBEFA program, used for estimation of road traffic exhaust emissions, the vehicle fleet is divided into vehicle categories. One such category is Heavy Goods Vehicles (HGV). The HGV category is divided into vehicle segments after maximum vehicle weight (GVW). One further division is into vehicle combinations, a rigid truck (RT) or a truck with trailer (TT). Vehicle segments are divided into Euro classes approximately corresponding to year model intervals. For each segment and Euro class there is a set of emission factors. Then there is need for vehicle parameters per vehicle segment and Euro class. HGV emission factors on the Euro class level are treated as independent of calculation year. Emission factors for HGV vehicles in HBEFA are calculated by means of the PHEM computer program. The PHEM simulations are based on driving resistance estimation.
In order to estimate vehicle parameters, data available in the Swedish national vehicle register (1997, 2004 and 2009) and in transport surveys (1997 and 2003) has been compiled. Survey data including mileage is necessary in order to estimate vehicle parameters for average road conditions. The split into RT and TT segments demands access to mileage data describing the use of trailer.
The total number of HGV in the Swedish vehicle fleet is approximately the same 2010 as 1990. Despite this there are most important changes within the HGV fleet in this time period, such as the proportion of trucks with GVW>26t has increased from 6 to 36 per cent. In this group there are some segments with very large changes of proportion. In parallel to an important change in the segment distribution one could expect a change in distribution also inside individual segments and Euro classes by time influencing the average vehicle parameters and finally the emission factors.
The used method in PHEM/HBEFA to assign GVW can be questioned. An alternative would be to use the declared technical GVW from the register without any adjustment for the road legal load limit. The effect of the legal road limit will then instead be expressed by the load factor. The used method in PHEM/HBEFA is most complex to use and will lead to an increased risk of errors both for emission factor estimation by PHEM and for the HBEFA user when preparing fleet and traffic activity data. One basic idea behind HBEFA is that similar conditions in the geographical area
between the HBEFA countries. There need to be criteria for the size of acceptable deviations still using the same emission factors.
In this report on the road vehicle parameters has been compiled for 1997, 2003 and 2009. The data primarily includes engine power, empty vehicle weight and max load. Additional parameters presented for the truck: the length; the width and the number of axles. The distribution on type of vehicle body is also included.
In general for all vehicle segments from Euro 0 to Euro 5: the engine power increases, the GVW increases, the empty weight increases and the max load decreases. For individual Euro classes per segment there are considerable changes in parameter values by time. A decrease in max load in parallel to increasing empty vehicle weight is not expected to be energy efficient.
The current form of PHEM/HBEFA vehicle parameters is most simplified. To what extent such simplifications are useful in total is not quite obvious. There is for example a Swedish demand for representative emission factors in individual segments and Euro classes for different applications which probably not is fulfilled.
The present PHEM/HBEFA vehicle parameters are based on statistics from just a few countries. Swedish data has so far not been used for PHEM/HBEFA vehicle parameter estimation.
The largest deviations of Swedish values from PHEM/HBEFA are for engine power: - at least 10 per cent deviation: 59 per cent of all cells
- at least 20 per cent deviation: 21 per cent of all cells
Furthermore the Swedish estimated vehicle parameters in average compared to
PHEM/HBEFA show that: engine power and empty vehicle weight is larger while max load is smaller. The Swedish engine power relative increase by Euroclass is almost twice as big as the PHEM/HBEFA increase. In average HBEFA emission factors are expected to underestimate Swedish conditions. The underestimation increases by Euroclass. If also the underestimation of air resistance is included, demonstrated in a parallel study, the total underestimation may be considerable.
There will always be deviations between national vehicle parameters and common average parameters used for the emission factors in HBEFA. There are different possibilities to handle these problems:
• to reduce the segment GVW width i.e. increasing the number of segments • to add an adjustment possibility into HBEFA
• to use national sets of emission factors.
Much of the vehicle parameter data for emission factor estimation is available to a relative low cost compared to the other type of data used. This is because the data is available in existing registers i.e. there is no need for measurements. The representa-tiveness of estimated emission factors will not be higher than the most deficient part of input data. It is questionable if the distribution of available HBEFA resources for emission factor estimation used so far is optimal.
En analys av den svenska fordonsparken av tunga lastbilar - fordonsparametrar som underlag för uppskattning av emissionsfaktorer i HBEFA-modellen
av Ulf Hammarström och Mohammad Reza-Yahaya VTI
581 95 Linköping
Sammanfattning
För att kunna uppskatta energianvändning och avgasutsläpp för vägtrafik på en regional eller nationell nivå krävs representativa emissionsfaktorer. Emissionsfaktorer kan uppskattas baserat på färdmotstånd. Färdmotstånd kan i sin tur uppskattas baserat på körmönster och fordonsparametrar. För uppskattning av fordonsparametrar krävs tillgång till fordonsdata.
I datorprogrammet HBEFA, vilket används för uppskattning av vägtrafikens
avgasutsläpp, indelas fordonsparken i kategorier. En sådan kategori är tunga lastbilar (HGV). Varje sådan kategori indelas i segment efter totalvikt (GVW).
Fordons-segmenten indelas i Euroklasser vilka motsvarar klasser av årsmodeller. En ytterligare indelning är i lastbilar utan (RT) och med släp (TT). Därmed finns behov av fordons-data per segment och Euroklass (cell). För varje segment och Euroklass finns en uppsättning med emissionsfaktorer. Emissionsfaktorer per Euroklass för HGV
behandlas som varande oberoende av beräkningsår. Emissionsfaktorerna i HBEFA har beräknats med datorprogrammet PHEM. PHEM-beräkningarna baseras på uppskattning av färdmotstånd.
Denna studie har avgränsats till fordonsdata tillgängliga i det svenska fordonsregistret (1997, 2004 och 2009) och till enkätbaserade transportundersökningar (1997 och 2003). Enkätundersökningar inklusive uppgifter om körsträckor och släpanvändning är
nödvändiga för uppskattning av representative RT- och TT-parametrar på väg. Det totala antalet HGV är ungefär lika 2010 som 1990. Däremot har det skett mycket betydande förändringar av storleksfördelning under denna tidsperiod, andelen lastbilar med totalvikt (GVW) >26t har ökat från 6 till 36 procent. Inom denna grupp finns segment med mycket extrema relativa förändringar under tidsperioden. Parallellt med stora förändringar av fördelningen av HGV på segment är det rimligt att anta att det också med tiden skett betydande förändringar av fördelningen inom enskilda segment och Euroklasser, vilket påverkar fordonsparametrarna och därmed emissionsfaktorerna. Den metod som används i PHEM/HBEFA för tilldelning av GVW kan ifrågasättas. Ett alternativ är att i stället använda den deklarerade totalvikten i fordonsregistret utan vidare justering av maximalt tillåten bruttovikt på väg. Inverkan av
bruttovikts-bestämmelserna kommer i stället till uttryck genom lastfaktorerna. Den hittills använda metoden i PHEM/HBEFA bedöms vara ytterst invecklad och kan förväntas bidra till en ökad risk för fel både ifråga om att uppskatta emissionsfaktorer och att sammanställa indata till HBEFA avseende fordonsparken och trafikaktiviteter.
Representativa parametrar för fordon på väg bör i största möjliga utsträckning baseras på viktning med körsträcka per fordon för skattning av representativa parametervärden på väg. En beskrivning av fordon med och utan släp förutsätter att viktning görs med
emissionsfaktorer. Samma emissionsfaktorer förutsätter samma fordonsparametrar. Man kan alltid förvänta att det skall finnas skillnader i parametervärden mellan olika länder och därmed också i emissionsfaktorer. Vad som behövs är kriterier för hur stora dessa skillnader kan få vara för att använda samma emissionsfaktorer.
I detta dokument har fordonsparametrar av betydelse för färdmotstånd och emissionsfaktorer sammanställts primärt för 1997, 2003 och 2009. I första hand redovisas: motoreffekt; tjänstevikt; maxlast och GVW. Därutöver redovisas för bilen: längd; bredd och axelantal. Även fördelning på påbyggnadstyp ingår i redovisningen. I genomsnitt för alla segment gäller, då man går från Euro 0 till Euro 5: att
motoreffekten ökar; att GVW avtar; att tjänstevikten ökar och att maxlasten avtar. För enskilda Euroklasser gäller att det finns betydande förändringar av parametervärden med tiden till skillnad från HBEFAs förutsättningar.
En minskande maxlast parallellt med ökande tjänstevikt är en utveckling i riktning mot lägre energieffektivitet.
Den aktuella formen på fordonsparametrar till PHEM/HBEFA – endast motoreffekt och luftmotstånd varierar med Euroklass - är ytterst förenklad. Den totala nyttan med denna förenkling kan ifrågasättas. Till exempel finns det ett svenskt behov av representativa emissionsfaktorer både per segment och per Euroklass i olika tillämpningar. Detta behov kan sannolikt inte tillfredställas generellt med nuvarande beskrivning.
De nuvarande PHEM/HBEFA-parametrarna baseras på statistik från ett fåtal länder. Svenska data har hittills inte använts. De största avvikelserna av svenska
parametervärden från PHEM/HBEFA-värden gäller för motoreffekt: • minst 10 procent avvikelse: 59 procent av alla celler
• minst 20 procent avvikelse: 21 procent av alla celler.
De svenska värdena på motoreffekt och tomvikt är i genomsnitt större än PHEM/HBEFA-värdena medan maxlast är mindre. Den relativa ökningen av motoreffekt med Euroklass är nästan dubbelt så stor för svenska data som för PHEM/HBEFA. Dessa avvikelser kan förväntas motsvara att emissionsfaktorerna i HBEFA underskattar svenska värden. Denna underskattning förväntas öka med Euroklass. Om även underskattningen i luftmotstånd, påvisad i en parallell studie, beaktas kan den totala underskattningen förväntas vara betydande.
Det kommer alltid att finnas avvikelser mellan nationella fordonsparametrar och gemensamma parametrar använda för HBEFAs emissionsfaktorer. Olika alternativ för problemhantering:
• att minska GVW intervallet per segment dvs. flera segment • att komplettera HBEFA med korrektionsmöjlighet för avvikelse • att beräkna och använda nationella uppsättningar av emissionsfaktorer.
Data för uppskattning av fordonsparametrar finns i stor utsträckning tillgängliga till en relativt sett låg kostnad jämfört med övriga emissionsfaktorunderlag. Detta är en följd av att det inte krävs mätningar, data finns tillgängliga i existerande register.
Representativiteten hos uppskattade emissionsfaktorer kan inte bli högre än den lägsta representativiteten hos de olika indatagrupperna (avgasbildning, körmönster och fordonsparametrar). Det kan ifrågasättas om den hittills valda fördelningen av tillgängliga HBEFA-resurser på de olika indatagrupperna är optimal.
1
Introduction
In order to estimate representative road emission factors there is a demand to use representative driving resistance. Representative driving resistance demands access to both representative driving patterns and representative vehicle parameters. If both of these conditions are not met one cannot expect estimated emission factors to be
representative. There are two alternatives for emission factor estimations: measurements or simulation by means of computer programs. Measurements also include two
alternatives: on the road or on the chassis dynamometer. The most common
measurement alternative so far is chassis dynamometer. Both simulation and chassis dynamometer demand the use of representative driving resistance information. Emission factors in the HBEFA program (Keller and Kljun, 2007) for heavy vehicles are estimated by use of a vehicle simulation program called PHEM (Rexeis, 2005). The PHEM simulations are based on driving resistance estimations. Driving resistance at least includes:
• rolling resistance
• wheel bearing resistance • air resistance
• gradient forces • acceleration forces.
Driving resistance is a function of driving patterns, road conditions, weather conditions and vehicle parameters. The vehicle parameters include at least:
• vehicle masses • vehicle dimensions • vehicle type of body.
The total driving resistance in a simplified form:
Fx= m*g*Cr+ m*g*sin(gr)+(m+ma)*dv/dt+Cd*A*dnsl*v2/2
Fx: driving resistance (N) m=me +lf*mxl
m: vehicle actual mass (kg) g: ground acceleration (m/s2)
me: vehicle empty weight (kg)
mxl: vehicle max load (kg) lf: load factor
ma: acceleration mass from wheel moment of inertia (kg)
A: vehicle cross section (m2)
dnsl: air density (kg/m3)
v: vehicle speed (m/s)
As can be seen in the function, three of the four terms in Fx are proportional to vehicle mass, underlining the importance of representative vehicle mass parameters.
The air resistance is a function of A and Cd. In order to estimate A one needs the width and the height of the vehicle. Cd is estimated based on the distribution on type of vehicle bodies.
One further parameter of great importance for emission factors is the engine power For heavy goods vehicles (HGV) a decrease in max power of 1 % at the same vehicle weight will reduce fuel consumption (FC) by approximately 0.5 % (Hammarström, 1986).. The engine power or the engine size also represents a form of driving resistance. The engine internal friction is expected to increase with increasing engine size or max power. The increase of engine power will also, for a constant speed demand, increase average speed on a road including gradients, horizontal curves, junctions etc. Increased average speed will then at least increase the air resistance. A reasonable hypothesis could be that the increased engine power is an expression of increasing speed demand. However, there is no available information about speed demand as a function of engine power for HGV.
The parameters of interest for simulation of driving resistance and finally of emission factors should be representative for vehicles on the road network i.e. mileage weighted estimations.
In order to estimate parameter values on the road network, vehicle use data including use of trailer, is also needed.
The structure of HBEFA on the top level includes vehicle categories. One such vehicle category is HGV. Each category is split into segments and into emission concepts. An HGV segment represents type of truck, rigid or tractor, and a gross vehicle weight (GVW) class. There are two levels of HGV segments:
• level 1: trucks/tractors without regard of trailer use
• level 2: vehicle combinations including both with and without trailer.
An emission concept will roughly correspond to a year model interval with unchanged emission regulations2:
• Euro 0: year model - 1992 • Euro 1: year model 1993 - 1995 • Euro 2: year model 1996 - 2000 • Euro 3: year model 2001 - 2006 • Euro 4: year model 2007 – 2008 • Euro 5: year model 2009-
2 For each class there is a date with mandatory use of the emission class, but there also is a successive
introduction of each class. The main principle has been to use the year model when at least 50% of the year model has specified emission class. For Euro 5 this principle is not followed completely.
In order to calculate HBEFA emission factors there is need for average vehicle parameters per cell: one segment, level 2, and one emission concept. On level 2 and truck with trailer there is no distinction in HBEFA between emission factors for truck (TT) and tractor (AT) per weight segment.
The need of additional vehicle data for HBEFA simulations especially concerns the HGV segments 40-50 t and 50-60 t. These vehicle segments are of special interest for the Nordic countries but of minor interest for the rest of EU countries because of gross vehicle weight restrictions. If estimated emission factors will be representative for Swedish HGVs the vehicle parameters in all segments need to be representative for Swedish conditions. Then there is both an interest to compare Swedish conditions with HBEFA conditions and to supply the HBEFA improvement process with vehicle parameter data. The main objective for HBEFA should be that the model is as representative as possible for all countries being HBEFA users. For each user there should be a need to compare HBEFA conditions with the country specific conditions especially for conditions not being direct input to HBEFA calculations. Vehicle parameters on the segment level is not direct HBEFA input and should be compared with parameter values used for the emission factor estimations. The need of vehicle parameter data concerns both control of the parameters used so far and as a basis for new estimations of emission factors.
Per vehicle cell, i.e. segment and emission concept, one can expect changes in average vehicle parameters by time. Such a change will follow from changes in vehicle
parameter distributions per cell. The vehicle parameter distribution per cell depends on the population of vehicles and of vehicle use in the cell. Vehicle use includes both total mileage and use of trailer per vehicle. This is especially valid for the truck and trailer segments. One TT segment, for example TT 50-60 t, represents a distribution of trucks in five different segments (level 1). For vehicle combinations the average vehicle parameters will be a function both of the distribution of trucks from different segments and of parameter values for each such segment. One should notice that one and the same truck can appear in different segments, level 2, when using trailers of different sizes. These different types of distributions per cell will change by time and lead to a change in average parameters per cell. The main question is if these changes in average parameter values per cell by time can be judged as marginal or not. One first step is to quantify the size of these changes by time. The next step is to decide the size of “marginal”. Different accuracy demands of different HBEFA users may result in different values on “marginal”.
In HBEFA there is no function included in order to describe the change of emission factors per HGV cell by time.3 The cell values for HGV are treated as constants from year to year. In the estimation of HBEFA emission factors vehicle masses, the empty vehicle weight and the max load, are treated as constants per vehicle segment (level 2) i.e. no change between Euro classes so far, see table 6.1 and 6.2.
Since the definition of segments is based on GVW limits the width of these weight classes at the same time give limits for the max possible change of GVW per segment by time. Vehicle parameters not included in the segment definition have no such restrictions for the possible change by time. The GVW is equal to the sum of the empty vehicle and the max load weight. These parameters have then more space for changes
compared to GVW. There might also be a change in the GVW distribution on the truck and the trailer without a change in total GVW for the vehicle combination. In table 1.1 the max potential for deviation from HBEFA GVW values are presented.
Table 1.1 Max possible GVW deviation from PHEM/HBEFA conditions.*
Min (%) Max (%) Rigid truck <=7,5t -40 +29 Rigid truck >7,5-<=12t -32 +9 Rigid truck 12-14t -11 +4 Rigid truck 14-20t -19 +16 Rigid truck 20-26t -22 +2 Rigid truck 26-28t -4 +4 Rigid truck 28-32t -13 +0 Rigid truck >32t -10 +x**
truck & (semi)-trailer <28t - +56
truck & (semi)-trailer 28-34t -13 +6
truck & (semi)-trailer 34-40t -15 +1
truck & (semi)-trailer 40-50t -15 +6
truck & (semi)-trailer 50-60t -17 +0
*PHEM/HBEFA conditions in table 6.1.; **No upper limit (see section 7).
In table 1.1 one can notice that in most segments the possible deviation from PHEM/HBEFA conditions are at least 10 %.
In parallel to this work, measurements of air resistance, rolling resistance and transmission losses have been in focus in a coast down study (Hammarström et al, 2012). These studies should improve the possibility for calculations of representative HGV emission factors with PHEM, at least for Swedish conditions.
Focus in this study is on the segment level i.e. not on the distribution of the HGV fleet on segments. However, a study of the Swedish HGV fleet can also be of interest in a more general context.
The importance of different segments for energy use and exhaust emissions is expressed of the distribution. In figure 1.1 the distribution of the Swedish HGV fleet on segments from 1990 to 2030 is presented.
0 20 000 40 000 60 000 80 000 100 000 120 000 N u m b e r o f H G V 1990 2000 2010 2020 2030 Year Tractor for AT >50-60t Tractor for AT >40-50t Tractor for AT >34-40t RigidTruck >32t RigidTruck >28-32t RigidTruck >26-28t RigidTruck >20-26t RigidTruck >14-20t RigidTruck >12-14t RigidTruck 7,5-12t RigidTruck <7,5t RT petrol
Figure 1.1 The Swedish HGV fleet in traffic (31/12) per year.4
Even if the number of HGV is approximately the same 2010 as 1990, there has been a most important change in the HGV fleet during this time period. In the same period the proportion of trucks>26t has increased from 6% to 36% i.e. with a factor 6. The
individual segment proportions included in truck>26t all increases after 1990. When the proportion of trucks >26t increases the proportion of trucks<26t decreases. Besides the decrease of trucks<26t all included individual segment proportions also decreases. The proportion of tractor for AT has increased from 5% to 11% in the same period.
There are some segments with special large changes of number of vehicles from 1990 until 2010:
• 12-14t: a decrease by 50% • 20-26t; a decrease by 60% • 28-32t: an increase by 48 times • >32t: an increase by 5 times.
The change in segment distribution also represents a change in total load capacity for trucks by +18% from 1990 until 2010 and the prognosis a further increase by 32% until 2020. If one also includes the mileage dependence of vehicle size the mileage weighted capacity (tonne km) has increased further. Increased vehicle size is expected to increase trailer use. Including the trailer effect the load capacity will increase still further.
There could be an interest for vehicle frequencies in different segments at different years. The segment width is most different so it may be of interest to normalize total
number of HGV per segment to segment width. Frequencies of HGV at different years per tonne:5
• 1990:
- lowest: 28-32t, 42 - highest: 20-26t, 4033
- highest below 20t: truck 3.5-7.5t, 3870 • 2010:
- lowest: 12-14t, 899 - highest: 26-28t, 9120
- highest below 20t: truck 3.5-7.5t, 2254.
In 2010 the density, number of of HGV per tonne interval, doesn’t deviate too much with one main exception, the 26-28t interval. Thedensity of vehicles in this interval is approximately four times as high compared to the average interval. The interval 12-14t is deviating in the opposite direction with a density approximately half the density of the average interval.
One should have in mind the big importance of vehicle size or vehicle mass for the emission factors. To some extent the emission factor effect of increasing vehicle size by time is possible to reduce by means of reduced Cr and Cd. However, increased vehicle size also contributes to an increase of air resistance by an increase in cross section area (A).
The interest in road traffic exhaust emissions is both the historical change by time and a prognosis for the future. In order to calculate future exhaust emissions by means of HBEFA there is need of two groups of emission factors: for vehicle cells existing today and for future vehicle cells. At least for future cells there is need for vehicle parameters in order to calculate emission factors. There need to be a strategy for what vehicle parameters to use for the estimation of future emission factors.
5
2
Objective
The objective of this study is to present representative driving resistance vehicle
parameters for Swedish conditions – engine power, empty vehicle weight, max load and vehicle body distribution - in order to:
• compare Swedish vehicle parameter values with parameters used for HBEFA emission factor estimations
• supply vehicle parameter values for future estimation of emission factors. Estimated parameter values need to be presented after the structure used in HBEFA i.e. by segment and Euro class (cell).
One question of importance for the emission factor structure in HBEFA: will driving resistance parameters per cell change more than marginal by time? Vehicle parameter values on a cell level at different years will be presented and compared in order to estimate the parameter changes by time. In HBEFA the assumption is that the change by time of these parameter values per cell are less than marginal, expressed in the use of constant emission factors by time per cell.
In the estimation of HBEFA emission factors by the use of PHEM the empty vehicle weight and the max load per segment are treated as independent of Euro class. The change by Euro class of the empty vehicle weight and the max load per segment will be presented for Swedish conditions as a basis for judgment if there is need for an
improved degree of parameter resolution.
There is need of vehicle parameters both for the vehicle fleet until today and for the future vehicle fleet. This study is restricted for the vehicle fleet until 2009.
3
Method
3.1
Introduction
3.1.1 Overview
The need of vehicle parameter data is expressed of the HBEFA structure of emission factors. These factors are estimated by PHEM simulations. The vehicle parameters compiled in this study include vehicle weights. Vehicle weight, the gross vehicle weight (GVW), also constitutes the base for segment classification. The sum of the empty vehicle weight and the max load is equal to GVW. Then the definition of GVW used in HBEFA/PHEM is of importance.
For estimation of vehicle parameters out on the road, mileage data is needed. For HGV there also need to be data about trailer use. The relevant data then is found in transport surveys. The access to survey data in this study is limited to year 1997 and 2003. In order to also describe vehicle parameters after 2003, vehicle register data for years after 2003 has been included. By the use of a simple estimation method on the road vehicle parameters have been estimated based on register data for years without survey data.
3.1.2 HBEFA
In HBEFA the HGV vehicle category is split into two emission factor groups: segments with (AT/TT) and without (RT) trailers. There is a principal difference between the two groups:
• AT/TT: each segment represents a distribution of trucks belonging to different level 1 segments and in parallel different sizes of trailers. The sum of truck and trailer GVW belongs to the weight interval of the segment
• RT: each segment only includes trucks belonging to the specified weight interval of the segment. One subgroup is trailer trucks without connected trailer.
Each emission factor per AT/TT segment represents a distribution of tractors with semitrailers and of trucks with trailers. For each such combination, a truck/tractor in one weight segment and a trailer/semitrailer in a matching weight segment, there is a further vehicle- and a parameter distribution.
In HBEFA “vehicle transformation patterns” are used in order to describe that one weight class of truck, for example 20-26 t, can be on the road as one of two main alternatives:
• a single truck RT 20-26 t
• a vehicle combination, TT, including four alternatives of GVW >26 t and most likely for Sweden as a TT 50-60 t.
Table 4.1 and 4.2 demonstrates that a HGV TT 50-60 t could include five alternative truck GVW-classes (level 1). The vehicle parameter estimations for TT 50-60 t constitute an average of these sub segments.
If only one set of emission factors is used per cell, which is the present HBEFA alternative, the distribution in the TT 50-60 t column in table 4.1 and 4.2 must not change more than marginal by time. The important condition is both the distribution on truck segments and the average parameter values per truck segment in parallel. If the parameter distributions will change the average parameter values in total on level 2 will also change by time.
Average vehicle parameters in a segment and emission concept are expected to change by time. If these changes per cell are judged as larger than marginal there would be need for different sets of vehicle parameters for different years or some kind of correction function.
Emission factors in HBEFA are calculated for three levels of load factor: no load (0%); 50% of max and 100% of max load. The input to HBEFA is proportion of mileage with load factor 0% and 1-99% respectively. In order to estimate these distributions on load factor level there need to be a clear definition of max load.
Both vehicle empty weight and vehicle max load is a direct function of GVW class. Per segment the possible GVW change by time is limited by the segment interval limits. The wider interval per segment the bigger possibility for changes in average segment weights by time, see table 1.1. The possible relative changes of empty vehicle weight and max load are larger than for GVW.
3.1.3 Definitions of GVW
There are two types of GVW for road vehicles: a technical limit and a road max limit. The technical weight is the max weight of the vehicle included in the vehicle register. This is the weight limit used for the technical design of the vehicle including the design of brakes etc.
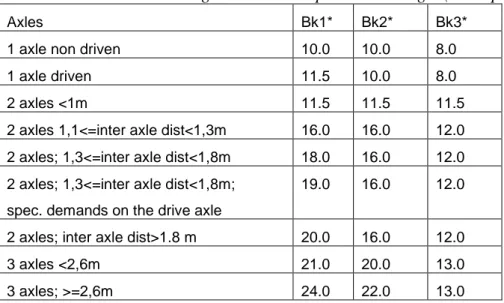
The road limit GVW is the max weight of a vehicle on the road. In table 3.1 the max allowed weight on the road per axle or bogie is presented.
Table 3.1 Max allowed weight on the road per axle or bogie (Transportstyrelsen, 2010).
Axles Bk1* Bk2* Bk3*
1 axle non driven 10.0 10.0 8.0
1 axle driven 11.5 10.0 8.0
2 axles <1m 11.5 11.5 11.5
2 axles 1,1<=inter axle dist<1,3m 16.0 16.0 12.0 2 axles; 1,3<=inter axle dist<1,8m 18.0 16.0 12.0 2 axles; 1,3<=inter axle dist<1,8m;
spec. demands on the drive axle
19.0 16.0 12.0
2 axles; inter axle dist>1.8 m 20.0 16.0 12.0
3 axles <2,6m 21.0 20.0 13.0
3 axles; >=2,6m 24.0 22.0 13.0
• max GVW for a truck with 2-axles: 18t • max GVW for a truck with 3-axles: 26t • max GVW for a truck with 4 axles: 32t
• there is a max limit weight for a vehicle equipage as a function of the distance between the first and the last equipage axle and with the upper limit 60t (distance≥ 18 m).6
In practice there are a big number of road limit GVW values as a function of all combinations of number of axles and distances between axles.
The technical GVW can be higher than the max allowed GVW on the road. If the technical GVW is higher than the max allowed GVW on the road, the road max allowed weight will be the legal limit on the road. In the opposite situation the technical GVW will be the limit value on the road.
Also for just a truck without a trailer the technical GVW in the register could be above what is allowed on Swedish roads.7
In PHEM/HBEFA the definition of GVW is based on the regulation for max vehicle weight on the road.
The assignment of PHEM/HBEFA GVW can be a complicated process if the stated method is followed literally as follows:
• Information needed: technical GVW in the front and in the rear of the truck and of the trailer; all distances between axles including the distance between the last truck axle and the first trailer axle
• Maximum weight per vehicle unit and position (front and rear): if the position technical GVW is larger than the road limit in table 3.1, use the road limit, otherwise use the technical GVW
• Maximum preliminary weight per vehicle unit
• Maximum final weight for the truck: adjust the truck GVW for max allowed GVW as a function of number of axles if needed
• Maximum final equipage GVW: adjust the equipage GVW as a function of the distance between the first and the last axle if needed
• If the technical GVW is higher than the maximum final equipage GVW let the GVW be equal to the maximum final road limit, else let the GVW be equal to the technical GVW.
•
Finally is the max load of the vehicle reduced if needed so that the sum of the empty weight and the max load is equal to the adjusted road GVW.
In PHEM/HBEFA the described method is not followed completely since there is a segment RT>32 t (above the max road limit). This segment can not based on the
PHEM/HBEFA definition include any vehicles. If the RT>32 t segment has been added
6 In special regions and on special roads there is a special regulation allowing a total weight of a truck and
trailer up to 90t and a max length up to 30 m.
7 The Swedish vehicle register also includes ”skattevikt” which for a single vehicle represents the weight
by pragmatic reasons, at least for the Nordic countries there should be an AT/TT>60 t segment added of the same reason.
Three of the road limit limit values – 26 t, 32 t and 60 t – are used as segment limits in PHEM/HBEFA but not the 18 t limit.
The GVW definition problem is especially big for tractor with semitrailer (AT), both to calculate the technical GVW and finally the PHEM/HBEFA GVW. The technical GVW is equal to the sum of the tractor empty weight and the resulting technical GVW of the semitrailer. The semitrailer resulting technical GVW is a function of: the tractor max load; the semitrailer front GVW and rear GVW. The reason for not including AT in this study has been the problem to estimate the GVW for the vehicle combination.
In the Swedish national vehicle register both types of GVW definitions are included for individual vehicles but not in the survey data. In the survey data only technical GVW is included per vehicle unit – empty vehicle weight and max load - in parallel with number of axles. The number of axles, no inter axle distance available, to some extent makes it possible to estimate the max allowed GVW on the road.
The GVW measure used so far in Swedish HBEFA calculations, the fleet and traffic activity input data, represents just the technical maximum vehicle weight. When the technical GVW is the limit value on the road Swedish input data to HBEFA calculations used so far is consistent with the HBEFA definition.
The GVW measure used in this report in order to describe Swedish vehicle parameters is the technical GVW.
In HBEFA the segment for the heaviest trucks with trailer is assigned TT 50-60 t. When the technical GVW is used this interval includes all trucks and trailer with GVW>50 t. The survey data then includes truck and trailer with a technical GVW of at least up to 70 t.
3.2
Survey data
Survey data includes some of the data asked for. One advantage with these data is they include both vehicle combinations and vehicle use i.e. estimation of average values “on the road” are possible to do (level 2). The survey (UVAV) is made on a quaterly basis since the 70ties (Trafikanalys, 2012).. The available survey data in this study are:
• survey 1997: also including “all” vehicle data and fuel consumption (Hammarström and Yahya, 2000)
• survey 2003: also including some vehicle data.
The data used is a stratified random sample restricted to transports with Swedish trucks. These data represent all heavy trucks in the vehicle register with max load >3.5 t. One should notice that the Swedish definition for a heavy truck is technical GVW>3.5 t. The GVW for max load 3.5 t is approximately equal to 7 t. Then the survey doesn’t cover all HGV, there is a part of the “smallest” segment (3.5-7.5 t) missing.
• empty vehicle weight of the truck
• empty vehicle weight of the trailer (2003 only) • max load, truck and trailer respectively
• year model of the truck (2003 only) • number of axles on the truck • number of axles on the trailer • mileage
• load including empty vehicle driving.
These data are available on a vehicle combination level (level 2).
The data from 1997, presented in Appendix 1, includes additional data from the vehicle register about the truck. These additional data were compiled in a project with fuel consumption in focus (Hammarström and Yahya, 2000).
For the trailer, 1997 data does not include the empty trailer weight, just the maximum load and number of axles. The empty trailer weight for 1997 has been estimated based on the number of axles and on the max load. The functions used for estimation of empty vehicle weight are presented in the report.
Some of the data in the vehicle register added to survey data 1997:
• engine power • type of vehicle body • year model.
Survey data for 2003, Appendix 2, includes the empty trailer weight i.e. a difference compared to 1997 data.
In Appendix 1 (1997) and 2 (2003) the total relative mileage distribution including driving both with and without trailer is presented.
There is no survey data in combination with engine power available for VTI after 1997. Instead a model for estimation of engine power on the road after 1997 is necessary to develop, see section 3.4. The model is based on vehicle register data from 1997 to 2009 in combination with survey engine data from 1997.
The 1997 survey data describes the change in engine power with the weight of the vehicle combination. The same GVW class of truck can appear in different TT segments. It is reasonable to assume that there will be different average engine power for trucks in the same truck GVW class (level 1) but in different TT segments, see table 4-6 in Appendix 1.
The survey data describes on the road average weight of vehicle combinations in different weight classes or segments. Different weight data of interest for driving resistance estimation are: empty vehicle weight; max load and actual weight (AVW). In order to estimate on the road vehicle weight values for 2009 the same principal model as for engine power is used.
Survey data not included in this study are:
• AT vehicle segments
• Swedish vehicles from domestic starting points with destinations abroad • Swedish vehicles from abroad to domestic destination points
• Swedish vehicles with both starting and ending points abroad.
HGV vehicles on Swedish roads not registered in Sweden are not included in the survey.
3.3
The national vehicle register
Estimations of vehicle parameters based on the national vehicle register are weighted based on the total numbers (frequencies) of vehicles in traffic in the register at the end of each year. In Appendix 3 (1997), Appendix 4 (2004) and Appendix 5 (2009) number weighted average values for trucks per segment and year model interval (Euro class) are presented for:
• engine power • empty weight
• gross vehicle weight (technical) • length
• width
• number of axles.
In addition the number of vehicles is presented. The technical max load is equal to the difference between the technical GVW and the empty vehicle weight.
The Swedish national vehicle register includes most vehicle data needed for PHEM-simulations. One drawback is that only separate data for trucks and for trailers are available i.e. no information about vehicle combinations, which is needed in HBEFA applications. One exception to this statement is that the vehicle register per truck includes the max allowed weight of a vehicle combination including the register truck. The vehicle register also includes data about mileage for trucks, observations at vehicle inspections, but no information about trailer use. Even if the vehicle register not gives the level 2 segment averages, level 1 average might be of some interest.
From the vehicle register it is possible to calculate both number and mileage weighted average values per “segment” (level 1) and emission concept. However, in HBEFA the interest is in level 2 segments. In this study mileage has not been available in vehicle register data
One type of interesting data missing in the register needed for estimation of air resistance is vehicle height. For each type of vehicle body the height needs to be
estimate the cross section of the vehicle (A). The cross section is used for the calculation of air resistance. In this study there is no estimation of vehicle height.
3.4
Estimation of vehicle parameters, on the road averages,
when survey data is not available
There is no data available giving direct mileage weighted (on the road) estimations after 2003, and for engine power after 1997. On the road estimations per year model interval for the missing years can be based on:
• the relation between mileage weighted and number of vehicle weighted
estimations the last year with both types of data available per truck GVW class (segment level 1)
• the relation betweenmileage weighted estimates for level 2 GVW classes including a split on size of truck (Appendix 6), with and without trailer, and the mileage weighted estimate on segment level 1
• the estimated number weighted average parameters per truck GVW class (segment level 1) for different years with such data available
• the mileage distribution on truck GVW classes per TT segment in the latest available survey data
• the estimated mileage distributions on truck GVW classes per TT segment for 2009 based on 2003 mileage distributions and vehicle register number
distributions in 2003 and 2009.
In table 3.2 the ratio in 1997 between mileage weighted engine power averages and number weighted averages on segment level 1 are presented.
Table 3.2 (Mileage weighted average power UVAV 1997)/(Number weighted average power 1997). Truck GVW* Year model -1992 1993-1995 1996-1997 7.5-12 t 1.036 1.053 1.027 12-14 t 1.023 1.025 0.998 14-20 t 1.016 1.049 1.033 20-26 t 1.050 1.053 1.054 26-28 t 1.068 1.048 1.046 28-32 t 1.022 1.022 1.030 >32 t 1.008 1.198 1.122 *Segment level 1
From table 3.2 one can see that the mileage weight gives higher estimations than the number weighted in general (ratio>1). Corresponding values are available also for empty vehicle weight and for max load.
In order to estimate engine power per weight class (level 1) out on the road for a truck 2003 and 2009, the values in table 3.2 can be used in combination with vehicle register data for these two years. Engine power in the vehicle register per GVW and year model interval is multiplied by the values in table 3.2 as follows:
• year models in the interval -1992 by the correction factors for this interval in table 3.2
• year models in the interval 1993-1995 by the correction factors for this interval in table 3.2
• year models after 1997 have been multiplied by the values for 1996-1997 (An alternative could have been to select correction factors based on vehicle age instead of year model)
The next step is to estimate engine power for vehicles per truck GVW interval and per segment level 2 GVW class. For each such class correction factors have been estimated per year model interval based on UVAV 1997, see examples for engine power in Appendix 6.
By multiplying values estimated by use of the factors in table 3.2 by the values in Appendix 6 on the road values are estimated for different sub segments. For each TT segment there are several sub segments which finally need to be weighted together. In order to finally estimate average data per TT-segment one needs mileage per truck GVW class in the TT segment. Mileage distribution on GVW classes per year model interval is available in the 1997 and 2003 survey data, see Appendix 1 and 2. Such distributions for 2009 have been estimated based on the 2003 mileage distributions and number distributions for 2004 and 2009. The sub problem, survey 2003 and register 2004, has been treated in that way year models until 2003 only have been included in the 2004 register data set in this application. The vehicle register data is from 2004. In order to get 2003 values:
• assume the number of vehicles in year model intervals older than 2001 are unchanged between 2003 and 2004
• assume that the group of year models 2001-2003 is the same 2003 and 2004. The described on the road estimation model has been used in order to estimate: engine power 2003 and 2009; empty vehicle weight 2009 and max load 2009.
The method used has some shortcomings. One such type of shortcoming is the correction factors: from number weighting to mileage weighting and from level 1 to level 2. The estimation of vehicle weights 2009 is based on the assumption that the relative change in the weight of a truck with trailer will be the same as the relative change in weight of just the truck.
In the proposal of vehicle parameters for different segments in section 5 GVW 3.5-7.5 t is included based on estimation. This estimation is based on the assumption that one can use the same “on the road factor”, number weighting to mileage weighting, as for GVW 7.5-12 t.
3.5
Analysis of results
In this study vehicle parameters per vehicle segment and year model interval or emission class is of main interest. This means that the total weighted averages for the HGV fleet not is of interest. However, it should be of higher importance to put more efforts on segments which represents a bigger part of the vehicle fleet compared to a smaller.
The analysis has also been complicated by the use of two statistic data sets. Both sets can be compared on HBEFA level 1 directly but not on level 2 (level 2 includes combinations of truck and trailer). When comparing average values from each data set one should also have in mind that the survey GVW 3.5-7.5 t segment is incomplete and cannot be compared with register data or HBEFA values. This segment, 3.5-7.5 t, has been excluded in the presentation of survey data in section 4.1 but is included in section 5 based on the estimation method described in section 3.4.
The survey data is based on a stratified survey method. The design of the survey is based on a target for acceptable accuracy in transport measures. These measures relate to a special subdivision of HGV and to special categories of goods transported. When using the survey design to estimate other measures like vehicle parameters there is no direct information about the level of accuracy. When this data set is used to estimate parameters other than what it is designed for the original accuracy will not longer apply. The potential deviations in estimated parameter values from the true values will reduce the possibility to judge if “changes” are expressions for deficiencies in the method used or for true changes. This type of problem does not exist for register data since this is the total population.
In the analysis of Swedish parameter values compared to PHEM/HBEFA values in section 6 average values for a group of segments or for cells are presented in the documentation. These average values are not weighted i.e. each segment or cell has the same weight “1” in the estimation of average values. The reason for including these average values is primarily to view general trends by year model interval (Euro class) and be able to make more general comparisons between the two sets of parameters. When the words “decrease” or “increase” are used a sign is added, “-“for decrease and “+” for increase. This can be judged as unnecessary but is motivated since the word “change” also is used. In this case a sign must be used.
Changes have been described as “largest”. In these cases “largest” refers to the absolute value of the change.
4
Statistics, survey data and vehicle register data
The presentation of data is divided according to the main data sources: on the road data (survey data) and national vehicle register data.
The structure of the presentation per data set is as follows when possible:
• fleet distribution on segments • engine power
• empty vehicle weight • max load
• gross vehicle weight (GVW) • vehicle body distribution.
For each type of parameter per segment and year model interval the following is presented when possible:
• change for new vehicles (latest year model interval) per segment from 1997 • change between year model intervals per segment at the latest year with data • change of cell values by time
• Euro 3 levels per segment and relative change between emission concepts (the HBEFA form), register data only.
For the survey data both segment level 1 and 2 are presented in some cases and for register data just level 1, which is the only possibility.
4.1
Survey data
4.1.1 Mileage distributions
The importance for total road traffic exhaust emissions of vehicle parameters is a function of the mileage proportion on segments. In table 4.1 and 4.2 the proportions on segments, both level 1 and level 2, are presented for 1997 and 2003.
Table 4.1 Total HGV mileage distribution (%) in 1997.*
Truck GVW Without trailer With trailer Total <= 20 t 20-28 t 28-34 t 34-40 t 40-50 t 50-60 t level 1 7.5-12 t 5.2 0.1 0.0 0.0 0.0 0.0 0.0 5.2 12-14 t 3.3 0.0 0.1 0.0 0.0 0.0 0.0 3.4 14-20 t 12.1 0.0 0.1 0.2 0.2 0.8 0.2 13.6 20-26 t 13.6 0.0 0.0 0.1 0.7 3.0 22.5 39.9 26-28 t 4.7 0.0 0.0 0.0 0.0 1.3 22.2 28.1 28-32 t 0.9 0.0 0.0 0.0 0.0 0.1 7.7 8.6 >32 t 0.6 0.0 0.0 0.0 0.0 0.0 0.5 1.1
Table 4.2 Total HGV mileage distribution (%) in 2003.*
Truck GVW
Without trailer
With trailer Total
<= 20 t 20-28 t 28-34 t 34-40 t 40-50 t 50-60 t level 1 7.5-12 t 4.9 0.0 0.0 0.0 0.0 0.0 0.0 4.9 12-14 t 1.4 0.0 0.0 0.0 0.0 0.0 0.0 1.4 14-20 t 10.0 0.0 0.0 0.1 0.5 0.9 0.5 12.1 20-26 t 8.5 0.0 0.0 0.0 0.1 1.7 15.6 26.0 26-28 t 7.0 0.0 0.0 0.0 0.1 1.6 28.5 37.2 28-32 t 2.1 0.0 0.0 0.0 0.0 0.3 14.3 16.7 >32 t 0.7 0.0 0.0 0.0 0.0 0.0 1.0 1.7 Total 34.7 0.0 0.1 0.1 0.7 4.5 59.9 100.0
*Max load>3.5t and excluding GVW3.5-7.5t.
The segment level 1 distribution is presented beneath the headline “Total level 1” and on segment level 2 beneath “without trailer” vertical and “with trailer” at the bottom line.
Comments to table 4.1 and 4.2 on segment level 1:
• The total proportion of truck GVW<26t decreases from 62% to 44% from 1997 to 2003
• All individual truck segments with GVW<26t decrease in proportion from 1997 to 2003
• The four largest proportions of trucks 2003 in order after size of proportion: 26-28 t; 20-26 t; 26-28-32 t and 14-20 t
• The two largest truck proportion changes from 1997 to 2003: segment “20-26 t”, from 39.9 to 26.0%, and segment “26-28 t”, from 28.1 to 37.2%
• The use of trailer increases with truck GVW up to 28-32 t, 88% in 2003, and then decreases
• There is approximately no use of trailer for truck GVW<14 t and a minor use for truck GVW 14-20 t, 17% in 2003.
Comments to table 4.1 and 4.2 on segment level 2:
• The proportion of TT increases from 59.8% to 65.3% from 1997 to 2003
• The largest proportion on level 2 is segment “TT 50-60 t” for both years, 53.1% and 59.9%
• The four largest segment proportions 2003 after size of proportion: TT 50-60 t; RT 14-20 t; RT 20-26 t and RT 26-28 t.
Table 4.1 and 4.2 also describes the distribution on truck sizes per TT segment. For the 50-60t there is a most apparent change to a larger proportion of trucks >26t from 1997 to 2003.
Table 4.1 and 4.2 represents distribution of mileage for the “total” HGV fleet. In Appendix 1 and 2 corresponding distributions are presented per year model interval. In table 4.3 mileage distributions on segments (level 2) per year model interval in 2003 are presented.
Table 4.3 Mileage distribution (%) per year model interval (level 2) in 2003.*
Segment -1992 1993-1995 1996-2000 2001-2003 RT 7.5-12 t 6.9 3.9 4.1 5.8 12-14 t 5.9 1.7 0.9 0.3 14-20 t 24.1 13.8 7.0 8.2 20-26 t 23.2 12.7 7.1 3.2 26-28 t 7.3 9.5 7.0 6.4 28-32 t 0.3 1.1 2.0 3.2 >32 t 2.2 0.6 0.4 0.5 TT TT<= 20 t 0.0 0.0 0.0 0.0 TT 20-28 t 0.0 0.2 0.0 0.1 TT 28-34 t 0.0 0.0 0.1 0.3 TT 34-40 t 1.0 0.5 0.7 0.6 TT 40-50 t 5.1 6.1 5.2 2.6 TT 50-60 t 23.8 49.9 65.6 68.5 Total 100.0 100.0 100.0 99.9
* Max load>3.5t and excluding GVW3.5-7.5t.
The proportion of TT mileage increases from 30% up to 73% when the vehicle age decreases from year models -1992 to 2001-2003. The overall trailer proportion in 2003 is 65% and the proportion of TT 50-60 t is 60%.
The TT 50-60 t segment has up to 95 % (2001-2003) of the truck and trailer mileage in 2003.
The segments RT 14-20 t and TT 50-60 t are judged to be the most important segments in 2003. The proportions of RT 14-20 t and RT 20-26 t are most equal up to year model interval 1996-2000 but not for 2001-2003. For this last interval 14-20 t has the largest proportion in the RT group.
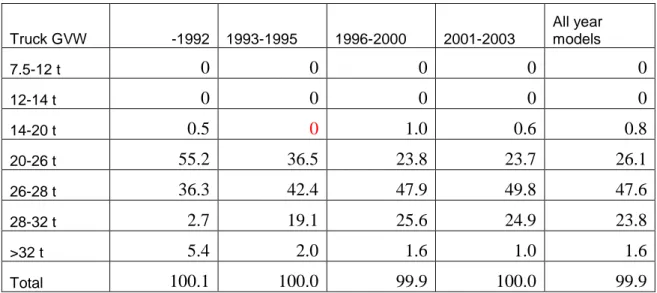
One complication in HBEFA/PHEM applications is that each TT segment includes a distribution on different truck and trailer sizes, see example in table 4.4. Each truck
Table 4.4 Mileage distribution (%) on truck sizes and year model interval for TT 50-60 t in 2003. Truck GVW -1992 1993-1995 1996-2000 2001-2003 All year models 7.5-12 t 0 0 0 0 0 12-14 t 0 0 0 0 0 14-20 t 0.5 0 1.0 0.6 0.8 20-26 t 55.2 36.5 23.8 23.7 26.1 26-28 t 36.3 42.4 47.9 49.8 47.6 28-32 t 2.7 19.1 25.6 24.9 23.8 >32 t 5.4 2.0 1.6 1.0 1.6 Total 100.1 100.0 99.9 100.0 99.9
Approximately half of the mileage with 50-60t belongs to 26-28t trucks in 2003. The median for the TT 50-60 t GVW distribution moves in direction to more heavy trucks with decreasing vehicle age. For the year model intervalsin table 4.4 there are in general five truck segments included.
4.1.2 Engine power:
Engine power, a mileage weighted average, per segment (HBEFA level 1) and year model interval is presented in table 4.5.
Table 4.5 Engine power (kW) per segment (level 1) and year model interval in 1997.*
Truck GVW -1992 1993-1995 1996-1997 Total* 7.5-12 t 112 141 140 118 12-14 t 144 154 157 145 14-20 t 173 198 195 179 20-26 t 267 307 301 277 26-28 t 311 317 321 315 28-32 t 308 338 348 339 >32 t 294 376 353 304
* Max load>3.5t and excluding GVW3.5-7.5t; Mileage weighted total average per GVW interval.
Table 4.6 Engine power (kW) per segment (level 2) and year model interval in 1997.* Segment -1992 1993-1995 1996-1997 RT 7.5-12 t 112 141 140 12-14 t 145 154 157 14-20 t 168 183 178 20-26 t 234 256 238 26-28 t 267 265 264 28-32 t 298 311 322 >32 t 289 279 362 TT 20-28 t 165 28-34 t 203 209 282 34-40 t 249 299 239 40-50 t 264 285 286 50-60 t 307 327 334
* Max load>3.5t and excluding GVW3.5-7.5t.
Comments to table 4.6 about changes from year model interval-1992 to 1996-1997:
• The engine power in average increases by time at least until 1993-1995 and then approximately is constant to the next year model interval
• The average change of segment values in total, +9% (excl. TT 20-28 t and TT 28-34 t)
• The largest relative change per segment: +25% RT 7.5-12 t and RT>32 t • The engine power in segment RT 14-20 t and TT 50-60 t increases by +6% and
by +9%.
0 50 100 150 200 250 300 350 400 RT 14-20 t TT>50 t kW -1992 1993-1995 1996-1997
Figure 4.1 Engine power per segment and year model interval in 1997.
The TT 50-60 t segment includes a number of sub segments. The engine power in these sub segments in the year model interval 1996-1997 is:
• truck 14-20 t: 250 kW • truck 20-26 t: 323 kW • truck 26-28 t: 335 kW • truck 28-32 t: 351 kW • truck>32 t: 351 kW.
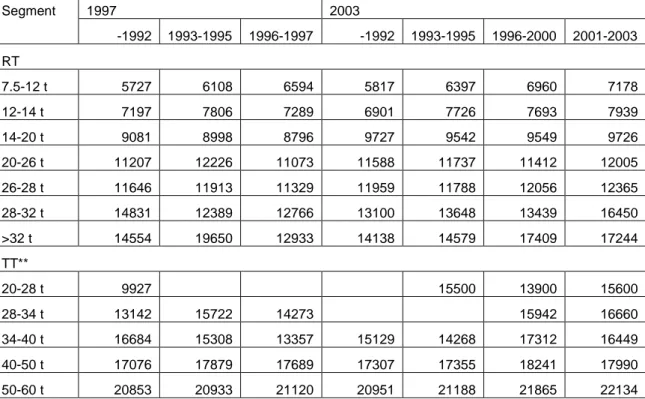
4.1.3 Vehicle empty weight
Table 4.7 Vehicle empty weight (kg) per vehicle segment (level 2) and year model interval in year 1997 and 2003.*
Segment 1997 2003 -1992 1993-1995 1996-1997 -1992 1993-1995 1996-2000 2001-2003 RT 7.5-12 t 5727 6108 6594 5817 6397 6960 7178 12-14 t 7197 7806 7289 6901 7726 7693 7939 14-20 t 9081 8998 8796 9727 9542 9549 9726 20-26 t 11207 12226 11073 11588 11737 11412 12005 26-28 t 11646 11913 11329 11959 11788 12056 12365 28-32 t 14831 12389 12766 13100 13648 13439 16450 >32 t 14554 19650 12933 14138 14579 17409 17244 TT** 20-28 t 9927 15500 13900 15600 28-34 t 13142 15722 14273 15942 16660 34-40 t 16684 15308 13357 15129 14268 17312 16449 40-50 t 17076 17879 17689 17307 17355 18241 17990 50-60 t 20853 20933 21120 20951 21188 21865 22134
* Max load>3.5t and excluding GVW3.5-7.5t;**The trailer empty weight in 1997 is estimated based on number of axles and max load.
In 2003 there is a total average increase in empty vehicle weight by 11% from year model interval -1992 to 2001-2003. For the more important segments the increase is smaller compared to the total average: RT 14-20 t has approximately no change and TT 50-60 t has an increase by +6%. There are small increases, +4% and +3%, for RT 20-26 t and 26-28 t. The largest change on a segment level from -1992 to 2001-2001 is 26%, RT 28-32 t.
Changes on a cell level from year 1997 until 2003:
• in general, an average for all segments, there is approximately a change of +2.6%
• the largest changes: -25.8% RT>32 t 1993-1995; +34.6% RT>32 t 1996-1997
• in the cells GVW 14-20 t -1992, 1993-1995 and 1996-1997 the cell values change by: +7.1%; +6% and +8.6%
• in the cells TT 50-60 t -1992, 1993-1995 and 1996-1997 the cell values change by: +0.5%, +1.2% and +3.5%.
The changes of cell values in year model interval “1996-1997” from year 1997 until 2003 include to some extent the addition of the year model intervals 1998-2000.
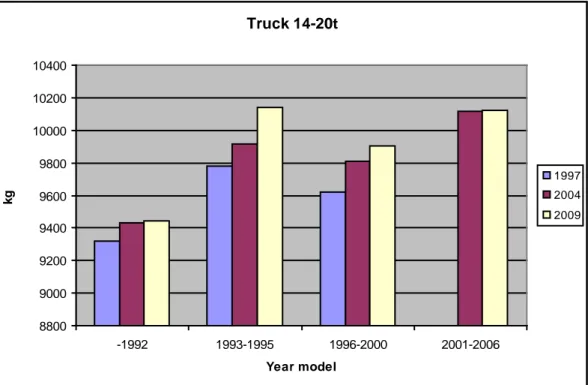
In figure 4.2 empty vehicle weights are presented for two segments and four year model intervals. 0 5000 10000 15000 20000 25000 RT 14-20t TT>50t kg -1992 1993-1995 1996-2000 2001-2003
Figure 4.2 Empty vehicle weight variations between year model intervals per segment in 2003.
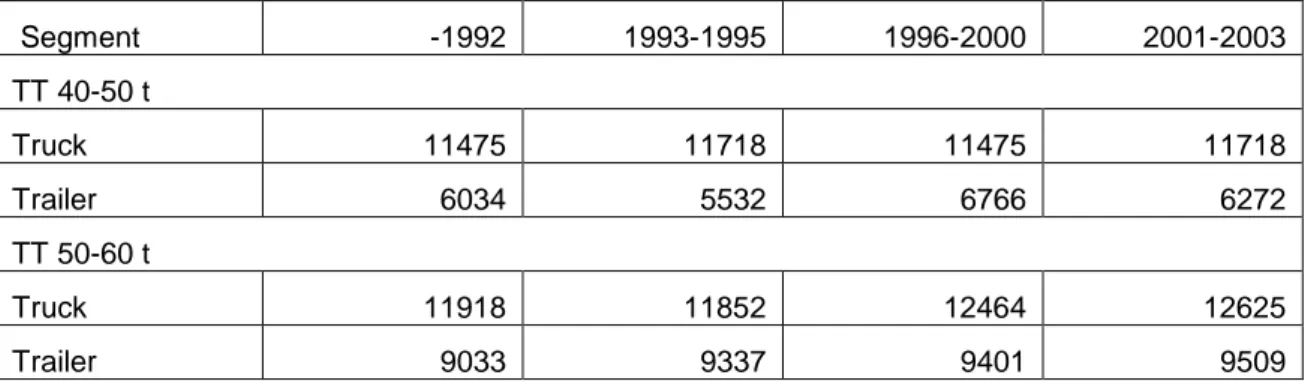
The empty weight is possible to split into values for the truck and for the trailer, see table 4.8.
Table 4.8 Separate empty vehicle weights (kg) for the truck and for the trailer per year model interval in year 2003.
Segment -1992 1993-1995 1996-2000 2001-2003 TT 40-50 t Truck 11475 11718 11475 11718 Trailer 6034 5532 6766 6272 TT 50-60 t Truck 11918 11852 12464 12625 Trailer 9033 9337 9401 9509
The main empty vehicle weight difference between TT 40-50 t and TT 50-60 t is the trailer weight. In average the weight of TT 50-60 t trailer is 3170 kg higher than the TT 40-50 t.
The approximately distribution of the empty weight of the vehicle combination:
• TT 40-50 t: the truck 65% and the trailer 35% • TT 50-60 t: the truck 57% and the trailer 43%.
These distributions are most stable between year model intervals.
The TT 50-60 t includes a number of sub segments with different empty vehicle weights in the year interval 2001-2003:
• with truck 14-20 t: 20479 kg (truck: 10263 kg; trailer: 10216 kg) • with truck 20-26 t: 22083 kg (truck: 12303 kg; trailer: 9780 kg) • with truck 26-28 t: 22277 kg (truck: 12374 kg; trailer: 9903 kg) • with truck 28-32 t: 21839 kg (truck: 13410 kg; trailer: 8429 kg) • with truck >32 t: 24479 kg (truck: 14585 kg; trailer: 9894 kg).
The truck proportion of the TT 50-60 t empty weight increases from 50% for the 14-20 t truck up to 60% for the >32 t truck. The truck 28-32 t has the lowest trailer weight. Also TT 40-50 t has the lowest trailer weight for truck 28-32 t.
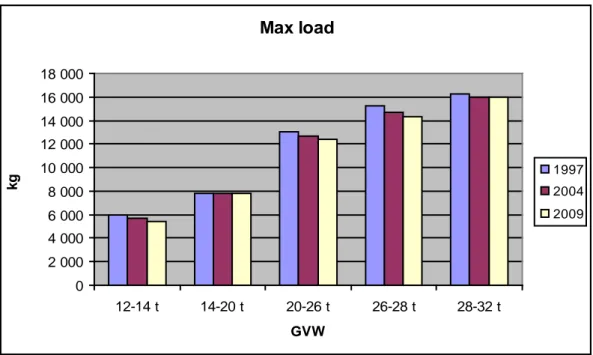
4.1.4 Max load
In table 4.9 the average max loads are presented for year 2003.
Table 4.9 Max load (kg) per vehicle segment (HBEFA level 2) and year model interval in year 2003.* Segment level 2 GVW -1992 1993-1995 1996-2000 2001-2006 RT 7.5-12 t 4670 4461 4768 4701 12-14 t 6682 6220 6272 5890 14-20 t 8126 8612 8300 8388 20-26 t 12740 12979 12526 12543 26-28 t 15303 15329 14882 14566 28-32 t 16766 15143 15805 13670 >32 t 20240 21348 17591 16479 TT 20-28 t 5500 14100 12000 28-34 t 15030 15100 34-40 t 22460 24705 21103 22338 40-50 t 28885 28130 27996 27275 50-60 t 39156 40616 40618 40644
Comments to table 4.9 about changes in max load from year model interval -1992 to 2001-2003:
• In average there has been a reduction by -5% (min: -19; max: +4%)
• Changes for the more important segments: RT 14-20 t, +3%, and TT 50-60 t, +4%.
In figure 4.3 the changes between year model intervals are presented for two vehicle segments. 0 5000 10000 15000 20000 25000 30000 35000 40000 45000 RT 14-20t TT>50t kg -1992 1993-1995 1996-2000 2001-2006
Figure 4.3 Max load variation between year model intervals per segment in year 2003.
In table 4.10 the changes between year model intervals in technical and legal road max loads are presented.
Table 4.10 Technical and legal road max load for TT 50-60 t per year model interval in year 2003. Truck GVW -1992 1993-1995 1996-2000 2001-2003 -1992 1993-1995 1996-2000 2001-2003
Technical Legal road*
14-20 t 34400 34795 33415 34400 34795 33415 20-26 t 38565 39241 39341 39187 38565 39024 38198 37917 26-28 t 39457 40644 40308 40214 38566 38712 38055 37723
28-32 t 43366 42473 42672 42888 39460 38868 38245 38161 >32 t 41557 47310 39832 45062 36454 36505 36000 35521
There is a considerable difference between the technical and the legal road max load for TT 50-60 t. For example in the year model interval 2001-2003:
• truck 20-26 t: +1269 kg • truck 26-28 t: +2491 kg • truck 28-32 t: +4727 kg • truck >32 t: +9540 kg.
The change in max load from year model “-1992” to “2001-2003” for TT 50-60 t:
• technical: +4% • legal road: -3%.
In the interval 2001-2003 the TT 50-60 t segment has lost 0.9 t (-3%) in legal load capacity compared to 1993-1995.
4.1.5 GVW
In table 4.11 GVW per segment and year model interval is presented. In a number of cases the technical GVW is higher than the legal road max AVW.
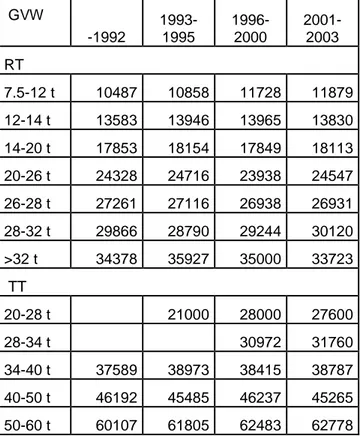
Table 4.11 GVW per segment and year model interval in year 2003.*
GVW -1992 1993-1995 1996-2000 2001-2003 RT 7.5-12 t 10487 10858 11728 11879 12-14 t 13583 13946 13965 13830 14-20 t 17853 18154 17849 18113 20-26 t 24328 24716 23938 24547 26-28 t 27261 27116 26938 26931 28-32 t 29866 28790 29244 30120 >32 t 34378 35927 35000 33723 TT 20-28 t 21000 28000 27600 28-34 t 30972 31760 34-40 t 37589 38973 38415 38787 40-50 t 46192 45485 46237 45265 50-60 t 60107 61805 62483 62778
The change in GVW from year model interval -1992 to 2001-2003:
• in average increases by +2% (min: -2% (TT 40-50 t); max: +13% (RT 7.5-12 t)) • for RT 14-20 t and for TT 50-60 t: +2% and +4%
For the segment TT 50-60 t one can notice that almost all transports are with a technical GVW>60 t, the max allowed actual weight on the road. Average GVW for TT 50-60 t in the year model interval “2001-2003” in year 2003 per truck segment:
• with truck 14-20 t: GVW 53.9t and 0.6% of the TT 50-60 t mileage • with truck 20-26 t: GVW 61.3t and 23.7% of the TT 50-60 t mileage • with truck 26-28 t: GVW 62.5t and 49.8% of the TT 50-60 t mileage • with truck 28-32 t: GVW 64.7t and 24.9% of the TT 50-60 t mileage • with truck >32 t: GVW 69.5t and 1.0% of the TT 50-60 t mileage. Comments about technical GVW and the road max AVW:
• In section 3.1 the max legal GVW is presented for different number of axles • In Appendix 3-5 the number of truck axles per vehicle segment (level 1) is
presented
• The average technical GVW being higher than average legal on the road for the following segments:
o RT 14-20 t with in average 2.01 axles (2 axle road max limit: 18t) o RT 26-28 t with in average 3.00 axles (3 axle road max limit: 26t) o RT>32 t with in average 3.96 axles(4 axle road max limit: 32 t) o TT50-60 t (overall road max limit: 60 t).
4.1.6 Vehicle body distribution
In order to estimate the average air drag coefficient (Cd) one needs the distribution of vehicle bodies per weight and emission concept class. This distribution is also of interest in order to estimate the vehicle cross section.
Data from 1997 is available describing mileage for rigid truck (RT) and truck with trailer (TT). Each such group is possible to divide after type of vehicle body for the truck. Vehicle body distributions for TT 40-50 t and TT 50-60 t respectively are presented in table 4.12 and 4.13.
Table 4.12 Body type distribution (%) on the road for the segment TT 40-50 t in year 1997.
Body type* Year model Total
-1992 1993-1995 1996-1997 Open platform 35.7 28.5 47.2 36.6 Bunks 3.8 2.3 9.4 4.5 Platform, covered 3.6 4.7 7.9 4.5 Box 30.1 29.1 21.5 28.5 Tank 11.3 6.0 7.4 9.9 Others 15.6 29.4 6.6 16.1 Total 100.0 100.0 100.0 100.0
*For the truck.
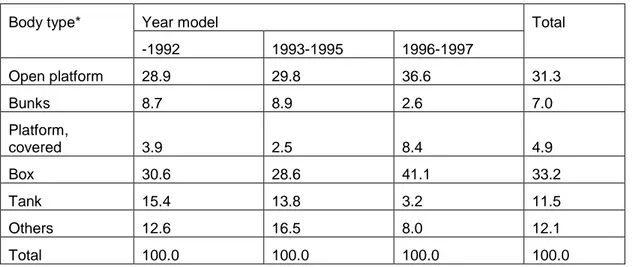
Table 4.13 Body type distribution (%) on the road for the segment TT 50-60 t in year 1997.
Body type* Year model Total
-1992 1993-1995 1996-1997 Open platform 28.9 29.8 36.6 31.3 Bunks 8.7 8.9 2.6 7.0 Platform, covered 3.9 2.5 8.4 4.9 Box 30.6 28.6 41.1 33.2 Tank 15.4 13.8 3.2 11.5 Others 12.6 16.5 8.0 12.1 Total 100.0 100.0 100.0 100.0
*For the truck.
The group of other vehicle bodies includes for example:
• hook lifts • swap bodies
• device for demountable bodies • transport of vehicles, machines etc. Comments to table 4.12 and 4.13:
• TT 40-50 t:
- open platform: increasing proportion by increasing year model - box: decreasing proportion by increasing year model