V TInotat
Nummer: V 02 ~ Datum: 1986-11-13
Titel: Polystyrene foam as a frost protection measure at the State Roads in Sweden
Forfattare: Rune Gandah!
Avdelning: Vigavdelningen (Vigkonstruktionssektionen) Projektnummer: 4 1024-1
Projektnamn: Bevakning och kunskapsuppbyggnad inom V-sektionens amnesomraden
Uppdragsgivare: VTI
Distribution: dae / / begriansad /
Statens vag- och trafikinstitut
POLYSTYRENE FOAM AS A FROST PROTECTION MEASURE ON
NATIONAL ROADS IN SWEDEN *>
by Rune Gandahl
Swedish Road and Traffic Research Institute 5-581 01 LINKÖPING
Sweden
ABSTRACT
Polystyrene foam boards have been used as a frost protection measure in roads in Sweden for about 20 years. Different qualities have been tested regarding their long-term function as an insulation. Properties
such as bacterial, chemical and mechanical durability in roads and the
preserved low heat conduction have been continuously followed up. In the specifications of 1976 of the National Road Administration, the extruded polystyrene skinboard, type HI 50, from Dow Chemical Co was
recommended for use in an insulated road base.
With regard to skid resistance, the depth of insulation was changed from 50 cm, according to the 1976 specification, to 40 cm below road surface in the specifications of 1984. This change was based on experience from the VTI test field. It was observed that a conventional crushed rock roadbase showed the same icing risk potential as a base with 40 cm sandy gravel above the insulation board.
Recommended insulation thicknesses are related to average freezing
index at the site.
A new procedure is being developed making it possible to calculate the frost heave when the frost penetrates below the base into underlying frost-susceptible soils. The procedure is based on determination of the frost heave properties of soils by a direct freezing test. This makes it possible to optimise the frost-protective base construction with regard to local ciimatic, geological and hydrological conditions at the site.
Presenterat och antaget Vld TRB 66th Annual Meeting,
POLYSTYRENE FOAM AS A FROST PROTECTION MEASURE ON NATIONAL ROADS IN SWEDEN
by Rune Gandahl
Extruded polystyrene skinboard and molded bead polystyrene board have been used as a frost damage protection measure for about 20 years on a number of national roads and other roads in Sweden. In the Swedish Road Administration specifications of 1976 and 1984, the insulated road
base consists of three main layers: the overlying bearing course upon
the plastic foam layer, the plastic foam layer itself and as a bottom layer non frost-susceptible soil material (e.g. sand or old road base material). Figurel illustrates both this construction and bases with gravel and sand, tree bark, lightweight aggregates and a conventional base, all bases being frost-protected to the same degree. The layers above the plastic foam have a thickness of at least 40 cm. The thickness of the plastic foam layer depends on the mean freezing index at the site and also on the thickness of the underlying non frost-susceptible layers. Figure 2 shows the design table for insulation with
polystyrene foam used on Swedish roads / l/.
The type of plastic foam used in insulating Swedish roads is
predomi-nantly different qualities of extruded polystyrene skinboard foam from
Dow Chemical Co. The recommended quality is Styrofoam HI 50. The investigation of this product and other varieties of polystyrene foam
started in 1966 and has been continued for many years. The results have
led to the conclusion that polystyrene foam can function also in the long run as an efficient measure against detrimental effects of frost.
Gravel sand Bark
?jr-f jfgfuirfgfä: ?51
2
THICKNESS OF BASE (RELATIVELY)
BY DlFFERENT FROST PROTECTION METHODS
Leightweight
Conventional
aggregates
Plastic foam
base
_- -i'vfiiliff'E-'Tériä-//r//://:'//://://: //2//:.' //: //=//-= // _ . , , . *7 '15 _-Å'Å'Å? //z//z//z//=//=Figure 1. Thickness of road bases for the same frost protection degree
and different frost protection methods.
Thickness in mm
AVERAGE
I
*
FREEZING
INSULATING BED
'NDEX
100 200300400 500600700
0
C ' days
.PLASTIC FOAM LAYER
< 500 35 30 25 20'
500- 600 40 35 30 25 20
600 - 700 50 40 35 30 25 20
700 - 800: 60 50 40 35 30 25 20
800 - 900-- 70 60 50 40 35 30 25
900 - 1000 80 70 60 50 40 35 30
1000-1100 90 80 70 60 50 40 35
1100<
90' 90 80 70 60 50 40
* NON FRDST-SUSCEPTIBLE MATERIAL
Figure 2.
tion for road bases insuiated with plastic foam /1/.
Design table used by the National Swedish Road
Administra-m
'-0
-0.5
--1.0
-1.5
--2.0
INVESTIGATIONS OF THERMAL BEHAVIOR ON TEST ROADS
When in 1965 the VTI (Swedish Road and Traffic Research Institute) was requested to test polystyrene foam built into a roadbase, the frost insulation properties of this type of foam were practically unknown.
Therefore the tests had to be both extensive and intensive. In Sweden,
frost problems affect every part of the country. The climatic conditions
can simply be described by the distribution of the freezing index, see
Figure 3. The increasing values of the freezing indices towards norther-ly regions indicate a greater need for frost protection in these parts of the country. Compare the frost heave shown in the table at the right in the figure.
FROST HEAVING (CM)
WHEN 1 CM NEEDS:
50 °Cd
100 °Cd
200 °Cd
-> 35
18
9
'-'> 30
15
7.5
-*> 24
12
6
-> 18
9
4.5.
-> 12
6
3
-
9
3
15
.°
AVERAGE FREEZiNG
'
INDEX IN SWEDEN,
?5
'
°Cd
Figure 3. The average freezing index (OCd) and the corresponding
frost heave (cm) for the frost heave quotients: 50, 100 and
200 (OCd/cm).
The first test road was constructed in 1966, and was of an introductory type. The next year, 1967, the main test roads were constructed. These
test roads, Edsvalla 1967 A and B, in the western part of Sweden, contained sections with two types of polystyrene foam and different design of the base. For comparison a number of test sections with lightweight aggregates and tree bark were included. The total number of sections was 44. Some sections are to be found in Figure 4. Among other test roads, one in central Sweden is of special interest, Lasele 1972. The test road is situated in a part of Sweden where frost
protection measures must always be considered. It contains sections
with two different types of plastic foam: extruded polystyrene skin-board and molded bead polystyrene.
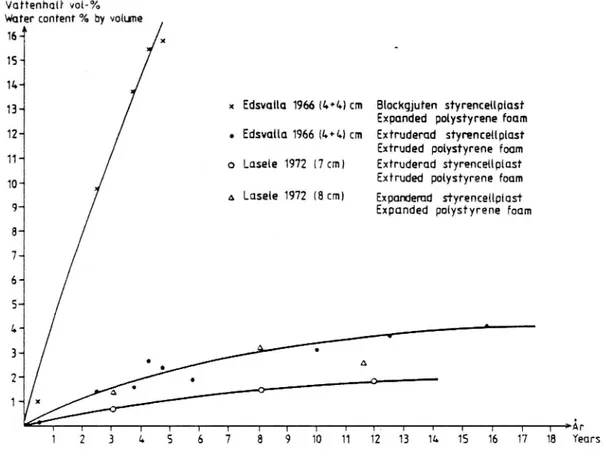
At all the test roads mentioned, the water take-up of the plastic foam has been determined. Several specimens of the foam from the test roads have also been tested concerning heat insulation properties. Thermal conductivity has been determined on samples directly after being taken up from the road. Figure 5 shows the water take-up registered on the test roads at Edsvalla and Lasele. The two Edsvalla
curves represent two kinds of polystyrene foam: an expanded type (cut cell molded bead polystyrene) and an extruded type. As can be seen
from the curves, the rate at which the expanded type takes up water is
very high, with a water content of about l6 % by volume after 5 years.
Consequently, this type of polystyrene foam is not recommended for frost insulation. At Lasele, one extruded polystyrene foam (extruded polystyrene skinboard) and one expanded polystyrene foam (molded
polystyrene foam) have been tested. The curves show that the increase in water content is low for the extruded polystyrene foam and higher
PM 1.0 0.85 0.77 M 1.0 0.5
SECTION: 1 2 3 4
p
M
0.81
0.94
1.0
0.77
M
1.0 -1
__ 1.0
0.5 _ 0.5 ..F .__.. -..?fçl'fäifzizil.t;.,.,,._,._4._.,__'_.,_,.,.. .,..u1_._ D 4 I 1 'i n i A ;L A L. U U 4 .. .. . . Vi N .1 vf v *1 w., .. .. .. .. .. . .. .. .. .. ... .. .. .. JJM PM 1-0 -% 0.71 0.74 0.81 0.83 0.72 0.73 - 1.0 0.5 '- 0.5 -1 _ ." H .-4' 1 .H 04- .' .' . I....i .4. O.Ll| p...u .4. .. 0-r L;- M . ' 'A 9 10 11 12 13 14 15PM
4
_
PM
1.0
1.0
0.5 0.5' .. . .. .. .. .. ..1..7.o .. .. .. .. .. .. i.á..ü..ü.._ ....-.1.§U..U...
AB, 86 (BITUMEN BOUND GRAVEL)
;JM = COEFFlCIENTOF
chnow
CG (CEMENT BOUND GRAVEL)
BASE COURSE GRAVEL
STYROFOAM
SAND
Iåi
ål
Vattenhalt vol-% Water content % by volune
41 16< 1S<
11»-4
13.. x Edsvalla 1966 (6+41cm Blockgjufen styrencellplast Expanded polystyrene foam 12-' . Edsvalla 1966 (LH.) cm Extruderad styrencellplast
Extruded polystyrene foam Hd o Lasele 1972 l7cm1 Exfruderad styrencellplast
104 Exfruded polystyrene foam
A 1415919 1972 18W) Expanderad styrencellplast
9* Expanded polysf yrene foam
.
T I I 1 1 I I I I 1 T 1- 1 r 1 T I 7 :År
1 2 3 h 5 6 7 8 9 10 11 12 13 11. 15 16 17 18 Years
Figure 5. Moisture absorption in polystyrene foam at the test roads
Edsvalla 1966 and 1967 and Lasele 1972.
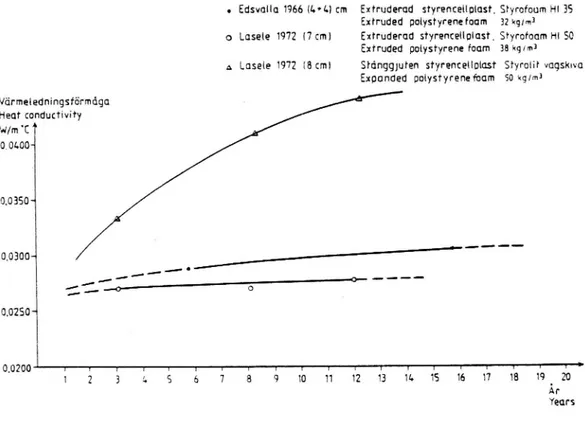
Of more direct interest, however, is the thermal conductivity, which
has been determined on certain occasions, see Figure 6. The curves describe the development of the thermal conductivity with time from the same test roads as in Figure 5. The superiority of the extruded foam over the expanded is cleariy recognized. In fact, after 12 years at the
Lasele test road, the thermal condu'ctivity value for the expanded foam exceeds that of the extruded foam by a factor of nearly 1.5. This result
has been applied by dimensioning the plastic foam layer, see design table Figure 2. The thickness of the foam layer in the table is related to
bead board type of polystyrene foam of the Lasele quality is to be used
the thickness in the design table must be increased by 50 %.
o Edsmllo 1966 (lvl.) cm Extruderod styrencellplost, Styrofoum H1 35 Extruded polystyrenefoom 32 kglm3 o Lasele 1972 (7 cm) Extruderud styrenceuolost, Styrofoum H1 50
Extruded polystyrene foam 38 kg/m3
A Lasele 1972 (8 cm) Stdnggjuten styrencenolast Styrotir vogskwa Expanded oolystyrenefoom so kg/m3
Vörmeledningsförmdgo Heat conductivity \N,/m .E A 001.004 00350* 0.0300"1 / i _- 4. _I' . g _ _ _ -3:20? 0 (10250" r T T 7 7 T 7 r T I T I K T I T T 7 7 T ; 1 2 3 I» 5 6 7 8 9 10 11 12 13 110 15 16 17 18 19 . 20 Ar Years
Figure 6. Change in heat conductivity of polystyrene foam with time
on the test roads at Edsvalla 1966 and Lasele 1972.
The mechanical behaviour of polystyrene foam material has also been
investigated, but not to the same extent as the thermal behaviour. Attaining sufficient mechanical strength of the polystyrene foam presents no difficulties today as the producers of the foams have all the knowledge necessary to manufacture the foam boards to the desired strength.
INVESTIGATIONS OF ICING IN THE TEST FIELD
When starting the investigations on the test roads mentioned above, it was well known that icing on the road surface could occur earlier in autumn on heat insulated sections than on uninsulated sections. There-fore, measurements of the skid resistance and surface temperature were performed along the test roads during autumn and winter. From these investigations, it was clearly apparent that there was a somewhat greater risk of icing on heat insulated sections in comparison with uninsulated ones. This risk was strongly influenced by the construction type of the road base, see Figure 4, which shows the variation of the coefficient of friction for one special occasion on a number of the test sections on the Edsvalla test road. The friction values for the various insulated sections are related to the values of the uninsulated sections, which are given the value 1.
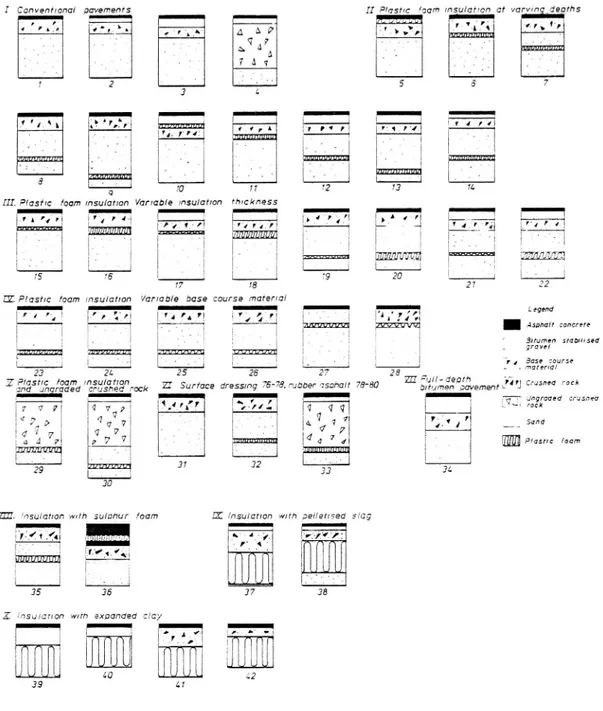
In order to study icing as a function of road construction, a special test field was organised at Linköping /2/. The object of the investigations in the test field was to make a general study of the interaction between climate and road construction, which results in slippery conditions in cold weather, and to make a particular study of the risk potential of different road constructions, most of them insulated with plastic foam. 42 different pavement types were studied in the test field, see Figure 7.
I my 0nv nt n I pae_yv menr's _I _r [IP/g r/c Fgam msu/arron at varv/n _deorhsJS U __l i *I
> .r w.. . < .* '. '7.7 "7 1-! "r 4 '5.1. 4.,.f. ' ,_.LÅ A AV 4).), _ -Lt _ .sv _ ' ' q 7 . r . . mm,EFEEIM, _ . y -_ . ' o. 4 A ' Wi 7 A q . . , 7 2 4 5 5 7 _I _ _i _I _I _| A' r", ,pr'I 1.1,] ärr' r ".1'7'1. ', ' . i' . i ', - _ . V . ' '0' 70 11 72 73 71.
III. Plast/c foam Insu/at/on Var/able /nsu/at/on rh/ckness
_| V I I_l A I _I _I 'A 'i' "'4 ' 4. . , »47). . 4" *Mu-f' . m, i' Hyr", 'tur -_ - a '4.1.2 -".'v" ä _' 4! ,ml 1 Q" __,4 ?mg[ 75 76 i . 79 20 *______1 77 18 27
EZ". Plastic foam msulaflon Var/able base course matar/al
-I | 1-.I '_I :L 5 gend
"'4 "4 :I'r :i: ;hur min » :nu:
M* . é_' - Asp/valt concrere
' . i E Slrumen Stabil/sed
. g ' g 2 ' \ I gravel
'zu/vw: 1 _
i i.. - "! 3 V ____;., u____4v- __74« ma enBasta :ao/urse
21. 26 27 i
. . .. . EU Full-deprh ,,
Z ,ock ZI Surface dressmg 75-rc9mubber osona/r 78-80 bnumen pavememglq Clusned rock
, _| _| J _ . \ gg 3 graaed t asnea 1_ltrl'7 .11-, (J (1 q 'Nk-i rock I [Å V V 4_ ' I u_ SONG [4 d 7 d Plastic foam 37 33 34
ZZII. /nsu/atlon wth su/ohur foam DI /nsu/arlon wn'h gener/sed s/ag
_ !
'a' . 43 p__. ,i * . r"
I
37
Z. /nsu/ar/on mm expanded clay
_I _I I _| i', ,A §_,, b" 9 - - -r. 1 F
O
iii
| ' J bi
40 1.2 39 41Figure 7. Pavement types in the test field at Linköping 1976 /2/.
According to K Gustafson, VTI, the background for the icing process can be expressed as follows.
"The presence of an insuiating layer in the road pavement affects the flow of heat upwards and downyvards. In a heating situation, the
insuiation layer retards the downward flow of heat in the road, while in
a cooling situation upward flow of heat from material courses under-neath the insulation is retarded, and outward radiation of energy from
lO
road without insulation. The consequence is that the insulated road generally has a somewhat lower surface temperature than most types of road without insulation. Surface temperature conditions in an insulated road are affected by a) the depth at which insulation is laid, b) its thickness and c) the materials in the courses above the insulation. The temperatures are also influenced by the thermal conductivity of the insulating material."
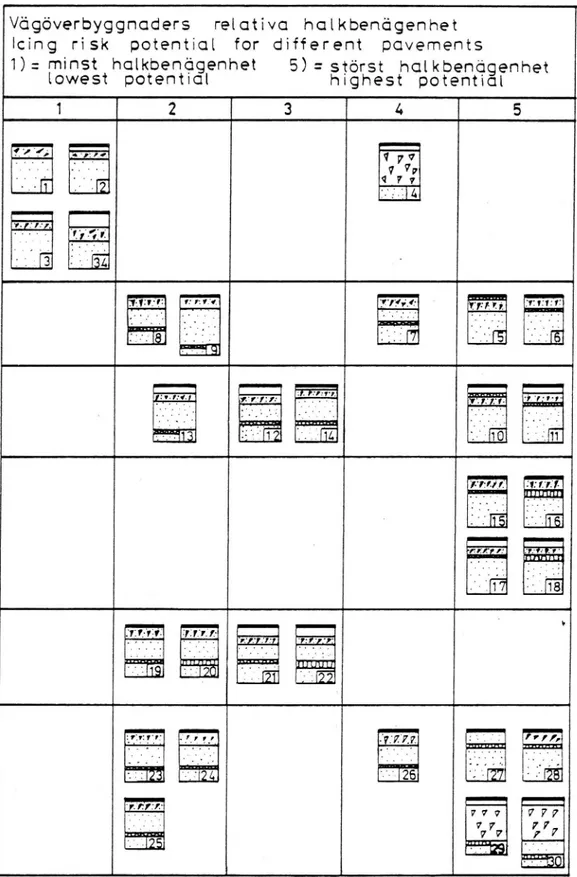
The results of the observations from the test field over the period of 1976-1980 are summarised and concentrated in a table, Figure 8. In this table the different pavements are arranged according to the potential risk of icing. It can be seen that the highest risk, as could be predicted, is found where the plastic foam layer is near the road surface or even far from the surface when the base is built up of crushed rock. It is also interesting to find that a base without plastic foam but with crushed rock near the road surface has a fairly high risk of icing. The lowest icing risk potential is shown by the uninsulated bases with natural ungraded gravel and sand. If the foam insulation is laid at a depth of about 35 cm, the icing risk potential is high in relation to most
uninsulated road structures, but is about the same as that of a
pavement incorporating ungraded crushed rock below the asphalt con-crete wearing course. For roads with the insulation laid at a depth of 50 cm or more, the risk of icing is relatively small, but is still somewhat higher than that of most uninsulated roads. Many roads in Sweden have beenconstructed with the insulation layer at a depth of 40 and 50 cm beneath the road surface without any serious icing problems. In the specifications of 1984 for public roads, the lower depth of 40 cm is consequently allowed.
11
Vögöverbyggnoders relativa hoikbendgenhet
icing risk potentidl for different pdvements
i): minst holkbendgenhet
5)=störst halkbendgenhet
Lowest potentiol highest potential
1 2 3 4 5 '(13' K';j)_t i ... .. .. yv 7 77 .' im q 7 v
'5.314
'if-"fd \ * ijv: 1:1: 1.' 'gl ' [7 ' E -9 4 'N 17*.gl
.
_ SN. : a. n. i . . . . .:ii
I . .I .TJ-Y"-_I:.13: y'r? . 1.:_ 17.; -VIZ 7.7. N E m iFigure 8. Icing risk potentials of road pavements represented in the
test field at Linköping 1976. Summary of measurements
12
DESIGN AND DIMENSIONING OF A ROAD BASE INSULATED WITH POLYSTYRENE FOAM
There are three layers which contribute to the frost resistance capacity (in degree-days) of a roadbase insulated with plastic foam. The greatest contribution comes from the plastic foam layer itself and only a smaller amount from the overlying bearing course. What is sometimes not
considered, however, is the fact that the soil layers of non frost-susceptible material immediately beneath the plastic foam layer
contri-bute to a degree that cannot be ignored.
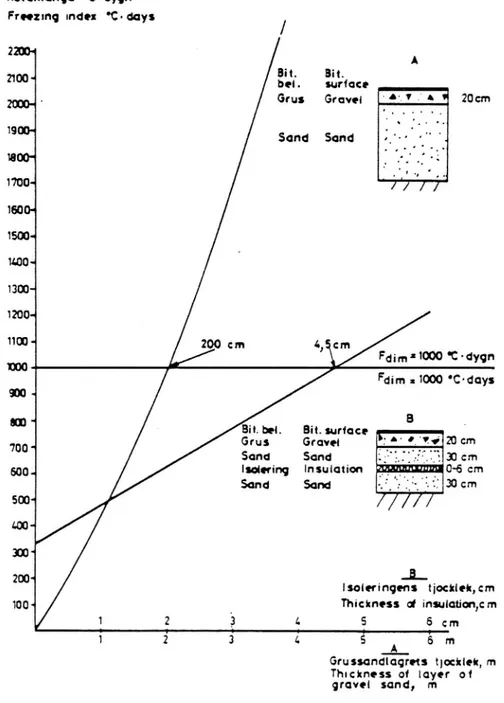
In Figure 9 the frost resistance capacity calculated as above of a road base built up of layers of sand and gravel and of a roadbase insulated
with polystyrene foam is plotted as a function of the thickness of the
gravel-sand base and of the thickness of the polystyrene foam layer /3/ . The design freezing index is assumed to be 1,000 degree-days for the particular part of the country. Thus, if during one winter the freezing index reaches the value of 1,000 degree-days, the bases will just freeze but not the subgrade. That means that by choosing either a 200 cm thick roadbase of gravel and sand or a base insulated with 4.5 cm of
polystyrene foam with a total base thickness of around 85 cm, 100%
frost protection can be obtained for either base during that winter. The frost resistance capacity of the polystyrene foam insulated base is dependent mostly on the insulation properties of the polystyrene foam (thermal conductivity) and also on the water content of the layer of sand below. Figure 10 is a diagram describing frost resistance capacity
related to the thickness of the polystyrene foam for different thermal conductivity values of the foam.
Figure ll shows the importance of the water content of the layers beneath the plastic foam. This layer acts as a freezing resistance layer and is consequently more efficient the more water it contains. As old roadbases are often built up of fine grained and moist material, it may be an advantage to insulate them with plastic foam by merely placing the foam boards directly upon the old road surface and constructing a
13
The philosophy of this related art is the basis for the determination of
the thicknesses needed for the polystyrene layer in the design table, Figure 2. The thicknesses of the polystyrene layer including the
non-frost-susceptible layer beneath it correspond to a frost protection degree of some 90 %, allowing the frost to penetrate and act in the subbase or subgrade every 10th winter. During these winters there will consequently be some frost heave. The magnitude of the heave depends on the insulation properties of the roadbase.
Köldmängd 'Odan Frnzmq ande: 'Csdays 220m A Bit. Bit. 21004 bei. surface p_______| m - Grus GfOVOi v A 1 205m 19m" Sand Sand '. 100m : -l 4 c 'I ; :i 1600-* 1500« 11.004 1303-12004 1150* 200 cm 4, cm
Fann a:1000 -odays
900 «
m '1 B'o beia . . Bitsurface 1---IB ' Grus Grave! få' '. "i 20 cm
700. . Sand Sand L; 3] cm 600.. isolering Insulation Sand Sand 5001 m.. m« 2001 Isolermqens t;ocklek,cm. . 1001 Thickness d insulaüon,cm
L
2
.3
e
5
6 cm
i i 3' Z ? A á :11Gru ssondlaqras mccain, m
Thuckness of layer of greve! sand, m
Figure 9. Example showing the calculated frost resistance capacity of
a sand-gravel road base and a base protected against frost
with polystyrene foam. These capacity values are not to be
generally used. When calculating the frost resistance
capa-city for any single base appropriate input values have to be
Freezi
15001400
1300
-1200 '
1100
1000 "
900
-800
'-14ng index °C°dc1ys
7\\^//m°E
/ >\0.02-0.05W/m°C
* /
0023
3-6an increased
thickness of Insulation
Fdim 1000 °C-dc1ys
0'029 Gravei '. fav-4:0. ZOcm
Insäwtqon
" i.:
0.035 Sand BOcm.0.041
0.046
0.052
3
'
å
ä
å
ä
Thackness of 1nsu1ahon,cm
Fioure 10. The frost resistance capacity of a roadbase with polystyrene foam for different values of thermal conductivity, as a
function of the thickness Of the foam layer /3/.
Freezing index °C days
1500-1400*
11 300-*
1200*
1100"
1000"*
900-800-*
700-z,
Figure 11. 15Water content of
lower sund layer
20 VOLO/o
15 VOL O/o 10 VOLo/o
7 vol.°/c
co 3.5cm\
/ \co 4.5 cm
Fdim 1000°C°doys
Grovel ' .1.1. . 20 cm
Sand
'ffilü?? 3ocm
insulation N... § 3-6 cm Sand "' 30cm. I 7 I T3
4
S
6
7
8
Thickness of insulotion, cm
.-4 .-4The frost resistance capacity of a roadbase with polystyrene foam for different values of the water content of the material in the layers just beneath the foam layer, as a
16
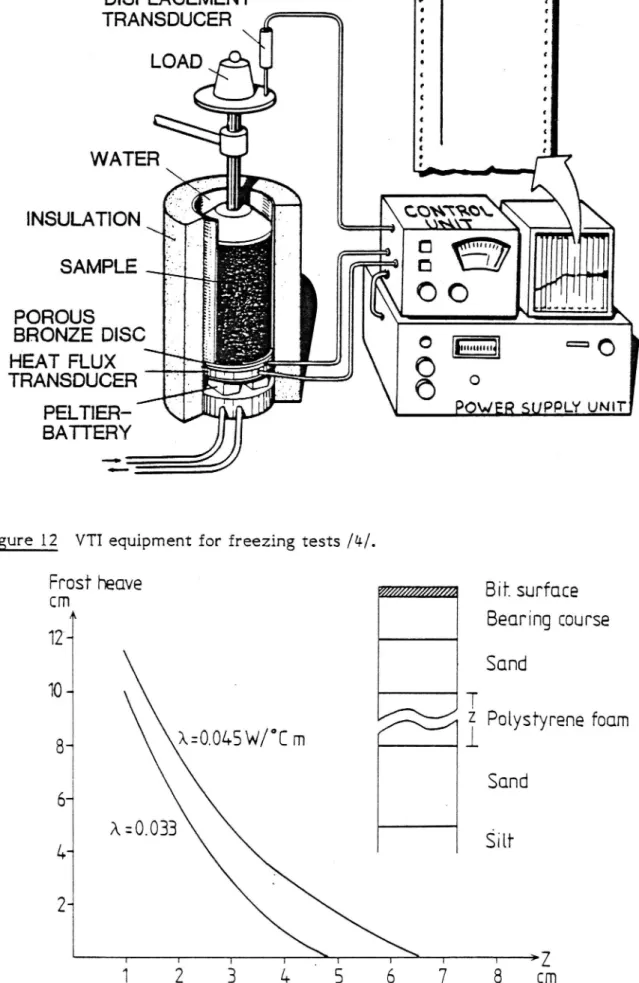
A procedure has been developed, making it possible to calculate the frost heave when the frost penetrates deeper than the base and the base is underlain by frost-susceptible soils. The frost heave depends on the thermal (road surface temperature), and moisture (water content and ground water level conditions), road and subgrade structure, but most important are the heave pr0perties of the soil in the subgrade. The latter are determined by an apparatus invented and accurately adjusted at the VTI /4, 5/, see Figure 12. The values describing the frost heave
properties (ice segregation potential and sensitivity to load pressure)
determined with the apparatus are directly usable in calculation of the frost heave. The calculations, which are computerised, run in steps from the natural autumn conditions through the winter.
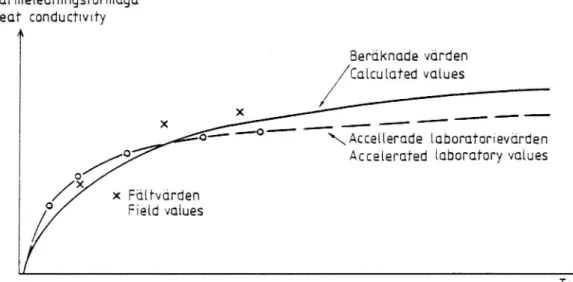
The importance of heat conductivity with regard to frost heave is easily
recognized from a calculation performed by L Stenberg at VTI, see Figure 13. The thickness of a polystyrene foam layer is calculated for two values of the conductivity, both giving the insulated roadbase a specific degree of frost protection. From the curves it can be read off
that when 4 cm of frost heave is allowed, the thickness of the foam
needed is 3.5 cm when Å = 0.0145 W/mOC, and 2.55 cm when
>x: 0.033 W/mOC. In this way, the thickness of the polystyrene foam
layer can be appreciated for different values of the thermal
conductivi-ty.
17
DISPLACEMENT
TRANSDUCER
. o a a a c s n s ño o a q ño . qWATER
INSULATION \ .
Sååm'
I ;i .. L 3. .a 0SAMPLE ...r-'gr-
:a i
58835? 0130
- '
° m
==
HEAT FLUX
O
O
TRANSDUCER
Ö 0
PELTIER- / POWER SUPPLY
oun-BATTERY
Figure 12 VTI equipment for freezing tests /4/.
2:105]L heove
'
Bit. surface
A
Beoring course
1D
Sund
70*
T
N 2 Polystyrene foom
8_
x=0.045w/°c m
/V i
Sond
6..Å:0.033
*
4-
Salt
2-4 I I I 1 . T I I 1 ;Z1
2
3
1+
5
6
7
8
cm
Figure 13. Frost heave as a function of the thickness and the heat conductivity in a road base insulated with polystyrene foam.
18
DESIGN THERMAL PROPERTIES OF POLYSTYRENE FOAM
Polystyrene foam, which is an organic material, is relatively new and is
available in several varieties and qualities. The main types of polysty-rene foam are the expanded and the extruded types. The extruded type has proved to have the best frost insulating properties in the long run. In order to discriminate between the different types of frost insulation material, it must be possible to determine the development of the heat conductivity during a proposed sequence of years.
In polystyrene foams the conductivity increases with time due to the
water take-up. This applies both to expanded and extruded polystyrene
foams. For extruded polystyrene foam, it must also be added that the
heat conductivity increases because of the cell gas exchange, which continues for a very long time. The heat conductivity of the extruded
polystyrene foams of the qualities known so far is, however, always lower than the heat conductivity of the expanded polystyrene foams. In order to determine a heat conductivity value of polystyrene foam for
dimensioning, it is necessary to perform accelerated tests in the labora-tory and long-term tests in the field. To achieve this, a procedure has been worked out which is now undergoing final adjustment in c00pera-tion with the Nac00pera-tional Testing Institute in Sweden. In this procedure the
water take-up is studied when the vapour gradient is increased in
comparison with the natural conditions. An extra splitting of the boards forces the cell-gas exchange to accelerate. Values from the laboratory and the field are compared. Through extrapolation it is now possible to determine the development of the heat conductivity over a longer time with the help of known theories of water take-up and cell-gas exchange. From the curves describing the changes in heat conductivity with time it is possible to evaluate a heat conductivity value for dimensioning, see Figure 14.
In order to assess the frost-insulating properties of a new and little
known material, a method of analysis is proposed by testing the materials in the laboratory, on small test surfaces and eventually at
19 Varmeledmngsformåga Heat conduchvnfy A Beräknade värden /Catculated values
-- "'° \Accellernde lcborufcrievdrden Ac celerufed laboratoryvatues x Fdlfvdrden Fietd values Tid I Time
Figure 14. The variation of heat conductivity of polystyrene foam as a function of time due to moisture absorption and Change in the cell gas content.
20
THE USE OF POLYSTYRENE FOAM ON ROADS IN SWEDEN
The main purpose of using polystyrene foam on Swedish roads is to counteract frost heave. As the frost heave in the north of Sweden can exceed 30 cm during an average winter, much more in an extremely cold winter, it is understandable that the frost protection measures must be of an efficient type. Insulation with polystyrene foam is one of them. According to the design table in Figure 2, a standard insulation consists of a bearing course of 40 to 50 cm and a polystyrene layer of a thickness which depends on the thickness of the non frost-susceptible layer underlying it. The thickness can be read off from the design table by starting with the average freezing index at the particular site, e.g. 900-l,OOO degree-days (0C.d). If the thickness of the non
frost-suscep-tible material under the foam layer is only 100 mm, the thickness of the
foam should be 80 mm. But if the foam layer is to be placed upon an old
road surface, and the road base thickness is 500 mm, the foam thickness
can be reduced to 40 mm with a saving in cost of the insulation
material of 50 %.
The thicknesses of the plastic foam layer in the table, Figure 2, are
applicable for conditions where a uniform thickness of the insulation layer is appropriate. The most usual case is a road, along which the frost heave properties of the subgrade or the roadbase itself change irregularly. By dimensioning the foam insulation so that no detrimental frost heave arises even on those parts of the road where the heave potential is highest, longitudinal evenness of the road surface is
achieved.
Difficulties caused by frost on Swedish roads becomes worse further
north, because of colder winters and the high degree of frost suscepti-bility of the soils in the subgrade. See map and table of frost heave, Figure 3. The terrain which gives the most severe problems is where the subgrade comprises mixed layers with frost and non frost-susceptible materials and where at the same time ground water level is high. In this
type of terrain, which is common in Sweden, insulation with polystyrene foam is used as an efficient frost protection measure.
Another
21
field where insulation by polystyrene foam is used with success and is especially economically motivated is at culverts. Figure 15
illustrates how uneven frost heave can be counteracted. The figure gives the longitudinal section through a culvert in an ordinary road. The frost heave before and after the provision of the insulation is plotted. It is clearly demonstrated that insulation with plastic foam results in a
sm oother road surface.
Insulation with plastic foam at a culvert is achieved constructionally by
tapering the foam layer. The same technique is also used as a transition when a conventional foam insulation along the road is to be terminated.
TESTROAD MALGOVIK 1973
FROST
HEAVE
(STYROFOAM INSULATION)
cm
20 - .
BEFORE INSULATION\
O // ""="*'M
_
AFTER
_
20 ._
lNSULATlON
ROAD BASE
40 '
_
'° *'*' ' ' ^ Tate.
INSULATION
A
t rt." v' -' s
60 -
a
._ /\ 380 :
SUBGRADE
100
120
--_
FROST LINE
140
160
--DEPTH
Figure 15. Insulation with polystyrene foam of a culvert by double
22
In the Swedish national road network every year, an area of about 150,000 m2, which corresponds to a road length of 10 to 15 kilometres, is insulated with polystyrene foam. This figure will centainly increase in the future, when the technique of designing and dimensioning has been further improved and the application of the insulation concept has been even better adapted in practice.
23 REFERENCES
/l/
/2/
/3/
/4/
/5/
Vägverket, BYA 84, Byggnadstekniska föreskrifter och allmänna råd, Vägverket, Utvecklingssektionen TU 154, Borlänge 1984. Gustafson K. Road Icing on Different Pavement Structures. Inves-tigations at Test Field Linköping 1976, over the period 1977-1980. National Road år Traffic Research Institute. Rapport 216 A. Linköping 1981.
Gandahl R. Plastic Foam insulation of Roads. Frost resistance
capacity, partial insulation and frost heaving, special transitions,
icing and economy. National Road dc Traffic Research Institute. Rapport 214 A. Linköping 1981.
Stenberg L. Frost Heave Tests with Constant Rate of Heat
Extraction. Road år Traffic
Rapport 220 A. Linköping l98l.
National Research Institute.
Fredén 5. Metod för beräkning av tjällyftning, Statens väg- och