Mälardalen University
This is an accepted version of a paper published in International Journal of Greenhouse
Gas Control. This paper has been peer-reviewed but does not include the final publisher
proof-corrections or journal pagination. Citation for the published paper:
Li, H., Wilhelmsen, Ø., Lv, Y., Wang, W., Yan, J. (2011)
"Viscosities, thermal conductivities and diffusion coefficients of CO2 mixtures:Review of experimental data and theoretical models"
International Journal of Greenhouse Gas Control, 5(5): 1119-1139
URL: http://dx.doi.org/10.1016/j.ijggc.2011.07.009 Access to the published version may require subscription. Permanent link to this version:
http://urn.kb.se/resolve?urn=urn:nbn:se:mdh:diva-13348
Viscosity, thermal conductivity and diffusion coefficients of CO2 mixtures: review of
experimental data and theoretical models
Hailong Li 1,2,*, Øivind Wilhelmsen1, Yuexia Lv2, Weilong Wang2, Jinyue Yan2, 3 1 SINTEF Energy Research, Kolbjørn Hejes vei 1A, 7465 Trondheim, Norway
2 Sustainable Development of Society and Technology, Mälardalen University, 72123 Västerås, Sweden
3 Energy Process, Royal Institute of Technology, 10044 Stockholm, Sweden
Abstract:
Accurate experimental data on the thermo-physical properties of CO2-mixtures are pre-requisites
for development of more accurate models and hence more precise design of CO2 capture and
storage (CCS) processes. A literature survey was conducted on both the available experimental data and the theoretical models associated with the transport properties of CO2-mixtures within
the operation windows of CCS. Gaps were identified between the available knowledge and requirements of the system design and operation. For the experimental gas-phase measurements, there are no available data about any transport properties of CO2/H2S, CO2/COS and CO2/NH3;
and except for CO2/H2O, CO2/H2O/NaCl and CO2/amine/H2O mixtures, there are no available
measurements regarding the transport properties of any liquid-phase mixtures. In the prediction of gas-phase viscosities using Chapman-Enskog theory, deviations are typically less than 2% at atmospheric pressure and moderate temperatures. The deviations increase with increasing temperatures and pressures. Using both the Rigorous Kinetic Theory (RKT) and empirical models in the prediction of gas-phase thermal conductivities, typical deviations are 2.2-9%. Comparison of popular empirical models for estimation of gas-phase diffusion coefficients with newer experimental data for CO2/H2O shows deviations of up to 20%. For many mixtures relevant for
CCS, the diffusion coefficient models based on the RKT show predictions within the experimental uncertainty. Typical reported deviations of the CO2/H2O system using empirical models are below
3% for the viscosity and the thermal conductivity and between 5-20% for the diffusion coefficients. The research community knows little about the effect of other impurities in liquid CO2 than water, and this is an important area to focus at in future work.
Keywords: CO2-mixtures, transport properties, viscosity, thermal conductivity, diffusion
coefficient, CO2 capture and storage 1 Introduction
Currently operating commercial projects about CO2 capture and storage (CCS) have raised many
research & development requests to improve the health, safety and environmental issues and reduce the costs in existing and future CCS chains. Accurate knowledge about thermo-physical properties of fluids plays an important role in cost-effective design and operation of chemical and biochemical plants. Broadly speaking, the thermodynamic properties determine the feasibility of a given process, while the transport properties have a major impact on sizing of the equipment (Hendriks et al., 2010). As discussed in (Li et al., 2011; Jiang 2011), the knowledge about thermo-physical properties is essential to the design and operation of CO2 conditioning and transport. The
knowledge about the behaviour of the mixture under the conditions of a particular process will allow:
• Identification of possibly encountered problems;
• Specification of safe concentration limits for involved impurities; • Defining the requirements for purification if necessary
• Designing efficient and safe processes
* Corresponding author. Present address Mälardalen University, PO Box 883, 72123 Västeras, Sweden; Email: lihailong@gmail.com; Tel: 0046-21-103159; Fax: 0046 21101480.
The thermo-physical properties include thermodynamic properties such as vapor liquid equilibrium behaviors and densities; and transport properties such as viscosities, thermal conductivities and diffusion coefficients. Our previous work (Li et al., 2011) contains a review of the experiments and theoretical models available in the literature concerning important thermodynamic properties. In this work, the focus will be on the transport properties of fluids in the CCS-chain.
The transport properties of CO2 rich mixtures are important properties closely connected to heat,
momentum and mass transfer in CCS. This fact may be illustrated by considering the straight-forward example of CO2 transport in pipelines. The pressure-drop is directly related to the power
consumption and dimensioning of pumps/compressors to maintain flow through the pipelines. The pressure drop in laminar and transitional flow has been observed to be approximately inversely proportional to the Reynolds number of the flow. The Reynolds number is again inversely proportional to the viscosity of the particular mixture. In practice, this means that a viscosity model which predicts a 30% too low viscosity, will lead to a 30% underestimation of the pump/compressor power consumption. In addition, the Reynolds number is also proportional to velocity, which is further related to mass flow rate and density. In order to predict mass flow and density precisely, heat and mass balance equations must be solved, which may include additional transport properties such as the thermal conductivity and the diffusion coefficients. Another example of the importance of transport properties is in the development, design and simulation of amine-based chemical absorption columns where it is essential to provide accurate predictions of viscosities, thermal conductivities and diffusion coefficients (Hoff et al., 2004).
The CO2 captured from an energy-conversion process always contains impurities and the
existences of impurities will clearly change the properties compared to pure CO2. Therefore, the
thermo-physical properties of CO2-mixtures attract more and more attention in both the industry
and the academia (Hendriks et al., 2010). The properties of CO2-rich mixtures have been partly
reviewed previously with the purpose of understanding supercritical fluid processes and technology (Ely, 1987; Magee 1991). This work contains a more comprehensive literature review concerning both the experimental data and the mathematic models about the transport properties of CO2-mixtures relevant for CCS. The purpose of the work is to summarize and evaluate the
available experimental data, identify knowledge gaps and investigate the available models that have been proposed and tested in the literature. The work will also provide suggestions for future research on the transport properties of CO2 rich mixtures.
2 Operating windows and possible impurities in CCS processes
The operating windows of CCS processes determine the relevant ranges of temperature, pressure and composition, in which experimental data are required and property models should preferably be validated to minimize the uncertainties in the design criteria of the different steps of the CCS chain. A typical CCS chain normally consists of four main steps: CO2 capture, CO2 conditioning
(dehydration, non-condensable gas separation and/or liquefaction, and compression/pumping), CO2 transport and CO2 storage. The operating conditions of the CCS processes have been
estimated in previous work (IPCC, 2005; Li, 2008 and 2009) and show that to cover the whole CCS-chain, available experimental data and models should ideally cover a temperature range of 218.15-1620 K and a pressure range of ~0-50 MPa. This range will herby be referred to as the Temperature and Pressure (T&P) window of CCS. The type and amount of impurities in the CO2
depend on the fuels used and the choice of capture technology. The CO2 streams captured from
post-combustion with an amine solution are relatively clean, with H2O as the main impurity.
Relatively high levels of impurities are, however, expected in the CO2 streams captured from
oxy-fuel combustion, and a more complicated composition of the CO2 streams is expected in the
Integrated Gasification Combined Cycles. Based on the different oil industry and fuel conversion processes, the possible impurities and ranges for these are summarized in Table 1.
Component Min mol% Max mol% CO2 75 99 N2 0.02 10 O2 0.04 5 Ar 0.005 3.5 SO2 <0.001 1.5 H2S+COS 0.01 1.5 NOx <0.002 0.3 CO <0.001 0.2 H2 0.06 4 CH4 0.7 4 H2O 0.005 6.5
Amines (MEA, DEA, MDEA) <0.001 0.01
NH3 <0.001 3
There are no strong technical barriers to provide high purity CO2 from the flue gas of fossil fuel
fired power plants. However, high purity requirements are likely to induce additional costs and energy requirements resulting in a high loss of power plant efficiency. It is thus important to find an optimal balance between the requirements with respects to safety, legal and environmental aspects of transport and storage and the costs concerning CO2 sequestration. Knowledge about the
behavior of CO2 with impurities is vital to achieve this.
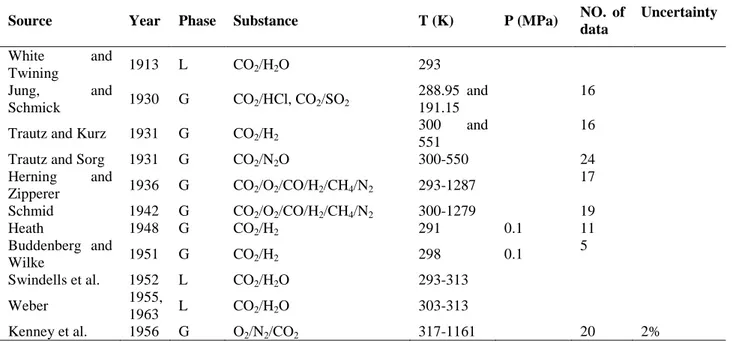
3 Experimental data
3.1 Knowledge gaps
Accurate experimental data are not only important to assess whether already established models are reliable for applications in CCS, but also essential in the development of better theoretical models. Details such as temperature, pressure range and uncertainty for all available data on the transport properties of mixtures relevant for CCS may be found in 3 tables in Appendix A (Table A1-A3). Table 2 is a summary of the available experimental data and shows the TPX ranges. Compared to the possible ranges in pressure, temperature and composition encountered in the CCS chain, there are large gaps between available experimental data and requirements. Except for the mixtures CO2/H2O, CO2/H2O/amines and CO2/NaCl/H2O, there are no available
measurements for any of the transport properties of liquid mixtures. Liquid mixtures are, however, important in many parts of the CCS-chain, for instance when CO2 is transported in pipelines. For
the gas-phase, there are no available measurements for the mixtures CO2/H2S, CO2/NH3 and
CO2/COS. Table 2 reveals the knowledge gaps for the transport properties of CO2 rich mixtures.
In general, most of the transport property data are available only at atmospheric pressure. The pressure dependency of transport properties such as the viscosity is, however, large in particular in vicinity of the critical point. The lack of data for the most important binary mixtures of CO2 is
presented below: • CO2/O2
There are some experimental data about viscosity and diffusion coefficients of CO2/O2 and
the temperature could cover most of the temperature window of CCS. However, data at higher pressures than one bar should be provided. Compared to the viscosity and the diffusivity, much less data are available for the thermal conductivity. 4 points have been measured at 369 and 370K, without a specified pressure.
• CO2/N2
The transport properties of the gas mixture, CO2/N2, have been well studied. The available
data can satisfy the requirements of CCS, except for diffusion coefficients at pressures larger than one bar.
• CO2/SO2
More measurements about the viscosity at high temperatures and pressures should be provided. Few experimental points are available for the thermal conductivities (9 points) and the diffusion coefficients (5 points).
• CO2/Ar
All of the data about the transport properties of CO2/Ar are measured at temperatures
below 673 K. Therefore, experimental data for the properties at high temperatures should be provided.
• CO2/CH4
The experimental data about the viscosity and thermal conductivity of CO2/CH4 are
available at both low and high pressures. However, more data in a larger temperature range are desirable. In addition, no measurements were published concerning the binary diffusion coefficient.
• CO2/H2
The transport properties of the gas mixture, CO2/H2, have been well investigated. In order
to cover the whole T&P window of the CCS chain, some data about the viscosity and the thermal conductivity at high pressures are still required.
• CO2/NOx
There are some data available for the transport properties of CO2/N2O at temperatures
below 500oC and moderate pressures, but measurements at high temperatures and high pressures are required for all transport properties, and all the components (NO, NO2 and
N2O).
• CO2/H2O(/NaCl)
The experimental data about the properties of both liquid and gas mixtures with CO2/H2O
are only available at low temperatures (<80oC) and atmospheric pressure, except the data for the thermal conductivity of gaseous mixtures. Considering the T&P window of CCS, the transport properties of gas mixtures are needed also at high temperatures and high pressures.
• CO2/HCl
Experimental data are only available regarding the viscosity of CO2/HCl at one
temperature (291K). • CO2/CO
There are no available data about the thermal conductivity of CO2/CO. Meanwhile, all of
the data about the viscosity and diffusivity of CO2/CO are measured at temperatures below
473 K at atmospheric pressure. • CO2/Amines
The measured viscosities of CO2/monoethanolamine(MEA), CO2/diethanolamine(DEA)
and CO2/N-methyldiethanolamine(MDEA) are only available at 298K. No experimental
data have been published about the thermal conductivity and diffusion coefficients of CO2/Amine mixtures.
• Multi-component CO2-mixtures.
Most of the experimental data for the multi-component mixtures are about the viscosity. Since the data about multi-component CO2-mixtures are important to verify the property
calculations, more data in large temperature and pressure ranges are desired.
3.2 The precisions, consistency and reliability of experimental data
As experimental measurements are used for model calibration and parameter fitting, it is of great importance to have reliable measurements in order to develop high accuracy models (Reid et al., 1987, Hendriks 2010). ‘Despite the fact that measurements have been conducted over a period of at least 150 years, it was not until around 1970 that techniques of an acceptable accuracy were developed for the measurement of any of the transport properties’ (Wakeham, 1996). Tables A1-A3 in Appendix A show that many of the measurements are published before 1960, for instance
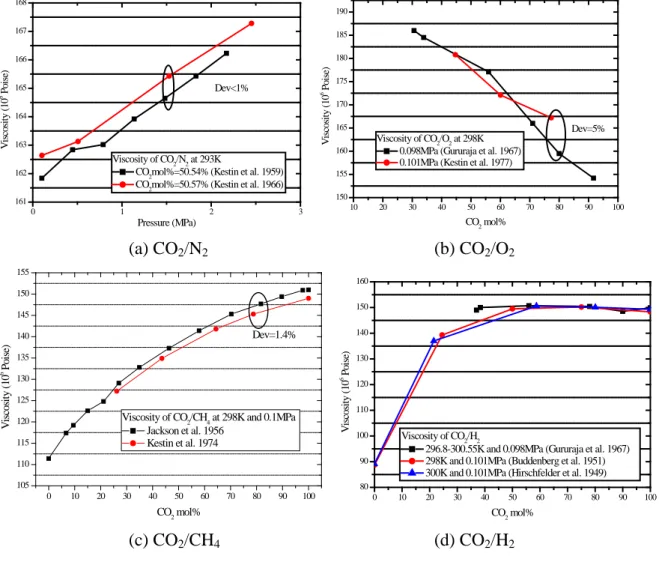
more than 60% of the gas-phase viscosity measurements. There is ample evidence in the literature of very large discrepancies among measurements made prior to that date (Wakeham, 1996). In order to check the precision, consistency and reliability of the published literature, experimental data available in the same ranges of composition, pressure and temperature were compared. The Figs. 1-3 show comparisons of the experimental data which are in the same range in temperature, pressure and composition.
Fig. 1 presents a comparison of the viscosity data. According to the details of the experiments shown in Table A1, the reported experimental uncertainty is below 3% for all the published data. Fig. 1 shows that the experiments published for CO2/N2 (Fig 1a) and CO2/H2 (Fig 1d) are
consistent within the experimental uncertainty. The viscosity measurements for CO2/CH4 show
minor inconsistencies (1.4%). However, deviations up to 5% were found in the data for CO2/O2
(Fig 1b). More accurate measuring techniques were used and a lower experimental uncertainty reported by Kestin et al. (1977). The data by Gururaja et al. (1967) should therefore be used with care, and uncertainties up to 5% expected. The data for CO2/SO2 also show inconsistencies up to
5%. Here, both publications report uncertainties below 1%, which is much smaller than the deviations shown in Fig 1(e). The data by Bhattacharyya and Ghosh (1969) should be preferred, because of the more up to date measuring techniques.
0 1 2 3 161 162 163 164 165 166 167 168 Dev<1% V is cos it y ( 10 6 Po is e) Pressure (MPa) Viscosity of CO2/N2 at 293K
CO2mol%=50.54% (Kestin et al. 1959)
CO2mol%=50.57% (Kestin et al. 1966)
10 20 30 40 50 60 70 80 90 100 150 155 160 165 170 175 180 185 190 Dev=5% V is cos it y ( 10 6 Po is e) CO 2 mol% Viscosity of CO2/O2 at 298K
0.098MPa (Gururaja et al. 1967) 0.101MPa (Kestin et al. 1977)
(a) CO2/N2 (b) CO2/O2 0 10 20 30 40 50 60 70 80 90 100 105 110 115 120 125 130 135 140 145 150 155 Dev=1.4% V is cos it y ( 10 6 Po is e) CO2 mol%
Viscosity of CO2/CH4 at 298K and 0.1MPa Jackson et al. 1956 Kestin et al. 1974 0 10 20 30 40 50 60 70 80 90 100 80 90 100 110 120 130 140 150 160 V is cos it y ( 10 6 Po is e) CO2 mol% Viscosity of CO2/H2
296.8-300.55K and 0.098MPa (Gururaja et al. 1967) 298K and 0.101MPa (Buddenberg et al. 1951) 300K and 0.101MPa (Hirschfelder et al. 1949)
0 10 20 30 40 50 60 70 80 90 100 125 130 135 140 145 150 155 160 Dev=4-5% V is cos it y ( 10 6 Po is e) CO2 mol% Viscosity of CO2/SO2 at 308K and 0.1MPa
Bhattacharyya et al. 1969 Chakraborti and Gray 1965
(e) CO2/SO2
Table 2 Summary of the PTx ranges of available experimental data about the transport properties of CO2-mixture
Mixtures Phase Viscosity Thermal conductivity Diffusion Coefficient
T (K) P (MPa) xCO2 Exp.
Points
T (K) P (MPa) xCO2 Exp.
Points T (K) P (MPa) Exp. Points CO2 G 220-1500 0.1-350 1 300 186-1450 0-200 1 300 194.8-1680 0.1 21 L 219-303 0.6-453 1 300 NA Binary mixtures CO2/O2 G 297-673 0.1 0-1 24 369 and 370 0.2224-0.7301 4 297-1680 0.1 39 CO2/N2 G 289-873 0.1-120 0-1 150 273-1033 0-300 0-1 257 290-1100 0.1 19 CO2/SO2 G 238-353 0.1 0-1 69 323 and 373 0.1-0.9015 9 263-473 0.1-2 5 CO2/H2S G/L NA NA NA CO2/Ar G 293-673 0.1-2.5 0-0.92 135 273-473 0.1-11.3 0-1 170 273-473 0.1 11 CO2/CH4 G 293-673 0.1-68 0-1 230 228.13-433 0.1-17.68 0.075-0.878 210 NA CO2/H2O G 303 0.1 0.962-0.985 8 298-603 0.1 0-1 41 307-352 0.1 5 L 273-313 0.1-30 0-0.0295 71 NA 279-348 0.1-0.4 40 CO2/CO G 298-473 0.1 0.3141 & 0.7654 10 NA 296-473 0.1 9 CO2/HCl G 291 0.1 0-1 8 NA NA CO2/N2O G 298-550 0.1 0-1 34 300.65-723 0..-4.25 0-1 90 194.8-362.6 0.1 6 CO2/H2 G 291-1100 0.1-0.3 0-1 65 258-893 0.1-7.5 0-1 120 291-1100 0.1 25 Multi-component mixtures CO2/N2/O2 G 291-1100 - 0.062-0.507 34 370 - 0.304 1 NA CO2/H2/O2 G 296-299 - 0.092-0.78 12 NA NA CO2/N2/Ar G 298-873 0.1 0.2551-0.5289 20 NA NA CO2/N2/CH4 G 298-473 0.1 0.1953-0.5588 12 NA NA CO2/H2O/NaCl L 273-278 0.1-30 0-0.913 * 90 NA NA CO2/N2/O2/N2O G 313-413 - 0,1-0,25 12 NA NA CO2/O2/N2/H2 G 300.5-1279 - 0.108 4 NA NA CO2/O2/N2/CO/H2 G 307.5-1287 - 0.06-0.067 12 NA NA CO2/CH4/N2/CO/H2 G 293 - 0.087-0.106 3 NA NA CO2/O2/CH4/CO/N2/H2 G 293-1282 - 0.017-0.048 14 NA NA CO2/Air G NA NA 273-317.2 - 3 CO2/MEA/H2O L 295 - 0-0.5* 44 NA NA CO2/DEA/H2O L 295 - 0-0.5 * 44 NA NA CO2/MDEA/H2O L 295 - 0-0.64* 44 NA NA CO2/MEA/H2O L 295 - 0-0.5* 44 NA NA CO2/DEA/MDEA/H2O L 295 - 0-0.5* 33 NA NA * CO 2 loading (mol/mol)
Fig. 2 presents the comparison of the thermal conductivity data. The experimental data from different sources are consistent for CO2/H2 and CO2/H2O at high CO2 concentrations as shown in
Fig 2a and 2b. Some minor discrepancies were identified in the experimental data of CO2/Ar as
shown in Fig. 2c. Compared to Yorizane’s data (Yorizane, 1983), the values measured by Kestin and Ro (1982a) are about 5% higher at pressures lower than 3MPa and at pressures higher than 7MPa. Considering the slight difference in CO2 concentration, the deviations may be acceptable.
Larger inconsistencies are observed in the experimental data of CO2/H2O mixtures at low CO2
concentrations. For CO2/H2O, the deviation is up to 4% based on Kulakov’s data (Kulakov, 1955).
More experiments are necessary to verify the accuracy of these data.
0 20 40 60 80 100 0 20 40 60 80 100 120 140 160 180 T he rm al C onduc ti vi ty ( 10 -3 W /m .de g) CO2 mol% CO2/H2 at 0.1MPa 273.16K (Weber 1917) 273.25K (Mukhpadhyay et al. 1967) 273.15K (Ibbs and Hirst 1929)
0 20 40 60 80 100 18.5 19.0 19.5 20.0 20.5 21.0 21.5 22.0 22.5 T he rm al C onduc ti vi ty ( 10 -3 W /m .de g) Dev=4% CO2 mol% CO2/H2O at 0.1MPa 338.15K (Kulakov et al. 1955) 333K (Dijkema et al. 1972) (a) CO2/H2 (b) CO2/H2O 0 1 2 3 4 5 6 7 8 9 10 11 16 18 20 22 24 26 28 T he rm al C onduc ti vi ty ( 10 -3W /m .de g) Dev=5.6% Dev=5.6% Pressure (MPa) CO2/Ar 296K, CO2=52.04 mol% (Kestin 1982) 298K, CO2=50 mol% (Yorizane, 1983) 298K, CO2=50.3 mol% (Yorizane, 1983) (c) CO2/Ar
Figure 2 Comparison of experiments about the thermal conductivities of CO2-mixtures
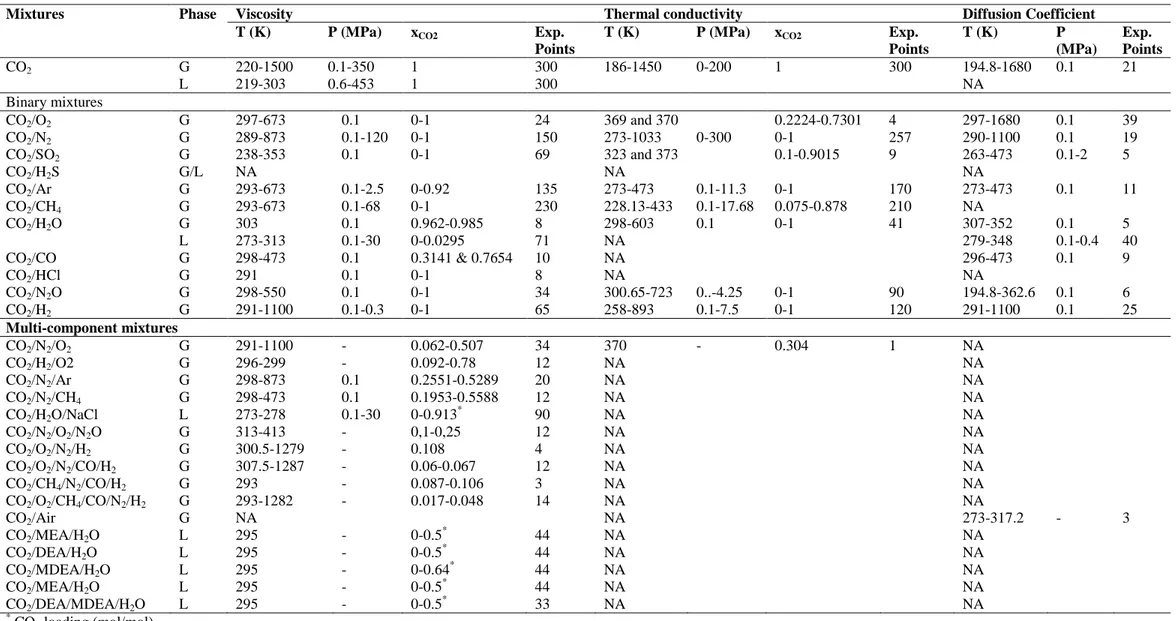
Fig. 3 presents a comparison of the diffusion coefficient data. Few of the sources for the diffusion coefficient data have presented the experimental inaccuracy in their results (Table A3). According to the comparison of the experimental data for CO2/CO2 (Fig. 3c), CO2/Ar (Fig. 3d), CO2/SO2
(Fig. 3e), and CO2/N2O (Fig. 3f) the experimental data for these mixtures are observed to be
consistent. For the mixture CO2/H2, the published data from Gavril et al. (2004) and Ivakin and
Suetin (1964a, 1964b) are consistent, while the data by Boyd et al. (1951), on the other hand, display deviations over 20% (Fig. 3a), which shows that this source should be avoided. For CO2/N2 at temperatures close to 300K, the diffusion coefficients measured by Boyd et al. (1951)
agree with the measurement by Walker and Westenberg (1958a). However, compared to the measurements by Giddings and Seager (1962), discrepancies of 15-20% are observed. In addition, the diffusion coefficients of CO2/H2O have been studied by many researchers. In general, the
measured values are consistent, except for that of Nijsing et al. (1959). As shown in Fig 3g., the difference between the data by Unver and Himmelblau (1964) and the data by Nijsing et al. (1959) may be up to 85%.
300 350 400 450 500 0.6 0.8 1.0 1.2 1.4 1.6 D if fus ion C oe ff ic ie nt ( cm 2 /s ) Temperature (K) CO2/H2 at 0.1MPa Gavril 2004 Ivakin and Suetin 1964 Boyd et al. 1951
(including some points from other sources)
Dev>20% 280 290 300 310 320 0.10 0.12 0.14 0.16 0.18 0.20 0.22 0.24 0.26 0.28 0.30 D if fus ion C oe ff ic ie nt ( cm 2/s ) Temperature (K) CO2/N2 at 0.1MPa
Ivakin and Suetin 1964 Walker and Westenberg 1958 Boyd et al. 1951
(including some points from other sources) Giddings and Seager 1962
Dev: 15-20% (a) CO2/H2 (b) CO2/N2 200 220 240 260 280 300 320 340 360 0.00 0.05 0.10 0.15 0.20 D if fus ion C oe ff ic ie nt ( cm 2/s ) Temperature (K) CO2/CO2
Amdur et al. 1952 at 0.03-0.07MPa Winn 1950 at 0.1MPa 280 300 320 340 360 380 400 420 440 460 480 0.10 0.15 0.20 0.25 0.30 0.35 0.40 D if fus ion C oe ff ic ie nt ( cm 2/s ) Temperature (K) CO2/Ar at 0.1MPa
Ivakin and Suetin 1964 Holsen and Strunk 1964
(c) CO2/CO2 (d) CO2/Ar 260 280 300 320 340 360 380 400 420 440 460 480 0.05 0.10 0.15 0.20 D if fus ion C oe ff ic ie nt ( cm 2/s ) Temperature (K) CO2/SO2 Schafer 1959 at 0.03-0.1MPa Gray and Maczek 1968 at 0.1MPa
180 200 220 240 260 280 300 320 340 360 380 0.00 0.05 0.10 0.15 0.20 D if fus ion C oe ff ic ie nt ( cm 2/s ) Temperature (K) CO2/N2O at 0.1MPa Amdur et al. 1952 Wall and Kidder 1946
(e) CO2/SO2 (f) CO2/N2O 260 270 280 290 300 310 320 330 340 350 0 1 2 3 4 5 6 Dev=85% Temperature (K) D if fus ion C oe ff ic ie nt ( 10 -5cm 2/s ) CO2/H2O at 0.1MPa Pratt et al. 1973 Unver and Himmelblau 1964 Choudhari and Doraiswarmy 1972 Thomas and Adams 1965
Malik and Hayduk 1968 *
Frank et al. 1996 (0.4MPa) Nijsing et al. 1959
Schwertz and Brow 1951 (Vapor H2O)
Tang and Himmelblau 1965 *
* Including data from other sources
(g) CO2/H2O
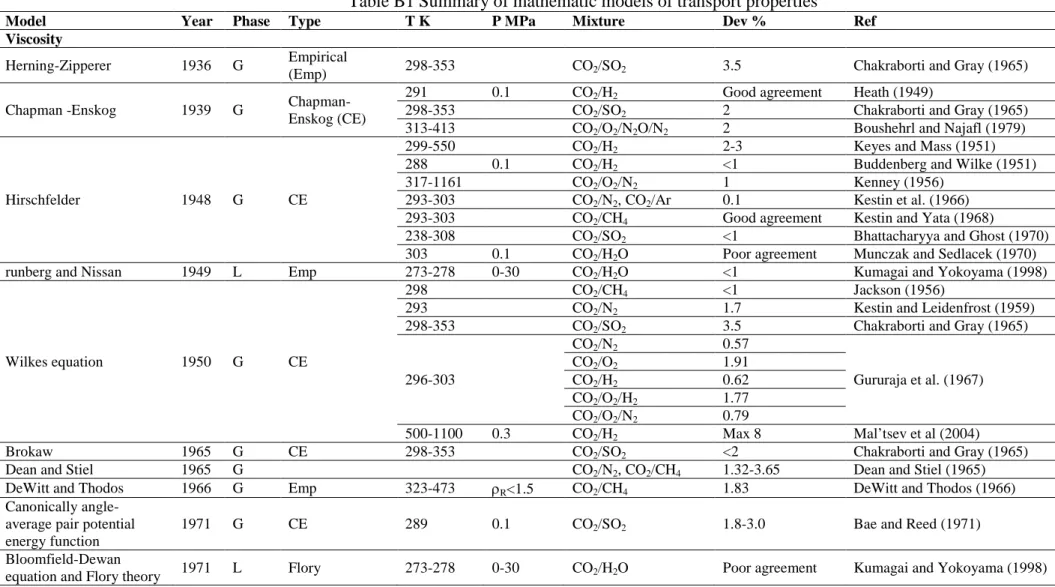
4 Available transport property models
In this section, a review of the existing transport property models which have been proposed, tested and evaluated for CO2 and CO2-mixtures in the literature will be presented. An overview of
the investigated models is shown in Appendix B (Table B1).
4.1 Transport property models for pure CO2
Models for the viscosity and thermal conductivity of pure CO2 were developed by Vesovic et al.
(1990). The model equations have the following functional form:
(
T)
X( )
T X(
T)
X(
T)
X , , C ,
0 ρ ρ
ρ = +∆ +∆ Eq. 1
Here, the first term, X0(T), is the contribution to the transport property in the limit of zero-density,
where only two-body molecular interactions occur. The final term, ∆cX(ρ,T), is the critical
enhancement that arises from the long-range fluctuations which occur in a fluid near its critical point and contribute to divergences of both the viscosity and thermal conductivity at that singular point. Finally the term ∆X(ρ,T), the excess property, represents the contribution of all other effects to the transport property of the fluid at elevated densities including many-body collisions, molecular-velocity correlations, and collisional transfer. The correlation by Vesovic et al. (1990) covers a temperature range of 200K-1500K and a pressure range of 0.1-100MPa. In general, the estimated deviation for the viscosity of pure CO2 is less than 5% for gas and supercritical phases.
Owing to the inconsistencies between the available experimental liquid viscosity data, the uncertainty for the liquid-phase was originally around 7%. In 1998, Fenghour et al. (1998) revised the published equations by including new reliable measurements and omitting inconsistent sources for the liquid CO2 viscosity. The resulting overall viscosity representation for pure CO2
covers the temperature range of 200-1500K and pressures up to 300MPa. The uncertainties associated with the proposed representation vary from ±0.3% for dilute gas near room temperature to ±5.0% at the highest pressures. The Figs. 1-3 show that the transport properties of mixtures may be considerably different from those of pure CO2, and for high accuracy, mixture models
should be preferred.
4.2 Viscosity models for mixtures 4.2.1 Gas mixtures
The viscosities of gases are strong functions of pressure near the critical point and at reduced temperatures of about 1 to 2. For diluted gases, the viscosity will increase with temperature. At high reduced pressures however, there is a wide range of temperatures where the viscosity decreases with temperature. In this region the behavior of the viscosity more closely resembles the liquid state. At very high reduced temperatures, there is again a condition in which pressure has little effect and viscosities increase with temperature. Acceptable models for gas-phase viscosities should be able to handle all these features. The theoretical models are mainly divided in two categories. One approach is based on the principle of corresponding states, in which the reduced viscosity is linked to a reduced pressure and temperature. The other approach has its foundation in kinetic gas theory and is known as Chapman-Enskog theory.
Once the viscosities of the pure components are available, several techniques have been developed to estimate the viscosity of mixtures. Examples are the method by Reichenberg (1974, 1975, 1977) and the method by Wilke (1950) which neglects second order effects. In corresponding state-methods for mixtures, it is common to estimate mixture properties from the pure properties, the composition and various mixing rules. Examples are the procedure by Lucas (1980, 1984), and the procedure by Chung et al. (1984, 1988).
4.2.1.1 Chapman-Enskog theory for the gas-phase viscosity of CO2-mixtures
The Chapman-Enskog (CE) theory requires an estimate of the collision diameters and the collision integrals to evaluate the viscosity of gases. The first applications of the CE-theory
evaluated the collision integrals with simplified functions of temperature. Chapman and Cowlings expression for the viscosity (Chapman, 1939) was for instance used by Heath (1949) to calculate the viscosity of binary mixtures, including H2/Ar, He/N2, He/CO2, H2/Ar, H2/N2 and CO2/H2. The
calculations based on CE-theory were in good agreement with experiments conducted at 291 K and 0.1 MPa.
Since the simplified collision integrals used in the first applications of the CE-theory were considered artificial and unrealistic, Hirschfelder developed a new method using the more realistic 6-12 Lennard-Jones energy potential (Hirschfelder et al., 1948, 1954) to estimate the collision integrals. The new method is based on the solution of the Boltzmann equation for the molecular distribution, as carried out by Chapman and Enskog. The results obtained by this method are applicable at low pressure and apply strictly only to monatomic gases. Buddenberg and Wilke (1951) used Hirschfelder’s equation to calculate the viscosity of CO2/H2 mixtures at 298K and
0.1MPa. The calculated results from both equations agreed very well with the experimental data, with an AAD of less than 1%. Hirschfelder’s equation was also used to calculate the viscosities of CO2/H2 by Keyes and Mass (1951). In all cases, the agreement was satisfactory. For example,
almost perfect accordance was obtained at 299K, while at 550K the viscosity in a mixture with 19.93% H2 was 2.7% larger than the calculated. The mixture with 41.29% H2 was 2.5% larger,
and the mixture with 78.5% H2 was 2.1 % larger than the calculations.
The viscosities of CO2/Ar and CO2/N2 at 293 and 303K were studied by Kestin et al. (1966) using
Hirschfelder’s approach. The analysis of the experimental data showed that for CO2/N2, it is
possible to obtain a single set of optimum values of the mixture parameters which correlate the variation of viscosity with composition, when the viscosities of the pure components are known. For CO2/Ar, a separate set must be used for each temperature. Moreover, it was also concluded
that Hirschfelder’s approach provides an excellent approximation to the viscosity of the binary mixtures CO2/Ar and CO2/N2. If the viscosity of a binary mixture was computed with known
values for the viscosities of the pure substances and an interaction term, the calculations revealed deviations in the order of 0.1% and reproduced the measured data with an uncertainty which is comparable to that of the measurements. In 1968, Kestin and Yata (1968) did a similar work regarding the CO2/CH4 mixture. Their results also showed good agreement between experimental
data and predicted values.
Bhattacharyya and Ghosh (1970) studied the viscosities of polar-quadrupolar gas mixtures in 1970. Their results show that the viscosity of binary polar-quadrupolar gas mixtures can be represented satisfactorily by Hirschfelder’s approach without taking into consideration the inelastic collisions. The average absolute deviation (AAD) of the viscosities of the CO2/SO2
mixture in the temperature range 238-308K was less than 1%. In addition, the agreement between the experimental and the calculated values was more or less the same for the Lennard-Jones (6-12) and the 12-6-4 representations of the unlike interactions.
The changes in the viscosity of CO2 resulting from the addition of a defined fraction of water
vapor have been investigated at 303K and at atmospheric pressure, by Munczak and Sedlacek (1970). Here, Hirschfelder’s approach did not successfully predict the viscosity of water vapor and CO2, since the theoretical curves did not follow the relatively large changes in the viscosities
occurring with a small variation of the water vapor concentration.
Boushehrl and Najafi (1979) studied the viscosity of the four component mixture N2/CO2/O2/N2O
in the temperature range 313-413K. Compared to the measurements, the deviations of the values predicted by the CE-theory and its extension to multicomponent mixtures are within ±2%. By comparing the method with the experimental data of some multi-component mixtures involving CO2, the agreement in more than half of the examples is excellent. However, in some of the other
mixtures there is a considerable discrepancy which might be explained on the basis of errors in the experimental gas analysis. For ternary mixtures containing CO2, O2 and N2, Kenney et al. (1956)
about 1% in the temperature range 317-1161K. Here it was concluded that the Hirschfelder method may be used to calculate accurately the viscosity of gas mixtures within and also outside this interval, since the model was accurate over a wide range of temperatures.
For polar gas-mixtures, the properties of the mixtures may be more difficult to predict, mainly because the interactions between polar molecules are so complex that a suitable potential function is difficult to obtain. Furthermore, collision integrals containing orientation dependence are difficult to compute. Alternatives to the Lennard-Jones energy potential have, thus, been used in the Hirchfelder approach. The most extensively used potential for polar molecules has been the Stockmayer potential in which the angle-dependent dipole-dipole interaction is added to the Lennard-Jones (6-12) potential. The canonically angle-averaged pair potential energy with temperature dependent parameters can also be used to calculate the viscosity and diffusion coefficients of polar-polar and polar-nonpolar gas mixtures, for example CO2/SO2. The
canonically angle-averaged pair potential proved to be as successful as the Stockmayer potential in correlating the transport properties of polar gases (Bae and Reed, 1971). For CO2/SO2 mixtures,
the absolute deviations were 1.8% and 3.0% compared to the experimental data from Jung and Schmick (1931) and Schafer (1959) respectively.
In a further simplification of the kinetic theory approach, Wilke neglected second order effects and proposed a general equation for the viscosity as a function of molecular weights and the viscosities of the pure components of the mixture (Wilke, 1950). Wilke’s equation was also used by Jackson to calculate the viscosity of CO2/CH4 (Jackson, 1956). At 298K, the AAD was less
than 1%. Kestin and Leidenfrost (1959) tested Wilke’s equation regarding the viscosity calculations of the CO2/N2 mixture at 293K in 1959. The average deviation was about 1.7%.
However, Gururaja et al. (1967) also evaluated Wilke’s equation based on the experimental data of CO2/N2. Their results showed that the AAD in the temperature range 296-303 K was only
0.57%. A Comparison of the experimental data from both references shows some discrepancies as shown in Fig. 1b. In addition, Gururaja et al. (1967) studied the viscosities of CO2/O2, CO2/H2,
CO2/O2/N2 and CO2/O2/H2. The results show that the AAD of Wilke’s equation in the temperature
range 296-303K is 1.91% for CO2/O2, 0.57% for CO2/N2, 0.62% for CO2/H2, 1.77% for
CO2/O2/H2, and 0.79% for CO2/O2/N2. Mal’tsev et al. studied the viscosity of CO2/H2 at high
temperatures (500, 800 and 1100K) (Mal’tsev et al., 2004). At a pressure of 0.3MPa, the results calculated by Wilke’s equation are higher than the measurements and the maximum deviation is almost 8%.
4.2.1.2 Corresponding state theory for the gas-phase of CO2-mixtures
The Kestin-Ro-Wakeham (KRW) law of corresponding states was developed by Kestin et al. (1972a and 1972b) based on the working hypothesis that the inter-molecular force potentials of all monatomic gases and of their binary mixtures differ so little that they can be shrunk to a single diagram with the aid of a linear scaling factor and an energy scaling factor. It follows that all equilibrium and transport properties of monatomic gases and of their mixtures can be calculated on the basis of the Chapman-Enskog solution of Boltzmann’s equation with the aid of universal, empirically determined collision integrals. The KRW scheme was used to calculate the viscosity of the mixtures CO2/N2, CO2/Ar, CO2/CH4, CO2/N2O, CO2/N2/Ar, and CO2/N2/CH4 (Kestin and
Ro, 1976, 1982b). The agreement between the KRW law and the experiments was within a maximum error of 1% in the temperature range 298-873K.
Another corresponding states procedure used to predict the viscosity of CO2/N2 was proposed by
Hanley (1976) in 1976. The work showed that the transport properties can be calculated to within the experimental error given only corresponding values for a reference fluid and equation of state data. With methane as the reference fluid, the viscosity of CO2/N2 was calculated at 289K and in
the pressure range 2-12MPa. The deviations rose with pressure, from 0% at 2MPa to 7.8% at 12MPa.
The viscosities of eighteen binary gaseous systems, including CO2/O2, were described with the aid
of the CE-solution of the Boltzmann equation, supplemented by an extended law of corresponding states, and three pairs of scaling parameters by Kestin et al. (1977) in 1977. They claimed that the standard deviation between the experimental data and the calculated values was about ±0.3% in the temperature range 298-674K, which is comparable to the experimental uncertainty.
4.2.1.3 Empirical models and other models for the gas-phase of CO2-mixtures
In addition to the semi-empirical methods above, some empirical correlations have been developed. A special correlation was proposed by DeWitt and Thodos for the CO2/CH4 mixture
with ρR<1.5 (Jossi, 1962). 128 experimental viscosities for methane, carbon dioxide and three
compositions in the temperature range of 323-473K produced an average deviation of 1.83%, with a maximum deviation of 3.82%.
Dean and Stiel (1965) developed a model for the calculation of the viscosity of nonpolar gas mixtures at moderate and elevated pressures from the molecular weights and critical constants of the components. Using available experimental data and appropriate pseudocritical constant rules, results obtained previously for the viscosity of pure gases have been extended to mixtures. The average deviations of CO2/N2 and CO2/CH4 are in the ranges 1.32-3.28% and 3.23-3.68%
depending on the different methods used to calculate the pseudocritical critical constants and viscosity parameters.
4.2.1.4 Comparison of methods from different categories
Chakraborti and Gray (1965) investigated the viscosity of CO2/SO2 at temperatures between
25-80oC. Four methods, including Hirschfelder’s approach, Brokaw’s equation (Brokaw, 1965), the empirical Herning and Zipperer’s equation (Herning and Zipperer, 1936) and Wilke’s equation (Wilke, 1950), were evaluated. The results show that Hirschfelder’s approach underestimated the experimental values by about 2%. Brokaw’s equation gave the best accuracy, with an AAD of less than 2%. The AAD of Herning and Zipperer’s equation and Wilke’s equation were about 3.5%.
4.2.2 Liquid mixtures
For a temperature range from the freezing point to somewhere around the normal boiling temperature, it is often a good approximation to assume that the logarithm of the viscosity of liquids is linear in the reciprocal absolute temperature (Reid et al., 1987).
In general, pure liquid viscosities at high reduced temperatures are usually correlated with some variation of the law of corresponding states, such as the model by Sastri (1992). At low temperatures, most methods are empirical and involve a group contribution approach. Current liquid mixture correlations are essentially mixing rules relating pure component viscosities to composition. Little theory has been shown to be applicable to estimating liquid viscosities within a reasonable accuracy (Reid et al., 1987). Generally, almost all methods to estimate or correlate liquid mixture viscosities assume that values of the pure component viscosities are available. Thus the methods are, in reality, interpolative. Nevertheless, there is no agreement on the best way to carry out the interpolation. Irving (1977) surveyed more than 50 equations for binary liquid viscosities and classified them by type. He pointed out that only very few do not have some adjustable constant that must be determined by experimental data and the few that do not require such a parameter are applicable only to systems of similar components with comparable viscosities. He recommended the one-constant Grunberg-Nissan equation as being widely applicable with reasonable accuracy except for aqueous solutions (Grunberg and Nissan, 1949). To evaluate quantitatively the results of gas-liquid absorption experiments, accurate liquid-phase viscosities are vital. For this purpose, Frank et al. (1996) measured the viscosities of CO2/H2O
mixtures, from 293-333K. The measured viscosity of CO2/H2O was correlated to Arrhenius type
functions, with an AAD less than 1%. Kumagai and Yokoyama (1998) studied the viscosity of aqueous solutions of CO2 along three isotherms at 273, 276 and 278 K for pressures up to 30MPa.
The experimental values were compared with the correlation proposed by Kanti et al. (1991) derived from the Bloomfield-Dewan equation (Bloomfield and Dewan, 1971) and the theory by Flory et al. (1964, 1965). The results show that the equation is in poor agreement with the experimental data, but the equations of Kanti et al. (1991) and of Grunberg and Nissan (1949) with one adjustable parameter give good agreement. The AAD was for many cases less than 1%, with a maximum deviation of -2.2%. Kumagai and Yokoyama (1999) measured the viscosity of aqueous NaCl solutions containing CO2 along three isotherms at 273, 276 and 278 K at pressures
up to 30MPa. The experimental values were correlated in terms of pressure, temperature and concentrations of NaCl and CO2. The correlation reproduced the experimental values within
±1.3%. The viscosity of aqueous NaCl solutions with dissolved CO2 was measure at conditions
representing an underground aquifer at a depth of 1000-2000m for the geological storage of CO2
(i.e., 30 to 60oC and 10 to 20 MPa) at a mass fraction of NaCl between 0 and 0.03 by Bando et al. (2004). On the basis of the experimental data, an empirical equation for predicting the viscosity of CO2/H2O/NaCl was correlated as a function of the temperature and mole fraction of CO2. The
correlation has deviations of ±5%. 4.3 Thermal conductivity models
The first approximation to the rigorous kinetic theory of gases accounts successfully for the thermal conductivity of mixtures containing monatomic gases (Hirschfelder, 1954). For binary mixtures of polyatomic gases Hirschfelder (1957) suggested that the total thermal conductivity of each constituent can be written as a sum of a translational contribution and an internal (rotational and vibrational) contribution. The translational contribution to the thermal conductivity of a mixture is calculated as if the individual gases were all monatomic. The internal contribution to the thermal conductivity of the mixture is then calculated from the equation:
2 12 1 22 int , 2 1 12 2 11 int , 1 int 1 1 x D x D K x D x D K K + + + = Eq. 2
Here, xi is the mole fraction of component i and D is the diffusion coefficient. In addition to
several attempts to extend the approximations to a rigorous theory, several formulas have been suggested. One of the most successful expressions with a theoretical foundation which accounts for the thermal conductivity of mixtures was purposed by Wassiljewa (1904.):
∑
∑
+ = i j i j ij i mix x x A K K 1 Eq. 3Here Kmix and Ki are the thermal conductivities of the mixture and pure component i respectively
and Aij is one of a set of adjustable parameters. The simple physical interpretation of Aij is that it
is a measure of the ratio of the efficiencies with which molecules j and i impede the transport of heat by molecule i. It has also been shown that the first approximation to a rigorous theory reduces to the Wassiljewa form (Eq. 3) (Wassiljewa, 1904) with Aij depending only slightly on
composition. In practice, Aij can be treated as if independent of composition and could be
calculated from the approximation of Lindsay and Bromley equation (Lindsay and Bromley, 1950), or it could be estimated from experiments.
4.3.1 Semi-empirical models 4.3.1.1 Hirschfelder’s Equation
Based on Hirschfelder’s equation (Eq. 2), Brokaw (1959) calculated the thermal conductivity of CO2/N2 in the temperature range 273-1033K. The force constants characterizing the CO2/N2
interaction were computed in two ways: (i) using the standard combining rules and (ii) using Walker and Westenberg’s methods (1958). Compared with experimental data, method (i) gave good agreement at low temperatures and method (ii) gave good agreement at high temperatures. Westenberg and DeHaas (1962) evaluated two methods regarding the calculations of the thermal conductivity of the CO2/N2 mixture. Both methods were based on Hirschfelder’s equation. For the
first method (i) all the parameters involved in Hirschfelder’s equation were from experiments, either directly or indirectly through experiments combined with established relations form kinetic theory. Unfortunately, the experimental values were typically not available. For the second method (ii), they used viscosity force constants to compute the necessary quantities as outlined, together with the theoretical Eucken correction. For CO2/N2 in the temperature range of
294-1000K, method (i) gave much better results than method (ii), especially at high temperatures. Method (i) did however always overestimate the thermal conductivity, and its average deviation exceeded slightly 10%.
Mathur and Saxena (1966) studied the thermal conductivities of 59 mixtures of 13 different gas pairs, including CO2/N2 and CO2/H2, based on Hirschfelder’s theory. The results showed good
overall agreement. However, compared to the experimental data, the deviations of the CO2/N2
mixture were between 6.4-7.8% at the temperature 323.16K and the deviations of CO2/H2 were
between 2.2-3.5% at the temperature 273.16K.
Mukhopadhyay et al. (1967) used Hirschfelder’s equation to calculate the thermal conductivity of CO2/H2. The experimental values in the temperature range 258-473K were 5-8% lower than the
calculated results, assuming local chemical equilibrium. The situation could be improved when the experimental values for the thermal conductivities of the pure components were used and in this case the mean deviation increased only from 1% to 5% as the temperature increased from -15 to 200oC.
Barua et al. (1968) used Hirschfelder’s equation to calculate the thermal conductivities of CO2/Ar
and CO2/N2. In the temperature range 273-473K, the deviations were, on average, about 3% for
the CO2/Ar system and about 4% for the CO2/N2 systems. A modified Hirschfelder’s equation,
which includes the experimental values for the thermal conductivities of the pure components instead of calculated values, was also evaluated. It gave slightly better results than the original Hirschfelder’s equation. The improvement of the AAD was about 0.3%. Later, Saxena and Gupta (1970) conducted experiments to measure the thermal conductivities of CO2/N2O. A comparison
of Hirschfelder’s equation with LennardJones potentials showed that the deviations were -2.0~9% in the temperature range 300-750K.
The thermal conductivity of 126 different binary mixtures, including CO2/SO2, was investigated
by Maczek and Gray (1970) with Hirschfelder’s equation. The deviation was, on average, -3.45% for all the mixtures. For CO2/SO2, the deviations were in the range 0-3%. The modified
Hirschfelder-Eucken equation with realistic estimates of the inelastic collisions provided even better predictions (less than 2%). The Saksena formulation (Maczek and Gray, 1969) gave the best results for CO2/SO2, with average deviations less than 1%.
The equation developed by Mason, Monchick and Pereira (Monchick, 1965) based on kinetic-theory was used by Kestin et al. (1983) to calculate the thermal conductivity of CO2/H2 at 297K.
The results showed that this equation represented the experimental thermal conductivity data with an absolute deviation up to 4%. This is much higher than the uncertainty (±0.4%) of the empirical equation which correlates the density to calculate the thermal conductivity. In addition, Monchick et al (1965) extended the treatment of Mason and Monchick’s method (1962) to the case of polyatomic gas mixtures incorporating both relaxation and cross-relaxation into the general frame work of the theory. This new method gave the same accuracy as the modified Hirschfelder’s equation for both CO2/Ar and CO2/N2. The same method was used by Johns et al. (1989) to
rule for the pseudoradial distribution function, second virial coefficients and the ratios of collision integrals. Deviations larger than 5% were identified in a temperature range of 302-470K and a pressure range of 0.9-30.8MPa.
4.3.1.2 Wassiljewa’s equation
An alternative to Hirschfelder’s equation is to use the Wassiljewa equation (Eq. 3). Here, Lindsay and Bromley (1950) developed a correlation for the Aij-factors. The Lindsay-Bromley correlation
was first used to calculate the thermal conductivity of CO2/H2. At 273 and 296 K, the deviations
were between -0.2~8.4%. In 1951, Bromley and Wilke (1951) used the correlation to calculate the thermal conductivity of CO2/N2. Compared to the experimental thermal conductivity of CO2/N2
measured by Rothman and Bromley (1955) in the temperature range 369-688oC, the maximum deviations for the Lindsay-Bromley equation values were -1% at 642K, -1.1% at 645K, -1.9% at 648K, -1.5% at 745K and about -3% at higher temperatures. Keyes and Mass (1952) studied the thermal conductivity of the CO2/N2 mixture between 323 and 623K. They found that the
semi-empirical formula of Lindsay and Bromley (1950) (AAD=1.36%) had a better accuracy than the Enskog theory (Keyes, 1951) (AAD=3.43%). Gilmore and Comings (1966) arrived at the same conclusion at high pressures. At a pressure of 17.6MPa, even though the maximum deviation of the Lindsay-Bromley correlation can be up to 30%, the results are ‘significantly better than those calculated by Enskog equation’. Gray and Maczek (1968) calculated the thermal conductivity of CO2/SO2. The method of Wassiljewa with experimental Aij gave the best accuracy, and the
average discrepancy was less than 0.5% at 50 and 100oC. It was better than Hirschfelder approximation and the combination of Wassiljewa method and Aij calculated from the
Lindsay-Bromley formula, which had average discrepancies between -1.16~-1.56% and 2.17~2.53% at 323 and 373K respectively.
4.3.1.3 Other methods
An approximate formula for the thermal conductivity of multicomponent gas mixtures was derived from the rigorous kinetic theory by well defined approximations by Mason and Saxena (1958). Numerical calculations with the formula are relatively simple, and the only data needed are the molecular weights, thermal conductivities, and either viscosities or heat capacities of the pure components at the same temperature as the mixture. The form of the formula is quite similar to the previously described semi-empirical Lindsay-Bromley correlation. The formula was tested by comparing it to experimental results for multiple binary and ternary mixtures involving both monatomic and polyatomic nonpolar gases. For CO2/N2 systems, the viscosities needed in the
calculations were obtained from Keyes’s empirical equations (Keyes, 1951). The AAD was 4.6% in the temperature range 323-961K, which is similar to the behavior of the Lindsay-Bromley formula (1950).
Based on the formal kinetic theory developed by Monchick et al. (1963), Monchick et al. (1965) calculated the thermal conductivity of polyatomic and polar gas mixtures, including CO2/N2. Two
assumptions were necessary to obtain usable mixture-models. They neglected complex collisions and assumed no correlation between the internal energy states and the relative velocities. With these assumptions plus suitable definitions of the internal diffusion coefficients and relaxation times, the model was obtained. For the CO2/N2 systems, the experimental data agreed well with
the calculations at 300K and 500K, and was within the experimental uncertainty (2%). At high temperatures like 1000K however, the deviations became larger.
Johns et al. evaluated the corresponding-states method by Ely and Hanley (1983) called the TRAPP methodology, which is analogous to the extended corresponding states viscosity model (Ely and Hanley, 1981) for the thermal conductivity of CO2/CH4. In a temperature range of
302-470K and a pressure range of 0.9-30.8MPa, the comparison showed that all the predictions by the TRAPP methodology were within ±3% of the experimental points.
An approximate method, an empirical one, a semi-theoretical one, and the procedure by Lindsay and Bromley were examined for the prediction of the thermal conductivity of polar/non-polar gas mixtures by Tondon and Saxena (1968). With a modification of the approximate method, the deviations could be reduced to 2%. The study was about 12 different systems, including the gaseous mixture CO2/H2O.
The experimental data for the thermal conductivity of six binary gaseous mixtures containing water as a component, including CO2/H2O, were compared to a Wassiljewa-type formula
(Dijkema et al. 1972). No agreement was, however, obtained with values calculated from four different theories based on this formula, Gruss and Schmick (1928), Lindsay and Bromley (1950), Mason and Saxena (1959) and Brokaw (1961), at temperatures between 298 and 333K.
Experimental results for the thermal conductivities of CO2/Ar and CO2/CH4 were compared by
Yorlzane et al. (1983) with the values calculated by the Wassiljewa equation, in which the Mason-Saxena equation (1958.) was used as a combination factor with values predicted by the Stiel-Thodos (1964.) equation extended to binary gas mixtures. Both methods were found to represent the measurements within a maximum deviation of 5% at temperatures 25 and 35oC and pressures up to 9MPa.
Correlations based on equations derived from kinetic theory have been developed by Cheung et al. (1962) for the thermal conductivity of gas mixtures. For mixtures of polyatomic molecules, the energy transport is divided in two parts, where one comes from collisions and the other from diffusion. When compared with the experimental data for 226 binary mixtures, including CO2/O2
and CO2/N2/O2, for temperatures between 273.15 and 1047K, the obtained average deviation was
2.1%.
The resulting thermal conductivities for the dense gaseous state and the corresponding thermal conductivities of the dilute gas at atmospheric pressure for the binary system CO2/CH4 were
correlated to a unique formula for this system by Rosenbaum and Thodos (1969). This formula was applied for the calculation of thermal conductivities which, when compared with corresponding experimental values, produced an average deviation of 2.24% in the temperature range 333-433K and in the pressure range 3.28-6.89MPa.
Andreev and Mal’ter (1975) correlated an empirical equation for the calculation of the thermal conductivities of gas mixtures. It was tested for 47 mixtures, including CO2/H2. The mean-square
deviation for these data was 4.3% (maximum deviation was 13.7%). The absolute deviations for CO2/H2 (50/50mol%) were slightly above 1% at 273 and 893K.
Kestin et al. proposed an empirical correlation for the calculations of thermal conductivities of CO2/Ar (1982), CO2/H2 (1983) and CO2/N2O (1984). Their conductivity data have been used in a
statistical analysis (de Groot et al., 1978.) to extract optimum values for the coefficients in a virial expression for the density. Compared to the experimental data, the deviations are within ±0.5% for CO2/Ar in the density range 10-250kg/m3, ±0.4% for CO2/H2 in the density range 8-75kg/m3
and ±0.7% for CO2/N2O in the density range 10-100 kg/m3 at 296K.
Johns et al. (1988) also fitted the thermal conductivity data of CO2/N2 to polynomials of different
degrees using increasing number of points by a procedure described by Kestin (1971) to obtain coefficients for the density expansion of the thermal conductivity in a temperature range of 302-470K and a pressure range of 0.9-30.8MPa. The scatter of the experimental points around the density expansion was seen to be less than 0.2%.
4.4 Diffusion coefficient models
A A AB J dz dx c D 1 − − = Eq. 4
Here, JA is the mole flux of component A in the mixture, c is the total concentration, x is the mole
fraction and z is a spatial length. From a theoretical perspective, the driving force of diffusion is the chemical potential. Diffusion coefficient models for mixtures which deviate considerably from ideality, such as liquids, polar or high density gas mixtures should thus be corrected with a term containing the derivative of the activity coefficient. The theory describing diffusion in binary gas mixtures at low to moderate pressures has been well developed. The theory results from the solution of the Boltzmann equation and the results are usually credited to both Chapman and Enskog, who independently derived the following equation:
(
)
D D AB AB AB f n M kT D Ω = 2 2 / 1 / 4 16 3 πσ π Eq. 5Here, n is the number density of molecules in the mixtures, k is Boltzmann’s constant and MAB is a
function of the molar weights of component A and B. ΩD is the collision integral for diffusion,
which is a function of the temperature. This quantity depends on the choice of the intermolecular force law between the colliding molecules. The 6-12 Lennard-Jones potential is a popular choice of force law in the literature. σAB is a characteristic length which also depends on the
intermolecular force law selected. fD is a correction term which is of the order of unity (Marrero
and Mason, 1972). To use Eq. 5, some rules must be chosen to obtain the interaction values σAB
from σA and σB. For liquids, the Stokes-Einstein equation which has been developed on the basis
of hydrodynamic theory for large spherical molecules diffusing in a dilute solution has been the starting point of several correlations:
A B AB r RT D πη 6 = Eq. 6
Here, R is the universal gas constant; rA is the radius of the solute and η is the viscosity of the B
solvent. Correlations for diffusion coefficients in non-dilute liquids, often uses the dilute diffusion coefficients correlated with the derivative of the activity coefficient discussed previously. Reid et al. (1987) however, claim that no single correlation is always satisfactory in the estimation of the concentration effect on the diffusion coefficients of non-dilute liquid mixtures.
4.4.1 Semi-empirical models
The methods by Wilke and Chang (1955) and by Othmer and Thakar (1953) were used to calculate the diffusion coefficient of CO2 in liquid water by Unver and Hemmelblau (1964). The
method by Wilke and Chang uses Eq. 6 as the foundation, whereas the method by Othmer and Thakar is derived by linking the temperature dependency of the viscosity and the diffusion coefficient. ‘Both methods represented the overall experimental results well’. In addition, a convenient way to calculate the diffusion coefficient was provided. The measurements were used to correlate a quadratic equation, using the lease square method. The liquid diffusion coefficients computed in this way were within ±11% of the experimentally measured values. The methods by Wilke and Chang (1955) were also used by Tomas and Adams (1964) to calculate the diffusion coefficients of CO2 in water. In the temperature range 291.6-348.2K, the values by Wilkes method
were approximately 20% lower than the experimental data at each temperature.
The measured data for the diffusion coefficient of CO2/O2 have been analyzed in terms of the
intermolecular potential energies and the rigorous kinetic theory. Four methods were used to approximate the actual potential energy needed in Eq. 5, including the Lennard-Jones potential (12-6), the potential modified by Buckingham, the point center of repulsion (inverse power), and the exponential repulsion potential energy functions (Walker and Westenberg, 1960). Their results showed that all four of the energy functions are capable of fitting the diffusion data with about the same precision. No significant concentration effects are, however, expected for CO2/O2 since the
The importance of using the right energy potential in the estimation of collision integrals has been recognized by several authors. Holsen and Strunk (1964) studied the diffusion coefficients of CO2/Ar and CO2/Air in the temperature range 276-317K. Within this range, the temperature
dependency of the coefficients was found to be inconsistent with the theoretical values predicted with Chapman-Enskog’s expression for the first approximation, in which the Lennard-Jones potential parameters are derived from viscosity data. Hirschfelder has shown that at a given temperature, the collisions most effective in promoting diffusion occur at closer distances than those most effective in the transfer of momentum and energy (viscosity and thermal conductivity). Holsen and Strunk, thus, found it necessary to correlate a correction factor for the Lennard-Jones potential to make the model represent the experimental data.
Instead of using a correction factor for the Lennard-Jones potential, other energy potentials have been tested. The experimental diffusion coefficients of 22 pairs of gas mixtures, including CO2/CO, were compared with theoretical values from a potential of Lennard-Jones and from the
modified potential of Buckingham by Ivakin and Suetin (1964a). The theoretical values calculated by the Lennard-Jones potential deviate from the experimental values by no more than 6% at 296K. The empirical coefficient proposed by Wilke and Lee (Wilke and Lee, 1955.) permitted improvement in the accuracy to 5.5%. Buckingham’s potential gave an even better description than the Lennard-Jones potential. On the average, the theoretical values obtained with Buckingham’s potential deviate from the experimental data by 3%. Ivakin and Suetin (1964b) also used the obtained experimental data to calculate the potential parameters of the intermolecular interaction for the Lennard-Jones (6-12) potential, the modified Buckingham potential and the point center of repulsion. Here, the first approximation of the strict kinetic gas theory was used to calculate the diffusion coefficient of gas mixtures, including CO2/N2 and CO2/H2. In the
temperature range 573-1100K, the calculations using the point center of repulsion potential showed the best accuracy for both CO2/N2 and CO2/H2 (AAD=3% for CO2/N2 and AAD<10% for
CO2/H2), while the Lennard-Jones (6-12) potential with parameters fitted from viscosity data
showed the worst accuracy (AAD=10% for CO2/N2 and AAD=13% for CO2/H2).
4.4.2 Empirical models
The most widely used empirical equation for the prediction of binary diffusion coefficients in gaseous mixtures at low concentrations is that of Fuller-Schettler-Giddings (FSG). This equation is the result of the correlation of more than 340 experimental diffusion coefficients for 153 different binary mixtures (Fuller et al., 1958):
( ) ( )
[
1/3 1/3]
2 75 . 1 3 / 1 / 1 10 B A B A FGS AB v v p M M T D∑
∑
+ + = − Eq. 7Here, T is the absolute temperature, p is the pressure (atm) and v are special diffusion
parameters to be summed over atoms, groups and structural features of the diffusion species, called diffusion volumes and having dimensions of atomic volumes. This method has the advantage of being able to overcome the general lack of accuracy associated with other category methods. It has been used to calculate the diffusion coefficients of several mixtures, including CO2/H2, CO2/Ar, CO2/N2, CO2/N2O and CO2/H2O (gas). The average deviations were between
-3.4-14.3% (Fuller et al., 1958).
The FSG method was used to estimate the diffusion coefficients of binary CO2-mixtures including
the impurities N2, O2, H2, H2O and CO (Todd and Young, 2002). By comparing the results with
experimental data, the obtained mean deviations were between -2.44~-4.71% except for CO2/H2O.
This method displayed poor accuracy for the CO2/H2O system, with a mean deviation of 20.91%
and a maximum deviation of 34.1%. Gavril et al. (2004) used the FSG equation to calculate the diffusion coefficients of CO2/H2. In the temperature range 315.2-343.9K, the absolute deviations
were less than 0.5%.
An Arrhenius-type equation by Versteeg (1986) and Frank et al. (1996) was used to represent the diffusion coefficient of liquid CO2/H2O mixtures. Compared to the measurements by Frank et al.
(1996) in the temperature range 298-328K, Frank’s correlation has an AAD of less than 1%, while Versteeg’s correlation has an AAD of 1.67%. Frank et al (1996) also evaluated the modified Stokes-Einstein equation and the Wilke-Chang equation. Both of them showed typical errors larger than 5%.
4.5 Models for multi-component properties
Some models are able to handle several transport properties. Bzowski et al. (1990) for instance, used results from statistical-mechanical theory applied through a combination of an extended principle of corresponding states with some knowledge about intermolecular potentials, to calculate the transport and equilibrium properties of gas mixtures at low densities, including the second virial coefficients, viscosities, diffusion coefficients and thermal diffusion coefficients. For the diffusion coefficients, the deviations are within ±1% for CO2/N2O, within ±5% for CO2/CH4
and CO2/CO, within ±7% for CO2/O2, within ±18% for CO2/N2 and within ±22% for CO2/Ar. For
viscosity: the deviations are within ±2% for CO2/N2, CO2/CO and CO2/N2O, within ±2% for
CO2/CH4 and within ±4% for CO2/O2 and CO2/Ar.
Second virial coefficients, viscosities, thermal conductivities and diffusion coefficients of binary gas mixtures have been computed for the Morse potential in conjunction with a set of combination rules for the unlike interactions (Bahethi et al., 1964). For the viscosity of CO2/H2, Bahethi
calculated values which differ 2.3% on average from the experimental values. The comparison of experimental diffusion coefficients with the theory leads to very notable discrepancies for CO2/N2, which is up to 20% at temperatures over 900K. Moreover, the viscosities, diffusion
coefficients, thermal conductivities and diffusion coefficients of natural gas components were determined based on the principle of corresponding states for the viscosity together with an inversion technique (Moghadasi et al., 2007). The method developed by Scheriber et al. (1997) and the Chapman-Enskog approach have also been used to calculate the viscosity, the thermal conductivities and the diffusion coefficients with average accuracies within ±3%, ±5% and ±14% respectively.
4.6 Discussion of the transport property models
Several models and governing theories have provided the engineers with a large variety of expressions, and many comparisons with experimental data have been presented in the literature as displayed in Table B1. A major issue is that only few of the comparisons have been published after 1970. As discussed in Section 3.1 and displayed in the Figures 1-3, poor accuracy is expected for many of the experiments conducted before 1970. A wrong impression of the accuracy may be the result of comparing models to inaccurate experimental data. Another issue is that few comparisons have investigated the pressure dependency of the transport properties. Operation conditions at high pressures, however, are expected in several parts of the CCS-chain. For the prediction of gas-phase viscosities, the two competing methodologies have been the one based on Chapman-Enskog theory, and the theory based on the principle of corresponding states. Few comparisons in the literature have evaluated corresponding state methods for calculation of the viscosity of CO2 rich mixtures (Kestin and Ro, 1976, 1982 and Hanely and Mal’zsev, 1976)
and the comparisons do not lead to any conclusions with respect to which theory that is most suitable for viscosity predictions in CCS. More model evaluation is necessary at larger temperatures and pressures and the performance of corresponding state methods should be more carefully evaluated.
Two different approaches are common in the estimation of both gas-phase thermal conductivities and diffusion coefficients, namely the methodology based on the Rigorous Kinetic Theory (RKT) and empirical models. The best results with empirical models are obtained when the Aij factor is