Grant Agreement n. 233996/”CITY-MOVE” Collaborative Project Project Co-Funded by:
European Commission Research Directorate General
Workpackage n. __D5.1_
Version ____Final_________ Date of preparation 26/09/2011
DELIVERABLE n. D5.1
Evaluation plan
DISSEMINATION LEVEL: PUBLICDocument Control Sheet
Project CityMove — City multi-Role Optimized Vehicle
Grant Agreement n. 233996
Document Title D5.1 Evaluation plan
Nature R : Report
Available languages E : English
Dissemination level P: Public
Version n. 2 - Final
Date 26 September 2011
Number of pages 38
Archive name CityMove D5.1 Evaluation plan
Authors Luca Lucietti (FIT)
Contributors Maurizio Miglietta (CNR), Jean Louis Routhier (LET), Pascal Pluvinet (LET), Andreas Tapani (VTI), Zohra Roissac (VOLVO), Hanna Buhl (Schenker), Marco Aimo Boot (IVECO)
History Document internally reviewed
Keywords Evaluation, target audience, Urban Freight Transport, evaluation framework, impact, common indicators, use cases
TABLE OF CONTENT
0. EXECUTIVE SUMMARY ... 4
1. INTRODUCTION ... 5
1.1 BACKGROUND ...5
1.2 FROM THE USERS’ NEEDS TO THE EVALUATION PROCESS ...5
2. OBJECTIVES ... 9
2.1 THE OBJECTIVES OF THE EVALUATION PROCESS ...9
3. EVALUATION METHODOLOGY ... 12
3.1 EVALUATION METHODOLOGY AND FRAMEWORK... 12
3.2 IMPACT EVALUATION ... 19
3.3 PROCESS EVALUATION ... 20
3.4 IMPACTS AND INDICATORS ... 21
3.5 EXPECTED IMPACTS /DEFINITION OF “SUCCESS”... 24
3.6 THE CITYMOVE PROTOTYPES ... 26
4. LOCAL EVALUATION PLAN (USE CASES) ... 30
4.1 UPPSALA USE CASE -“VOLVO” PROTOTYPE ... 30
4.1.1 Background and description ... 30
4.1.2 Logistics organisations of the CityMove partner ... 32
4.1.3 Impact evaluation ... 33
4.1.4 Process evaluation ... 34
4.2 BUCHAREST USE CASE -“IVECO” PROTOTYPE A ... 34
4.2.1 Background and description ... 34
4.2.2 Logistics organisations of the CityMove partner ... 35
4.2.3 Impact evaluation ... 36
4.2.4 Process evaluation ... 36
5. ANNEXES ... 37
0.
EXECUTIVE SUMMARY
Deliverable 5.1 aims at developing a holistic evaluation methodology based on a comprehensive project assessment framework. The evaluation methodology indicates at what extent the application of CityMove to a real urban context will improve the freight transport and logistics operation, safety, including performance, energy-consumption, technical reliability, cost-effectiveness, externalities (environmental and noise impacts). The CityMove project aims at developing an innovative vehicle solution for urban freight distribution, fitting with the integrated city transport approach for a secure, flexible, reliable, clean, energy efficient and safe road transportation of goods across European cities.
The Evaluation Plan (D5.1) describes the general evaluation methodology for the CityMove innovative vehicle concept. Evaluation is separated in two parts: impact evaluation and process evaluation. Impact evaluation deals with the measurement of direct effects of the innovative vehicle concept. This deliverable contains the precise definition of common indicators and their use at use case level, other than measurement and data collection activities The impact evaluation process provides useful information related to the achievements concerning the set of assessment objectives at Use Case level: the scope of the impact evaluation is to carry out a quantified assessment of direct effects of the CityMove solution concerning the areas of energy, environment, economy and transport.
Effectiveness and efficiency is one of the main determinants for the success or failures of the proposed solution. Items such as evaluation objectives, planning, data collection and selection of indicators and impacts are discussed in this report. The new concept vehicles will be designed, prototyped and tested taking into consideration results from user needs analysis, in order to guarantee the acceptance of the solutions able to improve adequacy and effectiveness of freight vehicles circulation in urban areas.
The process evaluation provides useful background information on the conditions (e.g. political/administrative, economic, technical, etc.) prevailing during the CityMove prototypes implementation. Process evaluation aims to gain insights into the drivers and barriers arisen during the preparation, implementation and operation of the proposed solution.
The evaluation plan will be considered as an iterative document, eventually periodically updated, in order to cope with possible revisions.
1.
INTRODUCTION
1.1 Background
The CityMove project aims at developing a new vehicle concept for the Delivery of Goods and Urban Services. CityMove is aimed at enhancing freight transport logistics industry towards long-term efficiency and growth, having an impact on safety, congestion, air pollution, noise pollution and dependence on fossil fuels. A goods delivery vehicle is typically designed around a general architecture, designed not specifically for urban areas. CityMove is instead aimed at developing a new vehicle architecture specifically designed for the optimisation of the freight transport in urban areas.
CityMove aims at developing an innovative vehicle solution for urban freight distribution, fitting with the integrated city transport approach for a secure, flexible, reliable, clean, energy efficient and safe road transportation of goods across European cities.
The development of such range of freight vehicles will be achieved through a strong co-ordinated effort involving all relevant stakeholders, so that future freight vehicles will have flexibility to adapt to changes in the urban environment over the short, medium and long terms.
CityMove will involve the different stakeholders groups, getting inputs from the potential “users” (freight carriers), indirect users (shippers) as well as those who are directly or indirectly influenced by a solution but with no interaction with it as users (e.g. Administrations, residents, etc.).
CityMove has a precise industrial approach that will guarantee the full deployment and production of the concepts in the next few years after the conclusion of the project. The overall project’s objective is to develop sustainable solutions generating relevant benefits for the whole value chain: from industries to citizens. This objective will be achieved through the development of innovative, user-oriented, environmental-friendly, energy-saving “city-based freight vehicles”.
1.2 From the users’ needs to the evaluation process
Use cases and evaluation aim at setting-up a selected and segmented (in a balanced way in terms of main characteristics, background and geographical location) field test at cross-EU use cases and to evaluate the CityMove solutions ensuring a full deployment and transferability of the application at EU level and key learning points. Use cases will be selected under WP5 according to their background, data availability, local commitment as well as geographical location.
Then, WP5 will evaluate and assess the progress made through real cases applications.
The CityMove new concept vehicles will be designed, prototyped and tested taking into consideration results from user needs analysis, in order to guarantee the acceptance of the solutions able to improve adequacy and effectiveness of freight vehicles circulation in urban areas.
The CityMove project will design, prototype and test solutions which integrate new concept vehicles having the following characteristics: less emissions, less noise, reduced dimension with the same load factor, more safety as well as less fuel consumption.
CityMove builds on a common platform for the collection of relevant inputs from the projects’ community, mainly through an on-line survey on city logistics users’ and stakeholders’ needs as well as the Joint Stakeholder Workshop on users’ needs and requirements that was held on 16th June 2010 in Brussels. The workshop was organised in cooperation with the CITYLOG project, in order to have a common invitation list and to share the users’ needs collection method.
The workshop gathered 75 stakeholders ranging from freight operators, cities, organisations, research institutes, vehicle manufactures and others, in order to discuss their needs towards urban freight delivery vehicles and urban logistics concepts. During the CITYLOG – CityMove Workshop, the main users’ needs and requirements were identified by the collection of answers from participants, clustered in four stakeholders’ groups - local authorities, freight operators, vehicles manufactures and others (e.g. associations, research organisations, etc.) - as follows:
• increasing safety for vulnerable road users (e.g. pedestrians, cyclists, seniors, people with handicap);
• reducing gas and noise emissions, both during driving phase and goods loading/unloading activities, pushing to use alternative vehicles (electric or hybrid);
• saving energy consumption and travelled km per delivery trip, rationalizing the load and good distribution in urban area;
• increasing vehicles’ flexibility allowing different kinds/sizes/shapes of goods loaded into the same container, different temperature zone within one box for diversity of mission (e.g. delivering dry and refrigerated goods at the same time) as well as shipping all types and volume of goods;
• achieving vehicles’ modularity, including modular composition in length of vehicle as well as modularity of the box allowing the access to pallets from different sides of the vehicle;
• reducing delivery time especially during goods loading/unloading phase by a fast and safe x-dock solution as well as a fast loading and unloading system from the unit;
• setting up harmonised and standardised solutions in terms of global standards, interoperability, harmonised regulation on weight/dimension/emissions of freight vehicles for cities access (mainly city and historical centres) at European level.
In addition to the needs and requirements for the future urban freight vehicles, as achieved by the answers of the different stakeholders’ groups participating to the CITYLOG-CityMove Joint Stakeholder Workshop, relevant information and indications were achieved through the on-line survey organised in different questionnaires for each stakeholders’ identified domain: Administrations, Freight Carriers, Truck and Vehicle Manufactures, Residents, Shippers.
From the analysis of the collected data as indicated in the CityMove D2.1 “User needs and requirements”, it emerges that:
• Administrations are mainly interested into the aspects of urban goods distribution that affect their work, such as quality of life in terms of air pollution aspects, safety, congestion, noise. Therefore Administrations are interested into greener, less polluting freight vehicles, quieter and safer vehicles, versatile vehicles whose size is appropriate to the type of delivery.
• Freight Carriers are mainly interested into the aspects of urban goods distribution that affect their work, such as vehicle utilization, weight and volume optimization, economic and operational issues in terms of cost effectiveness, efficiency and cost reduction (both operation and maintenance costs), service reliability and efficiency by reducing delivery times (especially for loading and unloading operations) as well as consumption, pollution and noise reduction for increasing cities accessibility in terms of time windows and spaces. Therefore, Freight Carriers are mainly interested into lower-consumption vehicles and flexible vehicles able to reduce delivery times and to reduce operation costs.
• Truck and Vehicle Manufactures are mainly interested into the economic and operational aspects, being the most important areas to be addressed for improving urban goods delivery processes and vehicle performance. In addition to this, higher load factors, less pollution and fuel consumption are the main priorities for the manufactures’ prospective. Fuel consumption and therefore vehicle engine performance are the most important aspects for the overall objective of reducing operational costs together with making vehicle’s maintenance costs as low as possible through appropriate technical solutions. Last but not least, more efforts from Public Authorities to define more harmonized regulations on weight/dimensions/emissions of freight vehicles for cities access were highlighted by vehicles manufactures.
• Residents are mainly interested into the aspects of urban distribution that affect them directly, such as less polluting and silent vehicles, more use of environmentally friendly freight vehicles, accessibility and availability of loading and unloading areas for freight vehicles within the cities, allowing reducing traffic congestion and emissions.
• The Shippers domain was not adequately covered in the on-line survey. Some issues concerning Shippers were raised by the participants at the Workshop parallel session focused on the urban delivery vehicle. Concerning receivers, usually they do not pay for freight deliveries but they may have some requirements, looking for a more receiver-oriented supply chain.
Upon the analysed stakeholders’ needs and requirements, the evaluation process starts from the selection of the most important and common users’ needs characterizing the different stakeholders’ domain (Administrations, Freight Carriers, Truck and Vehicle Manufactures, Residents, Shippers).
Obtaining a sound understanding of the needs and requirements of users for urban logistics is the essential first step in the evaluation process. The identification and definition of assessment objectives of the CityMove solution primarily needs to be based upon the definition of user needs.
Identification of user needs is essential for both vehicle design and assessment. For vehicle design the question to be answered is “how can the vehicle be designed to best meet the users’ needs?”, while for vehicle assessment the question to be answered is “does the vehicle as tested perform as intended and meet the users’ needs in practice?”.
2.
OBJECTIVES
2.1 The objectives of the evaluation process
The objectives of the evaluation process of the CityMove project are to:
• define the evaluation methodology and framework,
• define the qualitative and quantitative indicators suitable to measure impact, value and benefits (environmental and economic) of the CityMove solution,
• define the quantitative targets and expected results to be achieved, per each of the identified indicators, within a clear identification of success for the CityMove solution, vehicles and project in general;
• select a significant number of use cases according to their characteristics and user needs and requirements;
• perform tests in real use cases to assess the CityMove solution in real environment;
• carry out impact evaluation and process evaluation (including drivers and barriers) of the CityMove solution, comparing the measured outcomes with the initial definition of success and target values and deriving appropriate lessons learned;
• carry out macro verifications of the CityMove solution by simulation tools;
• identify the criteria for the transferability of the CityMove solution at an EU dimension.
From the global analysis carried out in the WP2, it emerges that the main needs and requirements from the stakeholders’ prospective are represented by energy consumption, pollution and noise reduction, economic and operational issues, modal integration and quality of life (e.g. pollution, noise level, etc.), vehicle utilization (e.g. load factor, payload, etc.) as well as environmental issues (social and regulation) in terms of regulatory aspects to access cities and use of alternative vehicles.
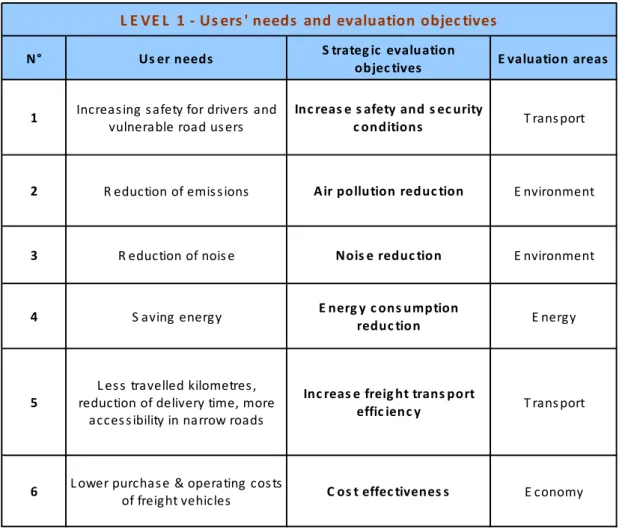
These results allow the definition of strategic evaluation objectives according with users’ needs, allowing the further allocation of these objectives into the 4 relevant evaluation areas (Level 1):
• Transport,
• Environment,
• Energy,
N° Us er needs S trateg ic evaluation
objec tives E valuation areas L E VE L 1 - Us ers ' needs and evaluation objec tives
Inc reas e s afety and s ec urity c onditions
1 Increas ing s afety for drivers and
vulnerable road us ers T rans port
E nerg y c ons umption
reduc tion E nergy
2 R eduction of emis s ions A ir pollution reduc tion E nvironment
Nois e reduc tion E nvironment
3 R eduction of nois e
6 L ower purchas e & operating cos ts of freight vehicles
4 S aving energy
C os t effec tivenes s E conomy 5
L es s travelled kilometres , reduction of delivery time, more
acces s ibility in narrow roads
Inc reas e freig ht trans port
effic ienc y T rans port
Table 1: Users’ needs and evaluation objectives (Level 1)
The strategic evaluation objectives definition is instrumental to the further selection of relevant and appropriate key performance indicators (KPIs), allowing to measure and evaluate impacts of the CityMove solution (Level 2) which will be in-depth described in the next paragraph of this document.
Impact evaluation is the measurement or estimation of the impacts (effectiveness) of an application/solution on safety, environmental conditions, transport efficiency for the relevant target groups (e.g. freight carriers). Impact evaluation is based on the results of field trials or use cases implementation, of other experiments as well as of calculations by modelling or simulation tools.
Impacts of the CityMove urban freight vehicle concept will be evaluated for each selected performance indicator by the different methodologies which include calculations, estimations, measurements, interviews and questionnaires according with specific needs and requirements linked with urban context where prototypes will be tested within the Use Cases.
Common criteria used for selecting these performance indicators assuring correlation among strategic evaluation objectives, impacts and indicators, are the following (see the METEOR project):
• Relevance: each indicator should represent an assessment criterion, such as have a significant importance for the evaluation process.
• Completeness: the set of indicators should consider all aspects of the system/concept under evaluation.
• Availability: on the ground for entry into the monitoring system.
• Measurability: the identified indicators should be capable to be measured objectively or subjectively.
• Reliability: clarity of definition and ease of aggregation.
• Familiarity: the indicators should be easy to understand.
• Non-redundancy: indicators should not measure the same aspect of an assessment criterion.
• Independence: small changes in the measurements of an indicator should not impact preferences assigned to other indicators of the evaluation model.
3.
EVALUATION METHODOLOGY
3.1 Evaluation methodology and framework
The evaluation methodology for the CityMove applications assessment process will indicate to what extent the implementation of the prototypes will improve freight operation performance, safety, pollution emissions, energy-consumption, cost-effectiveness. The evaluation process will be iterative in order to cope with possible revisions and further calibrations.
In order to define the most appropriate and effective evaluation framework for the CityMove project, an review of the most successful evaluation methodologies elaborated within the previous European Commission Framework Programmes has been done.
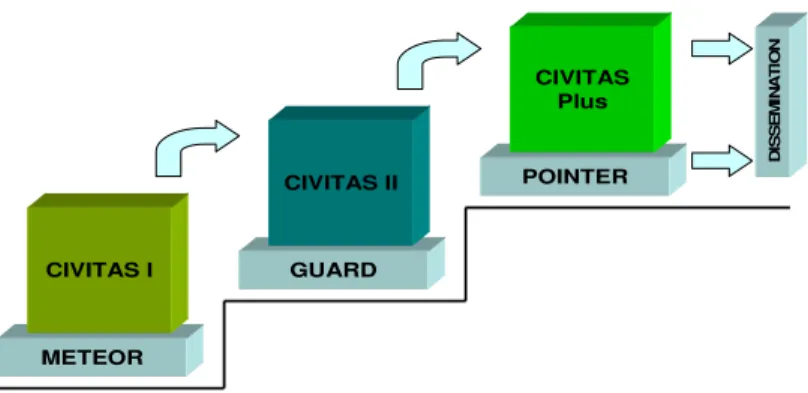
An in-depth review of evaluation methodologies developed within EU CIVITAS Initiatives has been undertaken starting from the evaluation methodology (METEOR) defined in first CIVITAS programme (CIVITAS I) until the last one (POINTER) defined in the last programme (CIVITAS Plus).
Figure 1: The Evaluation methodologies within the EU CIVITAS Initiatives
The METEOR project is the Accompanying Measure for the CIVITAS I initiative. METEOR – “Monitoring and Evaluation of Transport and Energy Oriented Radical Strategies for Clean Urban Transport” - supported the European Commission when monitoring and evaluating the CIVITAS Demonstration Projects. All CIVITAS cities implemented different packages of measures that fitted the unique situation of the individual case. Measures taken covered Access Restrictions, Integrated Pricing Strategies, Public Passenger Transport, New Forms of Vehicle Use, New Concepts for the Distribution of Goods, Clean Public and Private Fleet, Integration of Transport Management, etc.
D IS S E M IN A T IO N METEOR CIVITAS I GUARD CIVITAS II POINTER CIVITAS Plus
The GARD project produced a guide for CIVITAS II projects and cities for the measures evaluation including the Evaluation Results Template based on that used in CIVITAS I (developed by METEOR). This measure level template represented the evaluation tool for the CIVITAS II cities and projects and served multiple purposes including the reporting of all evaluation-relevant information (“completeness”), ensuring a common reporting style, facilitating the analysis of evaluation results for the CIVITAS projects as well as enabling cross-site evaluation at CIVITAS level.
Finally, the POINTER project has defined the monitoring and evaluation methodology for CIVITAS Plus cities and projects defining expected evaluation requirements which include impact and process evaluation for each implemented urban transport measure, approach for transferability assessment as well as reporting of results for each measure using an agreed Reporting Template.
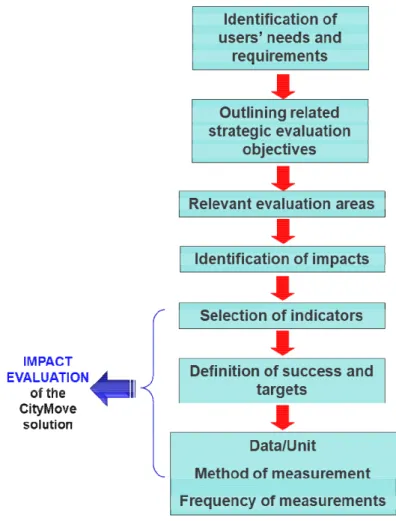
The comprehensive CityMove project evaluation framework is therefore based - according with the main indications and recommendations provided by the evaluation methodologies defined within the three different CIVITAS Initiatives. Moreover, CityMove completes the POINTER1 evaluation methodology in areas not appropriately addressed by such methodology, namely in the definition of targets and of the expected “success” of the project, to be verified in due course by the end of the project. In fact, defining indicators without setting targets and making clear the specific understanding of “success” means not to be able to really appreciate if the effort and investment devoted to the identified solution, system or project, has brought effective added value or not, and if the expected “payback” or “return” from the invested effort has been appropriate. Finally, only with a clear demonstrated and recognized success there can be reasonable potentials for replication, deployment, exploitation and scalability of the identified solution or system. The resulting main sequential steps are the following:
1) Identification of the stakeholders involved in the process and their needs and requirements (User needs);
2) Identification of the assessment objectives (Strategic evaluation objectives);
3) Identification of the different types of assessment to be performed (Evaluation areas and
Impacts);
4) Identification of the set of key performance indicators (KPIs) required for measuring the assessment criteria (Indicator's name, Indicator’s description, Data/Units);
5) Definition of “success”, through the indication of the target values, per each indicator, representing the expected results, impacts and outcomes to be verified through direct measurement during the project lifetime and expected in the exploitation phase
6) Identification of the most appropriate evaluation technique in order to perform the various types of assessment (Method of measurement, Frequency);
7) Development of measurement and data collection sheets and databases for collecting the required data (Data source);
8) Data collection and evaluation results analysis (including cross Use Case analysis); 9) Defining background information at site level for each potential Use Case.
The evaluation framework which will allow to carry out impact evaluation of the CityMove urban freight vehicle concept is summarized as follows.
Starting from the elicitation of the most important stakeholders’ needs and requirements on the basis of the Task 2.1 findings, the relevant strategic evaluation objectives have been defined to allow the CityMove solution to best meet the users’ needs and requirements for the future innovative freight vehicle for urban logistics. Related evaluation areas and impacts have been also defined in order to proceed with the further selection of the most relevant and appropriate performance indicators, allowing to measure and evaluate impacts of the CityMove solution.
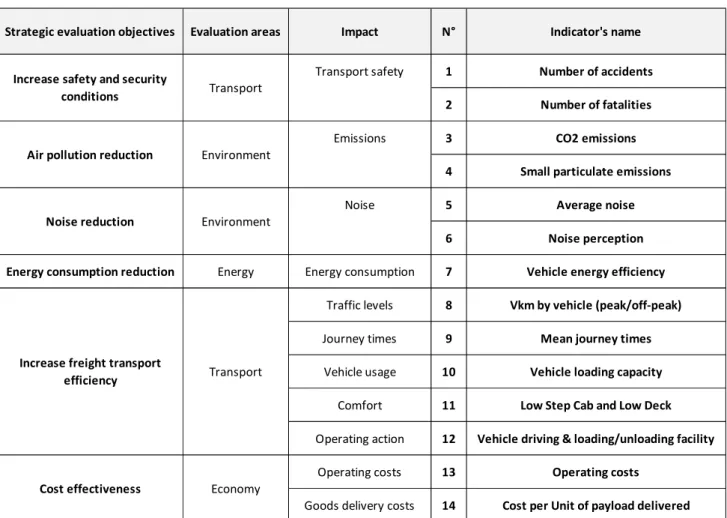
The proposed list of impacts to which the selected indicators will be matched are referred to each evaluation area considered in the analysis: Transport, Environment, Energy, Economy.
The next step has been in matching one or more indicators to the relative impacts for assessing how far the City Move solution is successful in meeting the strategic evaluation objectives.
These indicators are quantitative/qualitative measurements of the expected impacts of the City Move prototypes in the real environment (or simulated environment) and represent the measures of its effectiveness. The indicators have been selected reflecting the identified strategic evaluation objectives: the criterion followed for the indicators selection has been the availability of required information as well as the easiness of data processing. The selection process has been undertaken not only on the basis of impacts to be measured but also the practicalities of data collection.
Strategic evaluation objectives Evaluation areas Impact N° Indicator's name
Transport safety 1 Number of accidents
2 Number of fatalities
Emissions 3 CO2 emissions
4 Small particulate emissions
Noise 5 Average noise
6 Noise perception
Energy consumption reduction Energy Energy consumption 7 Vehicle energy efficiency
Traffic levels 8 Vkm by vehicle (peak/off-peak)
Journey times 9 Mean journey times
Vehicle usage 10 Vehicle loading capacity
Comfort 11 Low Step Cab and Low Deck
Operating action 12 Vehicle driving & loading/unloading facility
Operating costs 13 Operating costs
Goods delivery costs 14 Cost per Unit of payload delivered
Increase freight transport
efficiency Transport
Cost effectiveness Economy
Noise reduction Environment
Air pollution reduction Environment
Increase safety and security
conditions Transport
Table 2: Indicators definition (Level 2)
Methods of data collection, frequency of measurements, data/units as well as data sources have been finally defined at this beginning phase of the evaluation process for CityMove prototypes verification and validation as well as for the further cross-case analysis.
N° Indicator's name Indicator's description Data/Unit Method of measurement
1 Number of accidents Number of vehicle accidents per
vehicle-km (vvehicle-km) Risk factor, quantitative Estimation 2 Number of fatalities Number of vehicle fatalities involving
vulnerable road users Modelled, qualitative Estimation, fictional 3 CO2 emissions CO2 per vehicle-km g/vkm, quantitative
Modelling (aggregation per type of road, type of tour,
traffic level, etc.) 4 Small particulate emissions PM10 per vehicle-km g/vkm, quantitative
Modelling (aggregation per type of road, type of tour,
traffic level, etc.) 5 Average noise Average noise measured external to the
vehicle dB(A), quantitative Calculation, measurement 6 Noise perception Perception of noise Index, qualitative Survey
7 Vehicle energy efficiency Energy (fuel/eletric) used per vehicle-km MJ/vkm, quantitative Modelling
8 Vkm by vehicle (peak/off-peak) Total trips length Vkm, quantitative Calculation, estimation
9 Mean journey times Mean time per delivery journey Minutes, quantitative Calculation, estimation
10 Vehicle loading capacity Paying Load/Gross Weight Tons, quantitative Calculation, estimation
11 Low Step Cab and Low Deck Physical efforts (calories) and time taken
to board vehicle Modelled, qualitative Estimation 12 Vehicle driving &
loading/unloading facility Driver expectations Qualitative Survey 13 Operating costs Average operational cost for goods
transport service developed €/vkm, quantitative Estimation, survey 14 Cost per Unit of payload
delivered Cost per unit delivered €, quantitative Estimation
LEVEL 2 - Indicators definition and assessment
Table 3: Indicators assessment (Level 2)
The proposed evaluation framework takes into account both the evaluation of the project impacts that will be implemented at each Use Case and the monitoring of the project implementation process at each site. The impact evaluation process provides useful information related to the achievement concerning the set of assessment objectives at Use Case level, while the process evaluation provides useful background information on the conditions (e.g. political/administrative, societal, economic, technical, etc.) prevailing during the implementation of the CityMove prototypes.
The objective of the impact evaluation is to carry out a quantified assessment of direct effects of the CityMove urban freight vehicle concept concerning the areas of energy, environment, economy and transport. Effectiveness and efficiency is one of the main determinants for the success or failures for the proposed solution.
For the whole indicators, frequency of measurements will be characterized by a “before/after” approach. “Before” is to be intended as the situation before setting up the CityMove innovative vehicle concept: this means, for example, the current performances of representative (traditional) baseline freight vehicle compared with the CityMove prototypes.
This approach should be applicable for the following indicators: CO2 emissions (n°3), Small particulate emissions (n°4), Average noise (n°5), Noise perception (n°6), Vehicle energy efficiency (n°7), Vehicle loading capacity (n°10), Low Step Cab and Low Deck (n°11), Vehicle driving & loading/unloading facility (n°12).
The “before” situation relating to same specific aspects of freight transport efficiency and costs effectiveness has to be intended as the situation characterizing the current goods transport service developed by freight operators (DANONE and SHENKER) compared with the same service but using the respective CityMove prototype. This approach should be applicable for Vkm by vehicle (n°8), Mean journey times (n°9), Operating costs (n°13), Cost per Unit of payload delivered (n°14).
The potential data source for each selected indicators by which relevant data can be achieved are indicated in the table below.
N° Indicator's name Data source
1 Number of accidents
- Accidentology statistics
- Results analysis from previous safety project - Knowledge of critical location in Use Cases 2 Number of fatalities
- Accidentology statistics
- Results analysis from previous safety project - Simultion tools of human impact
3 CO2 emissions Microsimultation tools 4 Small particulate emissions Microsimultation tools
5 Average noise Noise measurement TBD /norm Piek 6 Noise perception Data collected during Use Case 7 Vehicle energy efficiency Microsimultation tools
8 Vkm by vehicle (peak/off-peak) Data collected during Use Case, Urban Goods Movement models
9 Mean journey times Data collected during Use Case 10 Vehicle loading capacity Data collected during tests 11 Low Step Cab and Low Deck DMU virtual analysis 12 Vehicle driving &
loading/unloading facility Data collected during Use Case
13 Operating costs Data collected during Use Case by transport service operator
14 Cost per Unit of payload delivered
Data collected during Use Case by transport service operator
Process evaluation will be also undertaken with the aim to gain insight into the drivers and barriers during the preparation, implementation and operation of the CityMove urban freight vehicle concept. Political/administrative, economic, technical and other factors (e.g. constraints to realization, etc.) that might be critical to success/failure influencing the implementation of the new vehicle concept in a positive way (drivers) or negative way (barriers) will be identified.
3.2 Impact evaluation
The objective of the impact evaluation task is to carry out a quantified assessment of direct effects of the CityMove urban freight vehicle concept, particularly concerning the areas of economy, energy, environment, and transport in general. Effectiveness and efficiency is one of the main determinants for the success or failure for the CityMove solution. The aim is to provide a clear and concise evaluation of individual prototype in the first place. This allows that impacts are clearly understood enabling a clear interpretation of the findings. Because comparability is important, methods, approaches and indicators have to be coordinated across the different Use Cases.
Evaluation of impacts of such solution is in the first place targeted at the question whether the strategic evaluation objectives connected with the identified stakeholders’ needs have been achieved (or potentially will be achieved). The strategic evaluation objectives has been identified as described in the previous paragraphs of this document. The indicators have been also selected reflecting these objectives. As already anticipated, the determination of indicators will not only depend on the impacts to be measured, but also the practicalities of data collection. Indicators should reflect the objectives of the proposed solution. To allow for cross comparison equal indicators should be selected. A set of indicators covering the fields mentioned before, has been defined as showed in the Table 2. These indicators form the basis for data collection and analysis.
The impact evaluation generally consists of before and after analysis. The situation before implementation of the CityMove urban freight vehicle concept should be compared with the situation characterized by the use of the CityMove prototype for urban goods delivery service production.
Therefore SCHENKER and DANONE are requested to support in this process providing all necessary data and information which allow to define the baseline scenario of their urban goods delivery service. These background information are provided in the Paragraph 4 “Local evaluation plan (Uses Cases)”. It is also really important to analyse cause and effect: what can be devoted to the proposed innovative solution and what is caused by other, external, circumstances.
There are also measures where a before and after type of approach makes less sense. Regular monitoring by means of panel assessment are also useful techniques to assess impacts.
Some features of the CityMove urban freight vehicle concept might affect the attitude of relevant stakeholders (e.g. Administrations, Freight Carriers) or to increase awareness amongst target groups, rather than to have a direct impact on transport efficiency or safety. Clearly, in those cases attitudes and awareness (user’s expectations) should be measured (either qualitatively or quantitatively), monitored and evaluated. This is the case, for instance, for aspects regarding the CityMove prototype driving and loading/unloading facility (Indicator 15) which will be measured in terms of covering driver expectations compared with the vehicles currently used for delivery service.
Impact evaluation is all about data collection. Data feeds the analysis and provides indicators information. Depending of the type of information to collect according with the relevant selected indicators, it can choose between various methods of data collection:
• Direct measurement using instrumentation (e.g. when cleaner engines are implemented); • Direct observation or recording of events;
• Surveys by:
- Questionnaire - Interviews - Diary completion
• Collection from historical records (e.g. accident records, traffic flows, etc.) • Use of focus groups and stakeholder meetings.
Detailed information at Use Case level concerning impact evaluation of the CityMove prototypes are provided in the further Paragraph 4 “Local evaluation plan (Uses Cases)”.
3.3 Process evaluation
The CityMove Project aims to contribute to a more sustainable urban freight transport by demonstration of effectiveness and efficiency of the CityMove urban freight vehicle concept to show that this solutions does help to tackle the problems cities are facing in terms of congestion, pollution, safety as well as freight transport efficiency. Proper evaluation is needed. Besides impact evaluation also process evaluation is important. Process evaluation tries to gain insight in the processes of planning and implementation and to assess the results and outcomes.
Process evaluation aims to gain insight into the drivers and barriers during the preparation, implementation and operation of the proposed solution. It analyses the role of information communication and participation during these phases. It should contribute to the cross-site evaluation on Use Case level, and provide relevant input to the policy recommendations. Process evaluation consists of three building blocks:
• process topics and issues;
• the CityMove solution process evaluation (all prototypes).
These objectives should be realised by collecting data on Use Case level. Techniques that can be used to collect data for process evaluation include: questionnaire surveys, focus groups, interviews.
The proposed template for data collection (Process Evaluation Template) is provided in Annexes.
3.4 Impacts and Indicators
The basic requirement for CityMove Use cases evaluation is to define a set of common indicators, measurement and evaluation methods that are feasible at all the involved parties. The success of evaluation process depends strongly on the capacity to select appropriate indicators that best measure impacts of the CityMove urban freight vehicle concept.
Indicators to be used for impact evaluation have to answer to the following questions:
• what data is to be collected,
• when data is to be collected, such as baseline (before) and after, and at other occasions if appropriate,
• where the data is to be collected,
• how the data is to be collected
• from whom data is to be collected
• which is the level of actual and expected (after implementation and demonstration) value of data and related indicators
The final step of the process of selection consisted in matching one or more indicators to the relative impacts. Indicators are qualitative/quantitative measurements of the expected/real life impacts of the CityMove project and represent the measures of its effectiveness. Common criteria used for selecting most appropriate indicators are: relevance, completeness, availability, measurability, reliability, familiarity, non-redundancy, independence.
According with the CityMove evaluation framework previously described and the feedback provided by the Project Partners, the list of impacts and correlated indicators are provided in the table below.
Impact N° Indicator's name Indicator's description Data/Unit Method of measurement Frequency Transport safety 1 Number of accidents Number of vehicle accidents per
vehicle-km (vkm) Risk factor, quantitative Estimation Before/after 2 Number of fatalities Number of vehicle fatalities involving
vulnerable road users Modelled, qualitative Estimation, fictional Before/after
Emissions 3 CO2 emissions CO2 per vehicle-km g/vkm, quantitative Modelling Before/after
4 Small particulate emissions PM10 per vehicle-km g/vkm, quantitative Modelling Before/after Noise 5 Average noise Average noise measured external to
the vehicle dB(A), quantitative Calculation, measurement Before/after
6 Noise perception Perception of noise Index, qualitative Survey Before/after
Energy consumption 7 Vehicle energy efficiency Energy (fuel/eletric) used per
vehicle-km MJ/vkm, quantitative Modelling Before/after
Traffic levels 8 Vkm by vehicle (peak/off-peak) Total trips length Vkm, quantitative Calculation, estimation Before/after Journey times 9 Mean journey times Mean time per delivery journey Minutes, quantitative Calculation, estimation Before/after Vehicle usage 10 Vehicle loading capacity Paying Load/Gross Weight Tons, quantitative Calculation, estimation Before/after
Comfort 11 Low Step Cab and Low Deck Physical efforts (calories) and time
taken to board vehicle Modelled, qualitative Estimation Before/after Operating action 12 Vehicle driving &
loading/unloading facility Driver expectations Qualitative Survey Before/after Operating costs 13 Operating costs Average operational cost for goods
transport service developed €/vkm, quantitative Estimation, survey Before/after Goods delivery costs 14 Cost per Unit of payload
delivered Cost per unit delivered €, quantitative Estimation Before/after
LEVEL 2 - Indicators definition and assessment
Table 5: CityMove impacts and indicators (Level 2)
The list of the indicators are provided as follows:
• Indicator N°1 (Number of accidents) - Number of vehicle accidents per vehicle-km. Data will be estimated on the basis of road accidents statistics and results from previous EU road safety projects relevant to freight transport in urban areas.
• Indicator N°2 (Number of fatalities) - Number of vehicle fatalities involving vulnerable road users (VRU). Data will be estimated on the basis of road accidents statistics, results from previous EU road safety projects relevant to freight transport in urban areas as well as using simulation tools of human impact when VRU has an accidents with a freight vehicle (truck).
• Indicator N°3 (CO2 emissions) - CO2 per vehicle-km. Data will be assessed by micro-simulation. For the local models used, a description of the assumptions would be needed. In addition, the simulation models used should be validated to increase the credibility of the results.
• Indicator N°4 (Small particulate emissions) - PM10 per vehicle-km. Data will be assessed by micro-simulation. For the local models used, a description of the assumptions would be needed. In addition, the simulation models used should be validated to increase the credibility of the results.
• Indicator N°5 (Average noise) - Average noise measured external to the vehicle. Data will be achieved by the truck factory certificate of the vehicle or exploitation measurements by appropriate technical instruments.
• Indicator N°6 (Noise perception) - Perception of noise. Data will be will be relevant by interview categorising environmental noise into levels of satisfaction.
• Indicator N°7 (Vehicle energy efficiency) - Energy (fuel/electric) used per vehicle-km: ratio of total energy consumed for the vehicle (truck + fridge unit) divided by the total amount of vehicle-km completed in a given period. So: A = B/C
where: A = Average vehicle energy for each km (KJ/vkm) B = Total energy consumed for the vehicle (KJ)
C = Total amount of vehicle-km completed by the vehicle (vkm)
• Indicator N°8 (Vkm by vehicle (peak/off-peak)) - Total trips length. Data will be collected by freight transport operator (during the transport service production) when Use Case will run.
• Indicator N°9 (Mean journey times) - Mean time per delivery journey. Data will be collected by freight transport operator (during the service production) when Use Case will run.
• Indicator N°10 (Vehicle loading capacity) - Paying Load/Gross Weight. Data will be achieved by the truck factory certificate of the vehicle.
• Indicator N°11 (Low Step Cab and Low Deck) - Physical efforts (calories) and time taken to board vehicle. Data will be achieved with the support of appropriate models such as CATIA 3D Model used for virtual design.
• Indicator N°12 (Vehicle driving & loading/unloading facility) - Driver expectations. Data will be relevant to evaluate the real satisfaction of the new vehicle concept by means of interviews able to evaluate the acceptance and effectiveness at different level.
• Indicator N°13 (Operating costs) - Average operational cost for goods transport service developed: ratio of total operating costs incurred by the service divided by the total vehicle-km completed in a given period. This indicator is defined as the ratio of total operating costs incurred by a service divided by the total vehicle-km completed by the service in a given time
period (e.g. day, week, etc.). Data will be collected by the freight transport service operator when the Use Case will run or derived from other data available if not directly available.
• Indicator N°14 (Cost per Unit of payload delivered) - Cost per unit delivered. Data will be collected by the freight transport service operator when the Use Case will run or derived from other data available if not directly available.
3.5 Expected impacts / Definition of “success”
The CityMove innovative vehicle concept is aimed to achieve less emissions, less noise, less congestion, more safety for drivers and vulnerable road users, more freight transport efficiency and costs effectiveness as well as more transport network efficiency in the urban context in both actual and medium-long term time perspectives. The industrial approach will lead to guarantee that the final solution will be applicable to the freight vehicles market production in few years.
The expected impacts of the CityMove solution, which represent our “definition of success”, are listed in the table below for the whole indicators.
N° Indicator's name Targets quantification
1 Number of accidents 15% reduction of accidents (Driver Assistance Systems)
2 Number of fatalities 20% reduction of fatalities
3 CO2 emissions
>30% reduction in air pollution (Hybrid driveline), >3% reduction (Electric powered auxiliaries), >3% reduction
(Smart Energy Management) 4 Small particulate emissions
>30% reduction in air pollution (Hybrid driveline), >3% reduction (Electric powered auxiliaries), >3% reduction
(Smart Energy Management)
5 Average noise 3 dB(A) external noise reduction
6 Noise perception Low
7 Vehicle energy efficiency
30% fuel consumption reduction (Hybrid driveline), 3% reduction (Electric powered auxiliaries), 3% reduction
(Smart Energy Management)
8 Vkm by vehicle (peak/off-peak) 15% shorter missions
9 Mean journey times 15% shorter missions
10 Vehicle loading capacity 10% increasing useful loads
11 Low Step Cab and Low Deck Around 50% reduction in physical efforts (calories) demanded of drivers
12 Vehicle driving & loading/unloading facility 10% reduction in time (reducing the delivery lead-time for the final customer)
13 Operating costs 15% lower cost per vehicle
14 Cost per Unit of payload delivered >15% Lower cost of Unit delivered
The identified target values represent a very ambitious “definition of success”, but which could put strong basis for further deployment and concrete exploitation of the CityMove solution and approach. We are aware that putting quantitative and so detailed and ambitious targets represent a risk, but is also a necessary step in order not to limit our activity to the simple (and quite common) paradigm of success understood just as compliance to a project workplan. Our success will be mostly measured on real impacts and outcomes, being the compliance with the workplan just a sort of “minimum requirement” of compliance with our description of work.
From this point of view, the CityMove project intends to be much more ambitious than several current effort and projects in the field (starting and including all CIVITAS projects), where essentially there are just plans for measuring indicators, but any type of result could be in the end understood and declared as a “success”, simply because targets are normally not declared explicitly. So, any result will be a “good” one.
We are aware that the measurement of the indicated targets will not be easy, considering objective difficulties in cities and limited data availability, but we will make any possible effort to rely on effective and objective measurements and derive significant outcomes that will constitute reliable and accountable references and lessons learned, also for the constituency in general.
3.6 The CityMove prototypes
The CityMove new concept vehicles (prototypes) are as follows:
1) IVECO Prototype A (Chassis-cab vehicle, Eurocargo 7,5 tons, 160 HP, Euro 5 EEV); 2) IVECO Prototype B (Chassis-cab vehicle, Eurocargo 14 tons, 280 HP, Euro 5 EEV); 3) VOLVO Prototype (Medium duty vehicle, GVW 14/16 tons, Midlum Euro 5 EEV).
IVECO Prototype A
The main features of the IVECO Prototype A are listed as follows: • Hybrid driveline;
• Smart alternator;
• Battery monitoring and management; • Refrigerated goods delivery body. •
IVECO Prototype B
The main features of the IVECO Prototype B are listed as follows: • Predictive anti-rollover;
• All-Around Sensing function; • Frontal Collision Warning function.
Figure 4: IVECO Prototype B
The different prototypes’ components are indicated in the table below per prototype (A and B)
L E VE L 3 - IVE C O prototypes c omponents
M o d u la r C o n c e p t B o d y M o d u la ri ty & I n te g ra ti o n H y b ri d D ri v e lin e S m a rt E n e rg y M a n a g e m e n t E le c tr if ic a ti o n o f a u x ili a ri e s E le c tr ic c o m p re s s o r R e fr ig e ra te d g o o d s d e liv e ry B o d y P re d ic ti v e R o ll O v e r S u p p o rt U rb a n A D A S f u n c ti o n a lit ie s V u ln e ra b le R o a d U s e rs p ro te c ti o n ( A ll-A ro u n d S e n s in g ) V u ln e ra b le R o a d U s e rs p ro te c ti o n ( P la s ti c a b s o rb e n t c o m p o n e n ts t o re d u c e f a ta lit ie s ) F ro n ta l C o lli s io n W a rn in g s y s te m A d a p te d i n te rf a c e o f v e h ic le / b o x e c o m m u n ic a ti o n M a n a g e m e n t c o n tr o l e x c h a n g e i n fo rm a ti o n b e tw e e n v e h ic le a n d b o x In n o v a ti v e s o lu ti o n s f o r N o is e r e d u c ti o n In n o v a ti v e s o lu ti o n s f o r E m is s io n r e d u c ti o n E le c tr ic d ri v e lin e
“Ivec o” P rototype A (C has s is -cab vehicle, E urocargo
7,5 tons , hybrid, 160 H P , E uro 5 E E V ) x x x x x x
“Ivec o” P rototype B (C has s is -cab vehicle, E urocargo
14 tons , 280 H P , E uro 5 E E V ) x x x x x
VOLVO Prototype
The main features of the VOLVO Prototype are listed as follows: • Electric Driveline;
• Cooling for Electrical Components; • Electrical auxiliaries;
• Reduced axles distance and cab width (total length 8.5 m, body length 6,5 m); • Ergonomy (digital speed alerts).
Figure 5: VOLVO Prototype
The different prototype’s components are indicated in the table below. L E VE L 3 - VO L VO prototype c omponents M o d u la r C o n c e p t B o d y M o d u la ri ty & I n te g ra ti o n H y b ri d D ri v e lin e S m a rt E n e rg y M a n a g e m e n t E le c tr if ic a ti o n o f a u x ili a ri e s E le c tr ic P T O R e fr ig e ra te d g o o d s d e liv e ry B o d y P re d ic ti v e R o ll O v e r S u p p o r U rb a n A D A S f u n c ti o n a lit ie s V u ln e ra b le R o a d U s e rs p ro te c ti o n ( A ll-A ro u n d S e n s in g ) V u ln e ra b le R o a d U s e rs p ro te c ti o n ( P la s ti c a b s o rb e n t c o m p o n e n ts t o r e d u c e f a ta lit ie s ) F ro n ta l C o lli s io n W a rn in g s y s te m A d a p te d i n te rf a c e o f v e h ic le / b o x e c o m m u n ic a ti o n M a n a g e m e n t c o n tr o l e x c h a n g e i n fo rm a ti o n b e tw e e n v e h ic le a n d b o x In n o v a ti v e s o lu ti o n s f o r N o is e r e d u c ti o n In n o v a ti v e s o lu ti o n s f o r E m is s io n r e d u c ti o n E le c tr ic d ri v e lin e “Volvo” P rototype x x x x x x x x x x x
4.
LOCAL EVALUATION PLAN (USE CASES)
4.1 Uppsala Use Case - “Volvo” prototype
4.1.1 Background and description
Uppsala is the fourth largest city in Sweden with 144.839 inhabitants. It is located about 70 km at north of the capital Stockholm. The municipality of Uppsala has approximately 200.000 inhabitants, of which about 150.000 lives in the city, and is growing rapidly. This growth has resulted in an increased demand for retail goods and services in the city centre. The local economy is dominated by the Life Science sector, but the hallmark of Uppsala is the university. Healthcare and nursing, Business services, Trade and Education are the four largest sectors in the economy in terms of employment. The four biggest employers are the regional health service organisation, the municipality of Uppsala, the University of Uppsala and the Swedish University of Agricultural Sciences. The largest private employer is GE Healthcare Life Sciences AB with 1200 employees in 2009. The city covers an area of 47.86 km2 and the whole municipality 2189 km2.
Uppsala has a historical city centre with a narrow street grid. Most of the city centre is used as a commercial zone which creates large flows of people and goods. The city is also lacking a complete ring road which produces high traffic flows in parts of the city centre. In turn, this has created congestion problems during peak hours in some of the streets in the city that aren’t constructed to handle such high traffic flows. This has led to high emissions and difficulties with staying below the national environment limits for particulates and nitrogen dioxides in cities. The same goes for noise levels that also exceed the national set standards in many city streets.
Uppsala has in a joint project, during 2006 to 2010, with the Swedish Transport Administration called “The good city“ investigated the urban freight transport in the city of Uppsala. The report showed that the majority of private distribution centres were located in an industrial area about 1 km southeast of the city centre. The city has since then been working actively with relocating these further away from the centre. The study also showed that the freight transports to a high degree were using many of the most problematic streets, in terms of emissions and noise, for their distribution routes. Furthermore, the number of freight transports was growing and “just-in-time”-orders with small storages becoming the standard for shops due to the increasing property prices in the city and the decreasing transport prices.
Concerning the distribution in Uppsala, the city administration has dealt with this problem by starting a joint distribution for public freight transports. This includes freight going to the geriatric care, child care and public schools. The majority of public freight transports go to a distribution terminal and are then distributed to the different units in the organization on fixed delivery routes and on a fixed day of the week. This has decreased the CO2 emissions caused by these transports by 30%. The new comprehensive plan for Uppsala aims to broaden this work by finding new locations for city distribution centres for the private sector to enable joint distribution in the city.
The comprehensive plan for Uppsala determines the goals and aspirations for the development of the community. It functions as a strategic guide for transportation planning in the municipality. In the current one Uppsala, as mentioned, aims to find locations for new freight terminals to enable joint distribution and inter-modal transports, but also to inventory all freight movements within the municipality to find solutions to reduce the number of transports and to make them more environmentally friendly.
4.1.2 Logistics organisations of the CityMove partner
The partner in CityMove project is UGSAB (for DB SCHENKER) who’s a privately held transportation and logistics company in newly built premises on spark Street of Uppsala. Only dried goods are transported (standard box is used without refrigerating unit).
Logistics organisation of UGSAB is described as follows.
The goods are transported directly from the consigner to the consignee with and without reloading. UGSAB operates its deliveries in the cities through its own fleet (29 trucks called parcel, distribution and remote line truck and 10 trailers). All trucks are equipped Trucks are equipped with diesel engine and with tail gate lift. UGSAB has 40 drivers and 5 persons in the office. From main terminal to sub hub in Uppsala using parcel delivery, medium and remote trucks, UGSAB deliver about 10.000 stores and perform 700.000 deliveries per year. Two picking times at sub hub per day (9.00 am and 12.30 pm). A sub hub of Uppsala is delivered by trailers from the main terminal.
Several scenarios are used for the delivery from the sub hub to the city:
- Scenario A is a direct delivery from the main terminal to consignee directly. The vehicles used for that are mainly parcel and distribution trucks. The distance from the main terminal to the distribution area is about 10km. It continued inside the city with distribution consignees and collection and came back to the main terminal.
- Scenario B is an indirect distribution, from main terminal to Transfer/reloading point located inside the distribution zone and then from this point to consignees (a round with several stops or deliveries).
All vehicles are followed by GPS, including a temperature of the body recorded. Shipment is checked with electronic device (time delivery) device. Papers is signed by the customer, together with, in a majority of cases. Software for circuit optimised and delivered by the office is used: the drivers receive a list of shop to deliver and the way is known by the driver.
There is no restriction from authority concerning the gross vehicle weight but the total length of the truck should not exceed 8.5 meters. SCHENKER average load is not bigger than 2700 kg and takes 15 pallets – Total length of the truck should not exceed 8.5 meter, the trailer 6 meters long, 2.6 meters wide, 3.6 meters high. Lift plan should be 1.8 meters long. The best vehicle for theses deliveries could be a small trucks 10t there we could put goods together (no containers).
4.1.3 Impact evaluation
The VOLVO prototype will be tested in Uppsala.
The test with the medium truck could easily be implemented through SCHENKER with one of their exclusive subcontractors on specific SCHENKER deliveries.
Energy consumption reduction N u m b e r o f a cc id e n ts N u m b e r o f fa ta lit ie s C O 2 e m is si o n s S m a ll p a rt ic u la te e m is si o n s A v e ra g e n o is e N o is e p e rc e p ti o n V e h ic le f u e l e ff ic ie n cy V k m b y v e h ic le ( p e a k /o ff -p e a k ) M e a n j o u rn e y t im e s V e h ic le lo a d in g c a p a ci ty Lo w S te p C a b a n d L o w D e ck V e h ic le d ri v in g & lo a d in g /u n lo a d in g f a ci lit y O p e ra ti n g c o st s P ro d u ct io n c o st s N° Indicator 1 2 3 4 5 6 7 8 9 10 11 12 13 14
Uppsala Use Case - “Volvo” prototype x x x x x x x x x x
Use Case - “Volvo” Lyon-Uppsala simulation x x x x x x
LEVEL 4 - Strategic evaluation objectives covered by VOLVO
prototype (per Use Case)
Increase safety and security Air pollution reduction Air pollution reduction Noise
reduction Noise reduction
Some brief information on “business as usual scenario” of the freight transport and logistics service actually implemented by SCHENKER in Uppsala are provided as follows:
1) Logistics infrastructures (e.g. logistics platforms, warehouses, etc.): UGSAB – Schenker haulier have one logistic platform /HUB outside the city centre of Uppsala.
2) Type of vehicles (e.g. diesel, methane, LCV<3.5t, CV>3.5t&<16t, HCV>16t, etc.): All types.
3) Information technologies tools (e.g. tracking&tracing systems, delivery journeys planning, warehouse management systems, etc.): UGSAB has a delivery journeys planning system - AILOG and a joint booking system with Schenker.
4) Types of goods receivers (e.g. Large Organized Distribution, wholesale, retailers, etc.): 99% wholesale, retailers and 1% private customers.
5) Average trip length to deliver goods in specific area of the city where prototype will be implemented/simulated (e.g. km, Vkm, etc.): 0,5 km.
6) Average number of deliveries per trip in specific area of the city where prototype will be implemented/simulated: Each truck performs two trips per day and each trip has 7-8 stops (deliveries and pickups).
7) Average journey time per trip in specific area of the city where prototype will be implemented/simulated: Each trip (two per day) takes approximately 3-4 hours.
4.1.4 Process evaluation
The city administration and Schenker are positive, helpful and enthusiastic so we don’t recognise any barriers. There are no political or economic constraints either. Next year, Uppsala’s city centre will become a green zone. This implies that there will be new regulations implemented which force Schenkers/UGSABs to have even more environmentally friendly trucks. UGSABs trucks will have to be replaced by newer trucks and the City Move’s electric truck would be perfect for future deliveries. However there is one constraint: the battery on the truck has to last at least 4 hours driving time.
4.2 Bucharest Use Case - “Iveco” prototype A
4.2.1 Background and description
Bucharest is situated in the south eastern corner of the Romanian Plain, in an area once covered by the Vlăsiei forest, which, after it was cleared, gave way to a fertile flatland. The city has a total area of 226 square kilometres. The altitude varies from 55.8 metres (183.1 ft) at the Dâmbovița bridge in Cățelu, south-eastern Bucharest and 91.5 m (300.2 ft) at the Militari church. The city has a relatively round shape, with the centre situated approximately in the cross-way of the main north-south/east-west axes at University Square. The milestone for Romania's Kilometre Zero is placed just south of University Square in front of the New St. George Church (Sfântul Gheorghe Nou) at St. George Square (Piaţa Sfântul Gheorghe). Bucharest's radius, from University Square to the city limits in all directions, varies from about 10 to 12 km (6.25–7.5 mi). The city's population, according to the 2002 census, is 1,926,334 inhabitants or 8.9% of the total population of Romania.
Bucharest is also a major intersection of Romania's national road network. A few of the busiest national roads and motorways, link the city to all of Romania's major cities as well as to neighbouring countries such as Hungary, Bulgaria and Ukraine. The A1 to Piteşti and the A2 Sun Motorway to the Dobrogea region and Constanta both start from Bucharest. The future A3 and A5 motorways will radiate from Voluntari, a town in the city's northern outskirts.
The city's municipal road network is centred around a series of high-capacity boulevards, which generally radiate out from the city centre to the outskirts. The main axes, which run north-south, east-west and northwest-southeast, as well as one internal and one external ring road, support the bulk of the traffic. The city's roads are usually very crowded during rush hours, due to an increase in car ownership in recent years. Every day, there are more than one million vehicles travelling within the city. This results in occasional wear and potholes appearing on busy roads, particularly secondary roads, this being identified as one of Bucharest's main infrastructural problems. In recent years, there has been a comprehensive effort on behalf of the City Hall to boost road infrastructure and according to the general development plan, 2,000 roads have been repaired by 2008.
4.2.2 Logistics organisations of the CityMove partner
Logistics organisation of DANONE is described as follows.
DANONE operates its deliveries in the cities through its own fleet from central Romanian warehouses which are supplied from DANONE plant by medium and long haul trucks (outsourced).
A shuttle of semi-trailers delivers the Romanian central warehouse, in the close suburbs of Bucharest, from the plant about 1,5km away (24 hours a day, 3 shifts in the warehouse). The shuttles are fully loaded (quantity of palettes, not volume or weight):
- Distribution in the morning to Bucharest from warehouse (80 km per day per truck, about 2t load);
- Distribution to medium distance supermarkets and cities (about 400 km per day, subcontracted) between cities, including deliveries;
- Distribution to another warehouse in north of Romania with heavy semi trailers, subcontracted: 2 others “global” warehouses should be opened in Romania in a close future.
Average age of fleet is 5.5 years . DANONE has a program of renewal old trucks cost more in maintenance, fuel consumption, and taxes (linked to Euro level).
All vehicles followed by GPS, including a temperature of the body recorded. Deliveries with papers to be signed by the customer, together with, in a majority of cases, the payment of the goods to the driver. No software for circuit optimisation: the drivers receive a list of shop to deliver (can be alphabetic order) and decides the way to do.
Bucharest (and Romania) very regulated 2 zones which cover the wide majority of Bucharest:
- Zone A: approximately 4km diameter from city centre. It is no more than 5t GVW vehicles during days;
- Zone B: approximately 2 additional km outside of zone B. The weight in this zone is limited to 7,5t during days. Possibility with bigger trucks at nights.
4.2.3 Impact evaluation
Despite the fact that DANONE only operates directly LCVs in Romania, a test with a bigger truck (12 to 18t) could easily be implemented through DANONE with 1 of their exclusive subcontractors on specific DANONE deliveries.
Energy consumption reduction N u m b e r o f a cc id e n ts N u m b e r o f fa ta lit ie s C O 2 e m is si o n s S m a ll p a rt ic u la te e m is si o n s A v e ra g e n o is e N o is e p e rc e p ti o n V e h ic le f u e l e ff ic ie n cy V k m b y v e h ic le ( p e a k /o ff -p e a k ) M e a n j o u rn e y t im e s V e h ic le lo a d in g c a p a ci ty Lo w S te p C a b a n d L o w D e ck V e h ic le d ri v in g & lo a d in g /u n lo a d in g f a ci lit y O p e ra ti n g c o st s P ro d u ct io n c o st s N° Indicator 1 2 3 4 5 6 7 8 9 10 11 12 13 14
Bucharest Use Case - "Iveco” Prototype A x x x x x
"Iveco" Prototype B x x x x
Virtual Design (CATIA 3D Model) x
LEVEL 4 - Strategic evaluation objectives covered by IVECO
prototype (per Use Case)
Increase safety and security Air pollution reduction Air pollution reduction Noise
reduction Noise reduction
Detailed information will be provided into the Internal report “Use Case description”.
4.2.4 Process evaluation