Screening calculations for
radioactive waste releases from
non-nuclear facilities
2009:02
Authors: Shulan XuTitle: Screening calculations for radioactive waste releases from non-nuclear facilitiesReport Number: 2009:02
Author/Authors: Shulan Xu and Ann-Louis Söderman
Name of your company or institution/city and country: Swedish Radiation Safety Authority, Stockholm
Date: February 2009
This report concerns a study which has been conducted for the Swedish Radia-tion Safety Authority, SSM. The conclusions and viewpoints presented in the report are those of the author/authors and do not necessarily coincide with those of the SSM.
Summary
A series of screening calculations have been performed to assess the potential radiological consequences of discharges of radioactive sub-stances to the environment arising from waste from non-nuclear practi-ces. Solid waste, as well as liquids that are not poured to the sewer, are incinerated and ashes from incineration and sludge from waste water treatment plants are disposed or reused at municipal disposal facilities. Airborne discharges refer to releases from an incineration facility and liquid discharges refer both to releases from hospitals and laboratories to the sewage system, as well as leakage from waste disposal facilities. The external exposure of workers is estimated both in the waste water treatment plant and at the disposal facility. The calculations follow the philosophy of the IAEA’s safety guidance starting with a simple assess-ment based on very conservative assumptions which may be iteratively refined using progressively more complex models, with more realistic assumptions, as necessary.
In the assessments of these types of disposal, with cautious assumptions, carried out in this report we conclude that the radiological impacts on representative individuals in the public are negligible in that they are small with respect to the target dose of 10 µSv/a. A Gaussian plume model was used to estimate the doses from airborne discharges from the incinerator and left a significant safety margin in the results conside-ring the conservative assumptions in the calculations. For the sewage plant workers the realistic approach included a reduction in working hours and the shorter exposure time resulted in maximum doses around 10 µSv/a. The calculations for the waste disposal facility show that the doses are higher or in the range of the target dose. The excess for public exposure is mainly caused by H-3 and C-14. The assumption used in the calculation is that all of the radioactive substances sent to the incinera-tion facility and waste water treatment plant end up in the deposiincinera-tion site, which clearly is a conservative assumption for these two nuclides.
Sammanfattning
Stråldoserna till allmänhet och vissa arbetstagare har beräknats från hanteringen av avfall från icke kärntekniska verksamheter som använder öppna strålkällor. Avfallet går till förbränning eller ut i det kommunala avloppet, både askor från förbränning och slam från vattenreningsver-ket går sedan till deponi. Stråldosen till allmänheten från luftutsläpp är
beräknad på en anläggning som förbränner avfall innehållande radio-aktiva ämnen och från flytande avfall både för utsläpp i avlopp och för läckage från deponi. Stråldoser har också beräknats för arbetstagare som exponeras i vattenreningsverk och på deponi. Beräkningarna följer IAEA:s rekommendationer och börjar med en enklare bedömning grun-dad på konservativa antaganden som förfinas med mer komplexa model-ler och mer realistiska antaganden.
Utifrån de beräkningar som presenteras i rapporten och de konserva-tiva antaganden som beräkningarna fortfarande innehåller, bedöms stråldoserna vara låga. Spridningsberäkningar med Gauss plymmodell för luftutsläpp vid förbränning av avfall gav stråldoser till allmänheten under 10 µSv/år, för utsläpp till avlopp och intag av vatten och fisk från recipienten konstateras stråldosen bli ännu lägre. I beräkningen av strål-doser till arbetstagare i reningsverk har verkliga arbetstimmar använts till skillnad från tidigare beräkningar, och därmed uppskattas stråldo-sen som högst till strax över 10 µSv/år. Beräkningarna för deponi ger stråldoser över 10 µSv/år för både arbetstagare och allmänhet. Utifrån beräkningen ger H-3 och C-14 betydande bidrag till stråldosen via intag av ämnen som antas läcka ut från deponin. Beräkningarna för deponi är väldigt konservativa då de utgår från att alla radionuklider finns kvar i slammet från reningsverket och i askan från förbränningsanläggningen. Andra undersökningar visar att H-3 och C-14 avgår till luft vid förbrän-ning och stråldosen via läckage kan antas vara betydligt lägre än beräk-ningarna i rapporten visar.
Content
1. Introduction ...2
2. Discharges from normal operational practices...4
Discharge Rate 1 (DR1) – Activity based on reported information...4
Discharge Rate 2 (DR2) – Estimated maximum activity...5
Discharge rate to the sewage system (DRS)...5
3. Screening calculation of the radiological consequences for airborne radionuclides ...8
No dilution model ...8
Simple Gaussian plume model...10
Discussion...11
4. Screening calculation of the radiological consequences of releases to the sewage system from hospitals...12
No dilution model for radionuclides discharged to sewage system ...12
A dynamic model of radionuclides in a WWTP ...14
Assessment with more realistic assumptions...16
5. Screening calculations of the radiological consequences of disposals at a municipal disposal facility...19
Description of the object and estimation of activity concentrations....19
Expressions for dose calculations ...22
Input data ...25
Results ...25
6. Conclusions ...30
References...31
Appendix 1...33
Graphical results of time-integrated air concentrations for unit release ...33
Appendix 2...37
Definition of transfer rate coefficient and Input data of screening calculation for deposition site ...37
1. Introduction
A series of screening calculations have been performed in support of a revision of current national regulations concerning the disposal radioactive waste from non-nuclear practices (SSMFS 2008:50). According to the regulations users of unsealed radioactive sources may dispose of waste containing radioactive mate-rial by incineration or via the sewage system provided that the activity is below a specified activity limit for each of the nuclides involved. With a few exemp-tions the half lives of the radionuclides of concern are relatively short. The screening calculations are used to assess the potential radiological conse-quences of discharges to the environment of radioactive substances in the form of airborne or liquid effluents arising from normal operational practices. Air-borne discharges refer to releases from an incineration facility and liquid dis-charges refer both to releases from hospitals and laboratories to the sewer, as well as leakage from municipal waste disposal facilities. The calculations follow the philosophy of the IAEA’s safety guidance (IAEA, 2000), starting with a simple assessment based on very conservative assumptions which may be itera-tively refined using progressively more complex models, with more realistic assumptions, as necessary. The screening calculations mainly employ the mod-els documented by the IAEA (2001, 2005). As suggested by the IAEA (2005) no further calculations need be made when doses have been estimated in the range up to 10 µSv/a to the representative person. Therefore 10 µSv/a is used as a target dose in this report.
The objects selected for the screening calculations are:
a waste incineration facility which handles not only household and in-dustrial waste but also infected and contaminated waste from laborato-ries and hospitals,
a municipal waste water treatment plant which receives radioactive sub-stances in effluent discharged from hospitals and laboratories, and a municipal facility for waste disposal which receives, among others
things, both contaminated ash from the incineration facility and con-taminated digested sludge from the waste water treatment plant. The calculations have been performed for facilities located in Uppsala, the rea-son being that the incinerator there burns contaminated waste not only from Uppsala but also from the Stockholm region. Moreover, Avila et al., (2007) show that the calculated dose to representative persons due to radioactive sub-stances discharged in patients’ excreta, to the wastewater treatment plant, are highest for the Uppsala facility compared to more than twenty other investigated treatment plants from around the whole country. On the other hand, Mattsson and Erlandsson (1981) have analyzed the activity of I-131 from nuclear medi-cine in wastewater and concluded that, from a radiological protection point of view, no actions were necessary in order to reduce releases.
envi-liquid form, due to release from the disposal site were made “in house”, whereas the analysis of dose consequences due to the release from hospitals is based on the modelling study done by Avila et al. (2007).
2. Discharges from normal
operational practices
Dose calculations have been made using different discharge rates. Two dis-charge rates are used in dose calculations for releases from the incineration facil-ity: Discharge Rate 1 (DR1) is based on information from licence holders on activity in waste sent for incineration, according to the existing regulation (SSMFS 2008:50). Discharge Rate 2 (DR2) is based on the nuclide specific total activity according to the exemption levels in EU Council Directive
96/29/Euratom (the Basic Safety Standard Directive, BSS). The discharge rate to sewer is used in the dose calculation for hospital release (DRS). To assess
conse-quences of discharge from the disposal site, the discharge rate used (DRD) is
either DRD = DR1 + DRS or DRD = DR2 + DRS.
Discharge Rate 1 (DR
1) – Activity based on
reported information
In 2004, a number of research institutions were asked to provide information on estimated activity in discharges to the sewage system and solid waste sent for incineration (SSI, 2003). The estimation is made from the inventory of radionu-clides originally obtained by the licence holder and the pathways that the ra-dionuclides were likely to take in the process. DR1 is based on the information
from some of the largest users of unsealed sources in research in Uppsala. In order to cover the Stockholm area the activity from Uppsala was multiplied by a factor of two. The activity for P-32 is somewhat higher than expected for Upp-sala and it is not likely that the same activity is sent from the Stockholm area. Therefore the P-32 activity in waste from Stockholm is estimated to be the same activity as arising from Gothenburg.
Activity in waste from hospitals is based on registered waste sent for incinera-tion from the largest nuclear medicine department in Stockholm. The informa-tion did not cover a full year’s operainforma-tion but the activity for the rest of the year was calculated assuming the same amount of waste per month as in the informa-tion. To include radionuclides that had not been used during those seven months, the activity was estimated from the administration of those radionuclides to a known number of patients. Half lives are short for many of the radionuclides and several half lives are passed during pre-transport storage, some radionuclides were therefore not included in the information. In order to account for waste from all hospitals with nuclear medicine treatments in the area, but of which many use only a few radionuclides annually, the activity was multiplied by a factor of three.
Discharge Rate 2 (DR
2) – Estimated
maxi-mum activity
The figures used for DR2 are based on the nuclide specific exemption levels for
total activity found in the BSS directive and in the Radiation Protection Ordi-nance (SFS 1988:293). 11 hospitals and 20 research institutions located in the Mälaren region are assumed to send the maximum activity of the specified ra-dionuclides to Uppsala for incineration over ten months of the year. The maxi-mum activity is 10 times the exemption level per month for all radionuclides that might be used. The radionuclides and their activities are summarized in Table 1.
In circumstances where there is a mixture of radionuclides in the disposed waste, a maximum activity limit for the batch is likely to be imposed. In this calculation the maximum permitted activity of each radionuclide is used.
Discharge rate to the sewage system (DR
S)
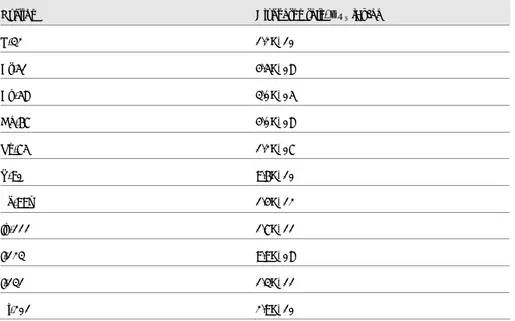
The estimated discharges to the sewage system are the same as in Avila et al., (2007). It is the maximum annual release from treatments in the period 1999-2004 from Akademiska sjukhuset in Uppsala. The figures are based on the activ-ity that administered to patients, assuming that 100 % of the activactiv-ity is released to sewage system. See Table 2.
Table 1. Estimated discharge rates (activity to incineration).
Nuclide Discharge rate DR1[Bq/a] Discharge rate DR2[Bq/a]
H-3 2.14E+10 2.00E+12 C-14 3.84E+09 2.00E+10 P-32 4.82E+10 1.00E+08 P-33 4.00E+08 2.00E+11 S-35 3.93E+09 2.00E+11 Ca-45 3.80E+07 Cr-51 4.58E+09 3.00E+10
Fe-59 1.60E+08 2.00E+09
Se-75 1.00E+09
Rb-86 5.50E+08
Sr-89 1.00E+09
Y-90 3.80E+08 1.00E+08
Tc-99m 1.00E+10
In-111 3.71E+09 1.00E+09
I-123 1.00E+10
I-125 3.84E+09 1.00E+09
I-131 3.46E+08 1.00E+09
Ti-201 1.00E+05
Table 2. The maximum annual release rates to the sewage system from both radiotherapy and diagnostics in
the period 1999-2004.
Nuclide Discharge rate, DRS[Bq/a]
P-32 1.2E+10 Cr-51 4.5E+08 Co-58 3.0E+05 Ga-67 4.0E+08 Se-75 1.2E+07 Y-90 9.6E+10 Tc-99m 1.4E+12 In-111 1.7E+11 I-123 9.9E+08 I-131 1.3E+11 Ti-201 2.9E+10
3. Screening calculation of
the radiological
conse-quences for airborne
ra-dionuclides
No dilution model
The incineration facility in Uppsala incinerates mainly waste from households and industries (55 tons per hour) together with peat to produce district heating for the city of Uppsala. The same facility incinerates waste containing radionu-clides from laboratories used for research purposes and hospitals. The waste is not only from the Uppsala region but also from the Stockholm region. The amount of radionuclides burned at the incineration facility is shown in Table 1. To evaluate dose to the representative person it is assumed that all the radionu-clides in the incinerated waste will be released to the air although, in reality, the flue gases pass through several layers of filters and a significant fraction of the radionuclides is likely to be removed from the stack release. As a first stage a no dilution model is used, as recommended by IAEA (2001):
V
Q
P
C
A
p i (1) where CA [Bq/m 3] is the ground level air concentration at downwind distance x,
Qi [Bq/a] is the average discharge rate for radionuclide i,
V [m3/a] is the volumetric air flow rate of the vent or stack at the point of re-lease,
Pp [-] is the fraction of the time the wind blows towards the receptor of interest.
Exposure pathways due to atmospheric release include inhalation of airborne radionuclides, external irradiation from airborne radionuclides and irradiation of the skin from radionuclides deposited on to the skin. However, the most signifi-cant short-term exposure pathway is the inhalation of airborne radionuclides (McColl and Prosser, 2002). Therefore, only the inhalation dose is calculated here. The annual effective dose from inhalation Einh [Sv/a] can be determined
based on the following expression (IAEA, 2001):
inh inh A
inh
C
R
DF
Rinh [m
3
/a] is the inhalation rate,
DFinh [Sv/Bq] is the inhalation dose coefficient.
Combining equation (1) and (2) the annual effective dose from inhalation is calculated using a simple Excel spreadsheet. The parameter values of Pp and Rinh
are taken from IAEA (2001), which are 0.25 [-] and 8400 [m3/a], respectively. The volumetric air flow rate is V = 3109 [m3/a], which the information is ob-tained from the incineration facility (Karlsson 2008).
Table 3 shows radionuclide dependent data and the calculated doses for inhala-tion.
Table 3. Calculated effective doses for inhalation using the no dilution model.
Nuclide Discharge rate
DR1 [Bq/a] Discharge rate DR2 [Bq/a] DFinh [Sv/Bq] Einh for DR1 [Sv/a] Einh for DR2 [Sv/a] H-3 2.14E+10 2.00E+12 4.50E-11 6.73E-07 6.30E-05 C-14 3.84E+09 2.00E+10 2.00E-09 5.38E-06 2.80E-05 P-32 4.82E+10 1.00E+08 3.40E-09 1.15E-04 2.38E-07 P-33 4.00E+08 2.00E+11 1.50E-09 4.20E-07 2.10E-04 S-35 3.93E+09 2.00E+11 1.40E-09 3.85E-06 1.96E-04
Ca-45 3.80E+07 2.70E-09 7.18E-08
Cr-51 4.58E+09 3.00E+10 3.20E-11 1.03E-07 6.72E-07 Fe-59 1.60E+08 2.00E+09 3.70E-09 4.14E-07 5.18E-06
Se-75 1.00E+09 1.00E-09 7.00E-07
Rb-86 5.50E+08 9.30E-10 3.58E-07
Sr-89 1.00E+09 6.10E-19 0.00E+00 4.27E-16 Y-90 3.80E+08 1.00E+08 1.40E-09 3.72E-07 9.80E-08
Tc-99m 1.00E+10 1.90E-11 1.33E-07
In-111 3.71E+09 1.00E+09 2.30E-10 5.97E-07 1.61E-07
I-123 1.00E+10 7.40E-11 5.18E-07
I-125 3.84E+09 1.00E+09 5.10E-09 1.37E-05 3.57E-06 I-131 3.46E+08 1.00E+09 7.40E-09 1.79E-06 5.18E-06
Tl-201 1.00E+05 4.40E-11 3.08E-12
Simple Gaussian plume model
Since the total dose calculated using the no dilution model exceed the target dose of 10 µSv/a, a more detailed model with more realistic assumptions, such as a Gaussian plume model, is employed to evaluate the consequences of radio-active substances discharged to the atmosphere. The Gaussian plume model is widely used in radiological assessment activities for short and medium range dispersion (Clark, 1979, Jones, 1983 and McColl and Prosser, 2002). It is necessary to know the wind speed of the site and the weather conditions when one uses the Gaussian plume model. The weather conditions – the so called ‘stability’ – of the atmosphere reflect variations in the intensity of turbu-lence. Based on a range of experimental observations Pasquill (1961) suggested values for dispersion parameters to be used in the Gaussian plume model for seven weather categories (designated A to G) in order of increasing atmospheric stability. Graphical results of time-integrated air concentration from the Gaus-sian plume model for unit release, as a function of distance, under different at-mospheric stability categories are given in Jones (1983) and McColl and Prosser (2002). These graphical results can be easily used for assessment purposes. Fig-ure A-1 (in Appendix 1) shows air concentrations given at ground level along the axis of the plume as a function of effective release height for a short (30 minute) release for various weather categories.
The height of radioactive release from the incineration facility is 100 m (Karls-son, 2008). As a conservative estimation, the highest time integrated concentra-tion (210-5 Bq s/m3 per Bq released, see Fig. A1-a) for the most unfavourable weather category is chosen for the dose calculation. Using this time integrated concentration the annual effective dose from inhalation can be calculated by:
inh inh i TIA i inh
Q
C
R
DF
E
, (3) whereQi [Bq/a] is the average discharge rate for radionuclide i,
CTIA,i [Bq s/m3] is the time-integrated concentration of radionuclide i in air,
Rinh [m3/s] is the inhalation rate,
DFinh [Sv/Bq] is the inhalation dose coefficient.
Doses calculated both with the realistic discharge rate (DR1) and the conserva-tive discharge rate (DR2) – shown in Table 4 – are under 10 Sv/a. Result from Gaussian plume model give a dilution factor of around 130 compared to the result from the no dilution model.
Table 4. Calculated effective doses for inhalation using the simple Gaussian plume model. Nuclide Discharge rate DR1 [Bq/a] Discharge rate DR2 [Bq/a] DFinh [Sv/Bq] Einh for DR1 [Sv/a] Einh for DR2 [Sv/a] H-3 2.14E+10 2.00E+12 4.50E-11 5.12E-09 4.79E-07 C-14 3.84E+09 2.00E+10 2.00E-09 4.09E-08 2.13E-07 P-32 4.82E+10 1.00E+08 3.40E-09 8.72E-07 1.81E-09 P-33 4.00E+08 2.00E+11 1.50E-09 3.20E-09 1.60E-06 S-35 3.93E+09 2.00E+11 1.40E-09 2.93E-08 1.49E-06
Ca-45 3.80E+07 2.70E-09 5.47E-10
Cr-51 4.58E+09 3.00E+10 3.20E-11 7.80E-10 5.11E-09 Fe-59 1.60E+08 2.00E+09 3.70E-09 3.15E-09 3.94E-08
Se-75 1.00E+09 1.00E-09 5.33E-09
Rb-86 5.50E+08 9.30E-10 2.72E-09
Sr-89 1.00E+09 6.10E-19 3.25E-18
Y-90 3.80E+08 1.00E+08 1.40E-09 2.83E-09 7.46E-10
Tc-99m 1.00E+10 1.90E-11 1.01E-09
In-111 3.71E+09 1.00E+09 2.30E-10 4.54E-09 1.23E-09
I-123 1.00E+10 7.40E-11 3.94E-09
I-125 3.84E+09 1.00E+09 5.10E-09 1.04E-07 2.72E-08 I-131 3.46E+08 1.00E+09 7.40E-09 1.36E-08 3.94E-08
Tl-201 1.00E+05 4.40E-11 2.34E-14
Total dose 1.08E-06 3.91E-06
Discussion
There remains a significant safety margin in these results, considering the con-servative assumptions we have made in the calculations, such as that all the radionuclides in the waste are released to the atmosphere, the highest time inte-grated concentration for the most unfavourable weather category is chosen and wind direction is constant etc.
4. Screening calculation of
the radiological
conse-quences of releases to
the sewage system from
hospitals
No dilution model for radionuclides
dis-charged to sewage system
Radiological consequence screening calculations for radionuclides released to a wastewater treatment plant (WWTP), from hospitals performing both radiother-apy and diagnostics, have been conducted by Avila et al. (2007). The models used in the screening calculation were developed for the Uppsala WWTP. How-ever, the models can also be applied to plants of similar design. The annual dis-charge rate from the Uppsala Akademiska sjukhuset used in the calculation is shown in Table 2, in which it was assumed that all administered activity reached the Uppsala WWTP.
The “no dilution” model for radionuclides discharged to the sewage system, recommended by the IAEA (2001), is used in two alternative calculation cases by Avila et al. (2007):
Table 5. Results of the calculations for the Uppsala WWTP for Case 1 (after Avila et al., 2007). Doses shown
for radionuclides exceeding the target of 10 µSv/a.
Nuclide
Dose water ingestion [Sv/a]
Dose fish ingestion [Sv/a]
Dose total [Sv/a]
P-32 9.8E-07 2.4E-03 2.5E-03
Y-90 9.0E-06 1.3E-05 2.2E-05
In-111 1.7E-06 8.7E-04 8.7E-04
Table 6. Results of the calculations of the exposure of workers for the Uppsala WWTP obtained for Case 2
(after Avila et al., 2007). Doses shown for radionuclides exceeding the target of 10 µSv/a.
Nuclide Dose External [Sv/a] Dose Inhalation [Sv/a] Dose Total [Sv/a]
Tc-99m 1.4E-02 2.6E-10 1.4E-02
In-111 2.4E-04 5.9E-10 2.4E-04
I-131 1.7E-03 1.5E-08 1.7E-03
TI-201 8.8E-05 1.9E-10 8.8E-02
Table 7. Results of the calculations of food ingestion doses resulting from the use of sludge from the Uppsala
WWTP for landfill (Case 2 – full retention in the sludge) (after Avila et al., 2007). Doses shown for radionu-clides exceeding the target of 10 µSv/a.
Nuclide Dose Crops [Sv/a] Dose Milk [Sv/a] Dose Meat [Sv/a] Dose Total [Sv/a]
P-32 1.8E-03 4.7E-03 1.4E-03 8.0E-03
Tc-99m 3.3E-19 1.4E-04 7.0E-28 1.4E-04
I-131 2.3E-03 2.4E-03 6.9E-04 5.3E-03
TI-201 2.9E-05 1.1E-05 3.0E-07 4.0E-05
Case 1 - No retention in sewage sludge. In this case it was assumed that the
radionuclides released from the hospital are not retained in the sewage sludge, i.e., all radionuclides entering the WWTP will reach the final destination of the wastewater (implicitly a surface water body – a lake or stream – from which can be used as a source of fish and drinking water). Further, it was assumed that no dilution of the wastewater discharged from the plant occurs before the water is used and exposure occurs. This maximizes the estimates of activity concentra-tions in water. The calculated exposure pathways in this case were: doses to an adult from ingestion of contaminated water and fish.
Case 2 - Full retention in sewage sludge. In this case it was assumed that the
radionuclides entering the WWTP are fully retained in the sludge, which maxi-mizes the
estimate of the activity concentration in the sludge. The calculated exposure pathways in this case were: doses to a WWTP worker from external exposure to the sludge and from incorporation of sludge particles via inhalation; doses to an adult from ingestion of food produced on agricultural land where the sludge has been used as fertiliser/soil.
Details of the calculations with the “no dilution” model, together with input site data and dose conversion factors, can be found in Avila et al., (2007). Those calculated doses which exceed the target dose are shown in Tables 5 to 7. As can
be seen, the dose to workers at the treatment plant, according to Case 2, is domi-nated by the external exposure pathway. The assumption behind the calculation being that the plant workers are exposed to airborne particulates derived from the contaminated sludge during the whole of their working time at the plant i.e., 2000 hours per year.
A dynamic model of radionuclides in a
WWTP
The first screening calculation made by Avila et al., (2007) showed that more realistic assessments of the dose to workers and members of the public were needed. They subsequently developed a more detailed model to address the dy-namic behaviour of radionuclides in the WWTP. This is due to the fact that dis-charges of radionuclides from hospitals are not constant throughout the year but occur as a series of discrete pulses each with a duration of a few days. In this way they were able to estimate more realistic concentrations of radionuclides in the sludge.
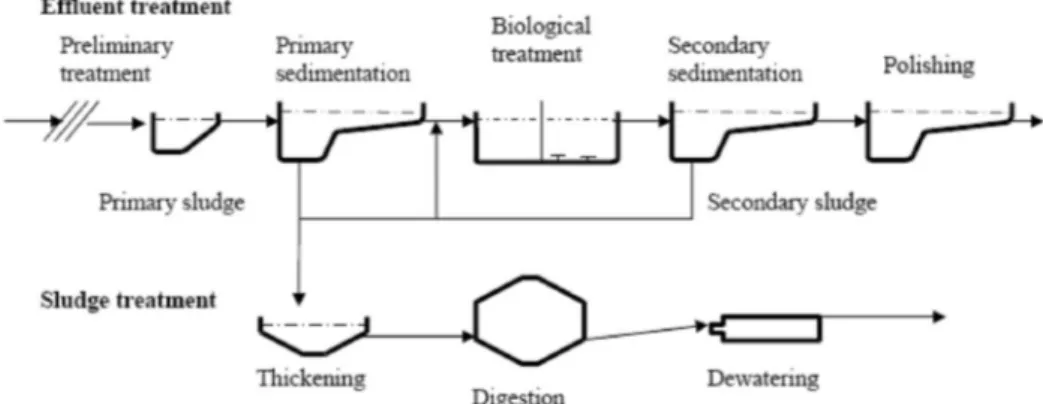
The system for wastewater treatment at the Uppsala WWTP is shown in Fig. 1. Wastewater entering the plant is treated by different processes (mechanical, biological and chemical) for purification of the wastewater, while the sludge treatment aims mainly at stabilising and reducing the volume of the generated sludge.
Figure 2. Conceptual representation of the dynamic model for the Uppsala WWTP. The boxes correspond to
model compartments and the arrows to radionuclide fluxes between compartments (after Avila et al., 2007). The dynamic model consists of a number of compartments used to describe the treatment system, and is shown schematically in Fig. 2. The model is mathe-matically expressed by a system of ordinary differential equations (ODE) repre-senting mass balance in different compartments.A first order ODE accounts for radionuclide fluxes in to and out of each of the compartment as well as losses by radioactive decay. The fluxes between compartments are calculated by multiply-ing a transfer rate coefficient (TC) by the radionuclide inventory in the com-partment. The details of model expressions and transfer coefficients can be found in Avila et al., (2007).
A key idea used in the dynamic model is the Kd concept. The distribution
coeffi-cient (Kd) is the ratio of radionuclide concentration in sludge to that in water,
and is used to link sludge concentrations in, and radionuclide fluxes from, each compartment. However, distribution coefficients for sewage sludge are not read-ily available for the nuclides of interest in this study. Accordingly, due to the high organic content of the sludge, Kd values for organic soils are suggested by
Avila et al. (2007) as being suitable for the calculations. To explore the effect of uncertainties in Kd values on dose consequences the calculations were performed
using Kd values defined as probability distributions. Details of the values used in
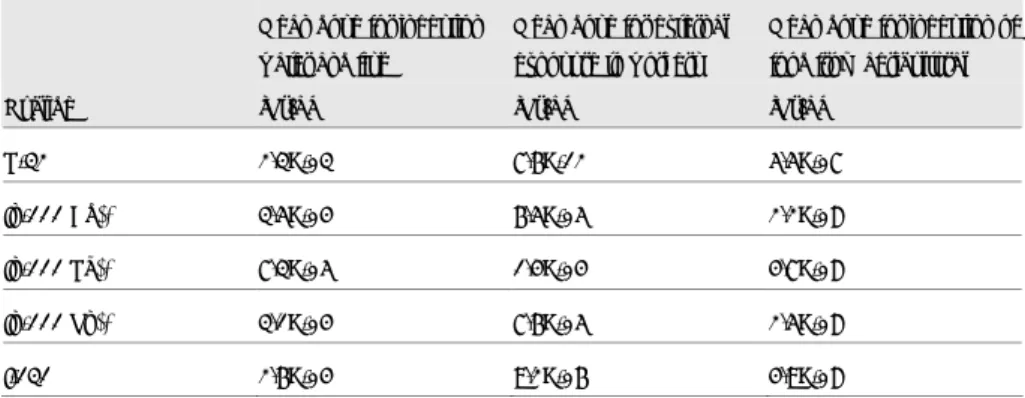
the calculation are given in Section C-3 of Appendix C in Avila et al., (2007). Those results which exceed the target dose from the calculations using more complex models, are shown in Table 8. As can be seen the calculated mean dose for the pathways due to ingestion of food produced from agricultural land using sludge as fertiliser/soil are low. This is because the concentrations of radionu-clides in the sludge are now more realistic. The mean external dose to WWTP workers is now one or more orders of magnitude below the values obtained from the first screening step. However, for In-111 the mean dose to workers is about 140 µSv/a. The mean In-111 dose from ingestion of water and fish is almost unchanged from the first screening calculation. The reason for this is that the
same assumption is used in the simulations with the dynamic model, i.e., no dilution of the treated wastewater, so that the concentration of In-111 in the water body used as a source of drinking water and fish is close to that in the initial screening calculation. Therefore, further assessment with more realistic assumptions is required.
Table 8. Results of probabilistic simulation of doses over all relevant pathways (after Avila et al., 2007).
Nuclides with results for exceeding the 10 µSv/a dose target.
Nuclide
Mean dose for ingestion water and fish [Sv/a]
Mean dose for external exposure to workers [Sv/a]
Mean dose for ingestion of food from agricultural [Sv/a]
P-32 2.3E-03 7.6E-12 5.5E-07
In-111(Cd)* 3.5E-04 6.5E-05 2.2E-08
In-111(Pb)* 7.3E-05 1.4E-04 4.7E-08
In-111(Sn)* 3.1E-04 7.6E-05 2.5E-08
I-131 2.6E-04 9.2E-06 4.9E-08
* Three set of Kd values corresponding to values reported for Cd, Pb and Sn are used for In and TI (Avila et al., 2007).
Assessment with more realistic assumptions
The calculated doses for I-131, In-111 and P-32 using the complex models are still above the target dose for the exposure to the public via ingestion of water and fish from the water body and the external exposure to workers. As men-tioned earlier, two conservative assumptions used in calculations for both the “no dilution” model and the dynamic complex model are:
1) no dilution of the treated wastewater from the WWTP occurs before the water is used by members of the public,
2) workers are assumed to be exposed to the contaminated sludge during their whole working time at the plant i.e., 2000 hours per year. The results in the new iteration with revised, more realistic, assumptions are shown below.
Exposure to the public via ingestion of water and fish from
the wastewater recipient water body
Discharge from the Uppsala WWTP is to the river Fyrisån. The mean flow rate of the river Fyrisån is 10 m3/s according to the data given by the programme of air, water and landscape sciences, Uppsala University, at their internet site (www.fyris-on-line.nu/default.asp). Comparing the flow rate of the river Fyrisån with the mean annual flow rate of treated wastewater at Uppsala WWTP, 1.73107 m3/a (Avila et al., 2007, p.76 Table B-5), there is a dilution factor of 18, which reduces the doses calculated with the complex dynamic model.
For P-32 there is a further process to consider in addition to the dilution of efflu-ent from the WWTP, namely the removal of phosphorus from the wastewater by chemical precipitation. According to the Swedish Environment Agency’s report, the removal rate for phosphorus in the processed wastewater at Swedish
WWTPs has averaged around 95% (Naturvårdsverket, 2006). The dose for in-gestion of P-32 from contaminated water and fish from the downstream water body can therefore be further scaled.
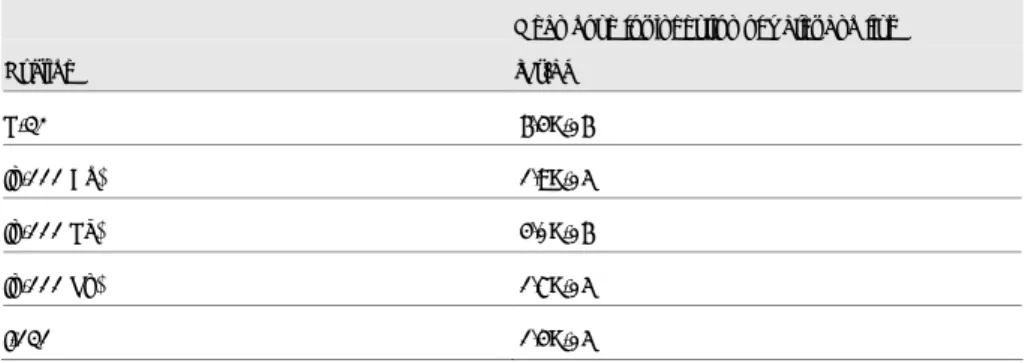
The revised results are shown in Table 9.
Table 9. Doses to the public via ingestion of water and fish from the recipient of the discharge from the
WWTP are scaled by the dilution factor and the phosphorus removal rate from the previous results obtained by the complex dynamic model.
Nuclide
Mean dose for ingestion of water and fish [Sv/a] P-32 6.4E-06 In-111(Cd) 1.9E-05 In-111(Pb) 4.0E-06 In-111(Sn) 1.7E-05 I-131 1.4E-05
Table 9 shows the mean dose from ingestion of water and fish derived from Table 8. The calculations do not take into account the radionuclide decay in the river. The half-lives of I-131 and In-111 are 8.0 and 2.8 days, respectively. If the effect of the decay in the recipient is taken into account the real doses for inges-tion of water and fish would be significantly lower.
External exposure of workers
The assumption used in the assessment (Avila et al., 2007) based on IAEA (2001) is that workers in at WWTP are exposed to external radiation for 2000 hours per year. This is comparable to total number of working hours per year. To formulate more realistic assumptions for the external dose calculation, in-formation on the procedures and workers’ exposure scenarios at WWTPs was gathered during visits and questionnaires (SSI, 2008). In several plants, a few workers were involved in situations where they could be exposed to external radiation, but only for a short time. Workers spend time in close proximity to sludge mainly while cleaning oxygen- and sludge level monitors or sampling sludge for analyses. In a small plant it was noticeable that one person was near sludge in different places in the plant, this was the person doing all the sampling of both primary and digested sludge. Altogether, the maximum exposure time was estimated to be 5.5 hours per week.
The exposure time in a WWTP is not comparable with full working hours. The estimated time for this is between one and four hours per week, corresponding to between 48 and 192 hours per year per individual, taking vacation periods into account. This result reduces the exposure time by a factor of 10. Results for this iteration are shown in Table 10. Here, even I-131 is below the target of 10 µSv/a and In-111 has doses around the target, depending on the kd assumed for sewage
sludge. The target is slightly exceeded if the Kd is the same as that for lead.
Table 10. The doses to the workers via external exposure are scaled by the reducing factor from the previous
results obtained by the complex model.
Nuclide
Mean dose for external exposure to workers [Sv/a]
In-111(Cd) 6.5E-06
In-111(Pb) 1.4E-05
In-111(Sn) 7.6E-06
I-131 9.2E-07
The sludge from WWTPs is mainly used as a covering material at landfills. It is also used as fertilizer on golf courses, in forests and for gardening.
5. Screening calculations of
the radiological
conse-quences of disposals at a
municipal disposal facility
Description of the object and estimation of
activity concentrations
The municipal disposal facility – Hovgården at Uppsala – handles waste from the Uppsala region, including waste from households, industry, digested sludge from the Uppsala WWTP and ash from the incineration facility. In 2007, the Hovgården facility received 125 000 tonnes of waste, of which 107 000 tonnes could be recycled either by onward transport or by use as construction material within the Hovgården facility (VA- och Avfallskontoret, 2008). The facility has been in operation since 1971.
As a conservative screening calculation it is assumed that all the radioactive substances sent tothe incineration facility and the WWTP end up in the disposal site, which means the annual input of radionuclides to the facility is the sum of the radionuclides listed in Tables 1 and 2. It is also assumed that all the radionu-clides in disposed material are available for migration. The disposal site system can be abstracted as a small set of distinct media so that radionuclide transport from the waste mass can be represented schematically by the elements of Fig. 3, according to IAEA (2005).
Deposited, contaminated waste Unsaturated zone Aquifer Mw,iTw,i Muz,iTuz,i Ugw Cw,i
Figure 3. Schematic description of transport processes for the radioactive waste sent to the municipal
dis-posal site.
Two scenarios are chosen for the calculations. One is for a worker exposed to contaminated material within the waste mass at the disposal facility. Exposure pathways include external irradiation from the bulk material and inhalation of contaminated dust. The second scenario assumes leaching of material from the waste form by infiltrating precipitation with subsequent migration to an aquifer underlying the disposal site. This is known as the ‘water path scenario’. From the aquifer, radionuclides can then enter the human food chain if the well water abstracted from the aquifer is used as a source of drinking water or for irrigation in a private garden. An additional consideration in this scenario is the consump-tion of fish from a river into which the groundwater discharges. Doses from the two scenarios are evaluated separately.
The mathematical description of the mass balance in different compartments of the disposal system (see Fig. 3) can be written as the following ordinary differ-ential equations (ODE):
i w i i w i w i in i w
M
M
T
F
dt
dM
, , , , ,
(4) i uz i i uz i uz i w i w i uzM
M
T
M
T
dt
dM
, , , , , ,
(5) Waste: 18 000 tons/a for 40 yearsMw,i [Bq] is the inventory of radionuclide i in compartment waste
mass,
Muz,i [Bq] is the inventory of radionuclide i in compartment
unsatu-rated zone,
Fin,i [Bq/a] is the flux of radionuclide i from outside, i.e., the disposal
rate,
Twaste,i [1/a] is the transfer rate coefficient of radionuclide i from the
waste mass to unsaturated zone,
Tuz,i [1/a] is the transfer coefficient of radionuclide i from the
un-saturated zone to the aquifer,
i [1/a] is the decay rate of the radionuclide i.
The initial conditions are
0
0
,t
M
wi (6)
0
0
,t
M
uzi (7)For a constant annual source term Fin,i = const., Eqs. (4) and (5) can be solved
analytically with these initial conditions. The solutions are given below:
i i w i in t T i i w i in t T i wT
F
e
T
F
e
M
wi i wi i
, , , , , , , (8)
T T t i w i uz i w t T i i uz i i w i in i w t T i uz i w i uz i i uz i i uze
T
T
T
e
T
T
F
T
e
M
, , , , , , , , , , , ,
i w i uz i i uz i i w i w i uz i in i wT
T
T
T
T
T
F
T
, , , , , , , ,
(9)The activity concentration in the well water, cw,i, can then be calculated
accord-ing to s gw i aq i w
U
U
F
c
, , , (10) whereUgw [m3/a] is the groundwater flow in the aquifer below the contaminated and unsaturated zones. It is expressed as
gw gw gw gw gw
p
v
w
z
U
,i aq
F
, [Bq/a] is the flux of radionuclide i from the unsaturated zone to the aquifer, and can be obtained fromF
aq,i
M
uz,iT
uz,i,Us [m3/a] is the water flow through unsaturated zone and is further ex-pressed as
U
sIA
cz,zgw [m] is the thickness of the aquifer,
wgw [m] is the width of the contaminated zone perpendicular to the flow of the aquifer,
vgw [m/a] is the porewater velocity of the groundwater,
pgw [-] is the effective porosity of the aquifer,
Acz [m2] is the surface area of the contaminated zone.
The activity concentration in the deposited waste, Cgd,i, is calculated by:
waste i w i gd
W
M
C
,
, (11) whereMw,i [Bq] is the inventory of radionuclide i in compartment waste
ob-tained from Eq. (8), and
Wwaste [kg] is the annual amount of the waste deposited.
The definitions of the transfer rate coefficients, Twaste,i and Tuz,i, can be found in
Appendix 2.
Expressions for dose calculations
Once activity concentrations in well water and waste mass are determined, the consequence calculations can be performed. In the two scenarios given in IAEA (2005) the expressions are as follows:
Worker exposed to the contaminated waste form at the
deposition site
Workers are exposed to contaminated material deposited to the waste mass at the disposal site. Exposure pathways include external irradiation from the mate-rial and the inhalation of resuspended contaminated dust. The following equa-tions are used in the calculation of external and inhalation doses:
e i gd i gd i gd
C
DF
t
E
,
, , (12) whereEgd,i [Sv/a] is the external radiation dose from radionuclide i
Cgd,i [Bq/g] is the activity concentration of the waste for
ra-dionuclide i,
DFgd,i [Sv/h per Bq/g] is the dose coefficient for exposure to a uniformly
mixed volume of radionuclide i in the waste mass
te [h/a] is the exposure duration.
e inh dust c i inh i gd i res
C
DF
f
C
R
t
E
,
, , (13) whereEres,i [Sv/a] is the annual dose from inhalation of radionuclide i with
resuspended contaminated dust,
Cgd,i [Bq/g] is the activity concentration of the waste mass for
radionu-clide i,
DFinh,i [Sv/Bq] is the dose coefficient for intake by inhalation for
radionu-clide i,
fc [-] is the concentration factor for dust,
Cdust [g/m
3
] is the concentration of resuspended particles in air,
Rinh [m
3
/h] is the inhalation rate,
te [h/a] is the exposure duration.
Ingestion of contaminated water and foodstuffs
Leaching of radionuclides from the contaminated wasteform may give rise to doses from the exploitation of water resources downstream from the disposal site. Exposure pathways in this scenario include ingestion of contaminated drinking water from the well, contaminated food produced in a private garden where the well water is used for irrigation, as well as fish contaminated as a result of the discharge of contaminated groundwater to a river. The following equation can also be used to calculate all ingestion doses:
i ing p i p i p ing
C
H
DF
E
, ,
, , (14) whereEing, p,i [Sv/a] is the annual effective dose from consumption of nuclide i in foodstuff p,
Cp,i [Bq/kg] is the concentration of radionuclide i in foodstuff p at the
time of consumption,
Hp [kg/a] is the consumption rate for foodstuff p,
DFing,i [Sv/Bq ] is the dose coefficient for ingestion of radionuclide i.
When this equation is used to calculate the dose arising from drinking water consumption, Hp would be the drinking water intake rate, Hwater, and Cp,i would
be the concentration of radionuclides in well water, i.e., the Cw,i calculated from
To calculate the dose from the consumption of contaminated vegetables from a private garden irrigated by well water, the activity concentration of radionuclide
i in vegetables, Cv,i, and the consumption rate for vegetables, Hveg will be used in
equation (14). Cv,i is calculated from the activity concentration of soil, Csoil,i,
which in turn is calculated from the activity concentration of well water Cw,i.
The following equations are used to estimate Csoil,i and Cv,i:
i soil v i v
F
C
C
,
, (15) whereCv,i [Bq/kg] represents the fresh vegetables
consumed by humans,
Fv [(Bq/kg fw plant)(Bq/kg dw soil)
-1
] is the concentration factor for uptake of the radionuclide from soil by edible parts of crops,
Csoil,i [Bq/kg] is the concentration of
radionu-clide i in dry soil, defined by
E soil b E i i soilt
d
C
1
exp
, (16) usingλE [1/d] is the effective rate constant for the net removal of
activity in the rooting zone of soils, where λE = λi +
λs:
λs [1/d] is the rate constant for the removal of activity
de-posited in the rooting zone owing to processes other than radioactive decay,
tb [d] is the duration of the discharge of radioactive
mate-rial,
soil [kg dw soil /m2] is a standardised surface density for the effective rooting zone soil,
di [Bq/m
2
a] is the deposition rate and is given as di = Cw,i Ir
where Cw,i [Bq/m
3
] is the concentration of nuclide i in the well water and Ir [m/d] is the average
irriga-tion rate over the period of irrigairriga-tion.
To calculate the dose from the consumption of contaminated fish from the river the activity concentration of radionuclide i in fish, Cfish,i, and the consumption
rate of fish, Hfish are used in equation (15), where Cfish,i is calculated by:
i i r i fish
C
BF
C
,
, (17)BFi [Bq/kg (Bq/l)
-1
] is the bioaccumulation factor in fish for radionuclide
i,
Cr,i [Bq/l] is the activity concentration of radionuclide i in river
water, defined by d s i uz i uz i r
f
U
M
T
C
1000
, , ,
(18) wherefd [-] is the dilution factor.
Input data
The values of the parameters used in calculations of activity concentrations and doses are listed in Table A-1 in Appendix 2. The values of radionuclide depend-ent parameters are shown in Table A-2 in Appendix 2. The Kd values are
se-lected from IAEA (2001, 2005), however, not all the values of Kd for
radionu-clides of interest are available in these documents. The values of Kd for In-111
and Ti-201 are taken from Avila et al., (2007). The Kd values for Y-90, Ga-67
and At-211 are assumed to be zero and Cr-51 and S-35 as 50 [cm3/g]. Further, the same Kd values are used for both in contaminated zone and unsaturated zone
due to a lack of site specific information.
Results
Using the data given in Table A-1 and A-2 activity concentrations can be calcu-lated according to equations (10), (11) and (18) assuming continuous annualised input of radionuclides for 40 years. As an example, Fig. 4 shows the activity concentrations in disposed waste and well water for Se-75. As can be seen, the activity concentrations quickly reach equilibrium, after only a few years. The maximum concentrations are used in our dose calculations.
a) 0 5 10 15 20 25 30 35 40 2.8 2.85 2.9 2.95 3 3.05 3.1x 10 -4 Time (years) A ct iv ity c on ce nt ra tio n (B q/ g) b) 0 5 10 15 20 25 30 35 40 0.45 0.46 0.47 0.48 0.49 0.5 Time (years) A ct iv ity c on ce nt ra tio n (B q/ m 3 )
Figure 4. Se-75 activity concentration vs time. a) Activity concentration in disposed waste, b) Activity
Table 11. Comparison of calculated doses to workers exposed at the disposal site.
Nuclide Egd [Sv/a] Eres [Sv/a] Egd [Sv/a] Eres [Sv/a] Discharge rate: DR1+ DRs Discharge rate: DR2+ DRs
H-3 3.24E-09 3.03E-07 C-14 2.01E-09 1.05E-08 P-32 9.96E-10 2.00E-10 P-33 5.20E-12 2.60E-09 S-35 1.63E-10 8.28E-09 Ca-45 6.11E-12
Cr-51 2.89E-07 1.83E-12 1.75E-06 1.11E-11 Co-58 1.55E-09 7.26E-14 1.55E-09 7.26E-14 Fe-59 6.74E-07 8.91E-12 8.42E-06 1.11E-10 Ga-67 3.15E-07 2.60E-13 3.15E-07 2.60E-13 Se-75 3.18E-08 7.03E-13 2.68E-06 5.91E-11 Rb-86 7.77E-08 3.57E-12
Sr-89 5.48E-10 1.39E-10
Y-90 1.40E-10 1.39E-12
Tc-99m 2.19E-06 2.45E-12 2.19E-06 2.45E-12 In-111 1.10E-05 4.09E-11 1.08E-05 4.02E-11 I-123 4.40E-09 1.50E-14 4.89E-08 1.66E-13 I-125 6.68E-09 4.59E-10 1.74E-09 1.19E-10 I-131 2.72E-05 2.89E-09 2.74E-05 2.91E-09 Tl-201 2.56E-07 1.50E-12 2.56E-07 1.50E-12 At-211 1.72E-10 4.27E-12
Table 12. Comparison of calculated doses for ingestion of contaminated water and food. Nuclide Eing(water) [Sv/a] Eing (vegeta-bles) [Sv/a] Eing (fish) [Sv/a] Eing(water) [Sv/a] Eing (vegeta-bles) [Sv/a] Eing (fish) [Sv/a] Discharge rate: DR1 + DRs Discharge rate: DR2 + DRs
H-3 1.44E-06 4.10E-06 2.44E-11 3.84E-05 3.83E-04 2.28E-09 C-14 6.13E-06 2.58E-05 5.21E-06 9.12E-06 1.34E-04 2.71E-05 P-32 1.54E-12 1.73E-14 1.31E-12 8.83E-14 3.47E-15 2.63E-13 P-33 3.30E-15 6.67E-17 2.81E-15 4.72E-13 3.34E-14 1.40E-12 S-35 1.22E-12 5.07E-14 1.66E-14 1.77E-11 2.58E-12 8.45E-13 Ca-45 3.48E-12 2.26E-13 5.92E-14
Cr-51 7.75E-15 1.70E-19 2.64E-17 1.34E-14 1.03E-18 1.60E-16 Co-58 5.67E-21 2.49E-23 2.89E-23 1.62E-21 2.49E-23 2.89E-23 Fe-59 2.86E-15 9.88E-20 9.71E-18 1.02E-14 1.24E-18 1.21E-16 Ga-67 1.25E-11 9.64E-17 8.48E-14 3.56E-12 9.64E-17 8.48E-14 Se-75 8.96E-10 8.54E-12 3.05E-12 2.16E-08 7.19E-10 2.57E-10 Rb-86 1.68E-13 4.94E-16 5.72E-15
Y-90 4.93E-09 3.11E-14 2.52E-12 1.40E-11 3.10E-16 2.51E-14
Sr-89 1.31E-11 5.56E-13 5.85E-14
Tc-99m 9.61E-15 9.61E-18 6.54E-17 2.74E-15 9.61E-18 6.54E-17 In-111 1.32E-17 8.83E-23 2.25E-18 3.72E-18 8.68E-23 2.21E-18 I-123 7.93E-17 6.86E-22 5.39E-20 2.52E-16 7.63E-21 5.99E-19 I-125 2.81E-10 2.75E-13 1.91E-13 2.09E-11 7.16E-14 4.97E-14 I-131 2.35E-10 2.98E-14 1.60E-13 6.75E-11 3.00E-14 1.61E-13 Tl-201 8.40E-19 4.02E-21 1.43E-20 2.40E-19 4.02E-21 1.43E-20 At-211 1.06E-12 1.26E-16 2.71E-16
Total dose 3.75E-05* 5.21E-06 5.65E-04* 2.72E-05
* Calculated dose is the sum of the ingestion of the water and the vegetables.
Calculations are performed using two discharge rates, i.e., the sum of discharge rate 1 and discharge to sewer or the sum of discharge 2 and discharge to sewer, given in Table 1 and 2. Once the activity concentrations are determined in vari-ous media the effective doses for different pathways can be calculated according to equations (12), (13) and (14). The calculated doses from two discharge rates are compared in Table 11 and 12, with two scenarios and different exposure
Dilution of the seepage entering the groundwater and seepage entering river water are two important parameters determining activity concentrations in well water and the river, which in turn affect the calculated doses. In the absence of site specific data, most parameter values used in this assessment were either assumed or generic, however, the calculated dilution factor between seepage and groundwater is 0.016 from our calculations, which is within the range (0.007 to 0.06) that is used in IAEA (2005). The dilution factor between seepage and river water is 2.510-5 which is taken directly from IAEA (2005).
As can be seen, calculated doses for the exposed worker scenario are of the same order as the target dose for both discharge rates. The calculated doses for the water path scenario are of similar magnitude except for discharge rate DR2 in the case of water and vegetables consumption, where doses are 50 times higher than the target dose. This excess is mainly caused by H-3 and C-14. However, the assumption used in the calculation is that all of the radioactive substances sent to the incineration facility and WWTP end up in the deposition site. This is clearly a conservative assumption, especially for these two nuclides.
Partitioning of radionuclides in during incineration is of relevance for this dose assessment. According to McDonnel et al (1997) is possible to predict the parti-tioning of radionuclides due to their chemical and physical properties; for exam-ple, tritium will convert to tritiated water and follow the mass balance of water in the cleaning system. Tritium will therefore vaporise and be emitted through the stack or, if there is a wet gas cleaning system, a significant fraction of the total tritium will take that route. Neither wet scrubbers or nor wet gas cleaning will remove carbon-14 which will be thus discharged to air. Therefore, the cal-culated doses for the water path scenario are clearly an upper limit.
6. Conclusions
Waste from unsealed radioactive material in the non-nuclear sector passes out of regulatory control when it enters the general waste stream. It is important that such disposals – to incinerators, waste water treatment plants via the sewage system and disposals at municipal waste facilities – do not give rise to exposures to the public which are of regulatory concern. In the assessments of these three types of disposal, with cautious assumptions, carried out in this report we con-clude that the radiological impacts on representative individuals are small with respect to the target dose 10 µSv/a. The excess in the calculation on disposal facilities is mainly caused by H-3 and C-14. However, the assumption used in the calculation is that all of the radioactive substances sent to the incineration facility and WWTP end up in the deposition site. This is clearly a conservative assumption, especially for these two nuclides.
The derived analytical solutions, equation (8) and (9), simplify the implementa-tion of the IAEA’s deposiimplementa-tion model for the water path scenario. No special numerical tools are required and estimations of dose can be performed using a simple Excel spreadsheet.
References
Avila, R., Cruz, I., Sundell-Bergman, S. and Hasselblad, S. (2007). Radiological consequences of radionuclide releases to sewage systems from hospitals in Swe-den. SSI rapport 2007:10. Statens strålskyddsinstitut.
Clarke. R. H. (1979). The first report of working group on atmospheric disper-sion. A model for short and medium range dispersion of radionuclides released to the atmosphere. Chilton. UK. NRPB-R91.
European Union Council Directive 96/29/Euratom
IAEA (2000). Regulatory control of radioactive discharges to the environment (IAEA safety standards series. ISSN 1020-525X; No. WS-G-2.3).
IAEA (2001). Generic models for use in assessing the impact of discharges of radioactive substances to the environment. (Safety report series. ISSN 1020-6450; No.19).
IAEA. (2005). Derivation of activity concentration values for exclusion. exemp-tion and clearance. (Safety reports Series. ISSN 1020-6450; No.44).
Jones. J. A. (1983). The fifth report of a working group on atmospheric disper-sion. Models to allow for the effects of coastal sites. plume rise and buildings on the dispersion of radionuclides. and guidance on the value of deposition velocity and washout coefficients. Chilton. UK.. NRPB-R157.
Karlsson, A. (2009). SSM dnr 2009/473.
Mattsson S. and Erlandssson B. (1981) Medicinskt använda radionuclider i av-loppsvatten och slam. Slutrapport projekt SSI/P105.
McColl. N. P. and Prosser. S. L. (2001). Emergency Data Handbook. Chilton. UK.. NRPB-W19.
McDonnell C. E., Welham D., Knott J. A. and Miller T. Partitioning of 3H, 14C, 32
P, 35S and 125I in a modern waste incinerator. Journal of Radiological Protec-tion Vol. 17 No.2 (1997) pp 95-104.
Möre H., Hubbard L. M. (2005). Kommentarer och vägledning till föreskrifter och allmänna råd om hantering av aska som är kontaminerad med cesium-137. SSI rapport 2005:7.
Naturvårdsverket (2006). Rening av avloppsvatten i Sverige 2004. Rapport 8251. ISBN 91-620-8251-5.
Pasquill. F. (1961). The estimation of the dispersion of windborne material. Met. Mag. 90. no. 1063. 33.
SSI (2003). SSI dnr 55/3800/03. SSI (2008). SSI dnr 2008/100-22. SSM (2009). SSM dnr 2009/473.
SSMFS 2008:50. Regulations on Radioactive Waste Not Associated with Nu-clear Energy.
VA- och Avfallskontoret. (2008). Miljörapport 2007, Hovgårdens avfallsan-läggning (in Swedish). Uppsala Kommun.
Appendix 1
Graphical results of time-integrated air
con-centrations for unit release
a)
b)
d)
f)
g)
Figure A-1. On-axis ground-level time-integrated concentration as a function of effective release height for a
Appendix 2
Definition of transfer rate coefficient and
In-put data of screening calculation for
deposi-tion site
The transfer rate coefficient, Tw,i,, of radionuclide i from the waste to the
unsatu-rated zone is written as (IAEA, 2005):
cz i cz cz i w
R
z
I
T
, (A-1) whereI [m/a] is the infiltration rate,
cz [-] is the volumetric water content of the contaminated zone,
zcz [m] is the thickness of the contaminated zone,
Ri cz
[-] is the retardation factor for radionuclide i and further is given by:
cz cz i d cz cz i
K
R
,1
(A-2) wherecz [g/cm3] is the density of the contaminated zone,
Kdi [cm
3
/g] is the distribution coefficient for radionuclide i.
In IAEA’s model it is assumed that there is an unsaturated zone between the contaminated material and the aquifer. The transport rate Tuz,i through
unsatu-rated zone is defined as:
uz S uz uz i uz i uz
R
p
R
z
I
T
,
(A-3) wherepuz [-] is the effective porosity of the unsaturated zone,
zuz [m] is the thickness of the unsaturated zone,
Rsuz [-] is the saturation ratio of the unsaturated zone,
Ri uz
[-] is the retardation factor for radionuclide i in the unsaturated zone and further is given by:
uz uz i d uz uz i
K
R
,1
(A-4)where
uz [g/cm3] is the density of the unsaturated zone,
uz [-] is the volumetric water content of the unsaturated zone,
Kdiuz [cm3/g] is the distribution coefficient for radionuclide i.
Table A-1. Values parameters used in dose calculations.
Symbols Definitions Units Values Notes
I the infiltration rate [m/a] 0.2 IAEA (2005) cz the volumetric water content of the contaminated
zone
[-] 0.4 IAEA (2005)
zcz the thickness of the contaminated zone [m] 5 IAEA (2005)
cz the density of the contaminated zone [g/cm3] 1.8 IAEA (2005)
Puz the effective porosity of the unsaturated zone [-] 0.4 IAEA (2005) zuz
the thickness of the unsaturated zone [m] 2 IAEA (2005)
uz
the volumetric water content of the unsaturated zone
[-] 0.4 IAEA (2005)
uz the density of the unsaturated zone [g/cm3] 1.8 IAEA (2005) RS
uz
the saturation ratio of the unsaturated zone [-] 0.4 IAEA (2005)
zgw
the thickness of the aquifer [m] 5 IAEA (2005)
wgw the width of the contaminated zone [m] 200 Assumed in this study vgw the pore water velocity of groundwater [m/a] 1000 IAEA (2005) pgw the effective porosity of the aquifer [-] 0.25 IAEA (2005) Acz the area of the contaminated zone [m2] 20000 [I] Assumed in this study λs the rate constant for reduction of the concentration [1/a] 0 Assumed in this study
tb the duration of the discharge of radioactive material [a] 27.4 IAEA (2001)
Wwaste the amount of deposited waste [ton] 18000 VA- och Avfallskontoret (2008)
te the exposure time [h/a] 2000 IAEA (2005)
Cdust the particle concentration in air [g/m3] 0.001 IAEA (2005)
Rinh the inhalation rate [m3/a] 8400 IAEA (2001)
Hfish the consumption rate for fish [kg/a] 7.5 IAEA (2005)
Hwater the consumption rate for drinking water [m3/a] 0.7 IAEA (2005)
Hveg the consumption rate for vegetables [kg/a] 70 IAEA (2005)
Table A-2. Values of nuclide dependent parameters in dose calculations. Nuclides iI [1/a] Kd,i [cm3/g] Fv,iII [-] BFiII [Bq/kg per Bq/L] DFgd,iI [µSv/h per Bq/g ] DFing,iI [Sv/Bq] DFinh,iI [Sv/Bq]
H-3 5.78E-2 0 1E+0 1E+0 0E+0 4.2E-11 2.6E-10 C-14 1.22E-4 0 7E-1 5E+4 0E+0 5.8E-10 5.8E-10 P-32 1.78E+1 50 1E+0 5E+4 0E+0 2.4E-9 3.2E-9 P-33 9.9E+0 50 1E+0 5E+4 0E+0 2.4E-10 1.4E-9 S-35 2.89E+0 50 6E-1 8E+2 0E+0 7.7E-10 1.3E-9 Cr-51 9.12E+0 50 1E-3 2E+2 4.72E-3 3.8E-11 3.6E-11 Co-58 3.65E+0 5000 8E-2 3E+2 1.7E-1 7.4E-10 9.6E-9 Fe-59 5.78E+0 160 1E-3 2E+2 2.19E-1 1.8E-9 3.5E-9 Ga-67 7.76E+1 0 3E-3 4E+2 5.5E-1 1.1E-9 5.5E-10 Se-75 2.1E+0 0 1E-1 2E+2 5.25E-2 2.6E-9 1.4E-9 Sr-89 4.95E+0 15 3E-1 7.5E+1 2.44E-5 3.07E-8 7.5E-9 Y-90 9.5E+1 10 3E-3 3E+1 0E+0 2.7E-9 1.5E-9 Tc-99m 1.0E+3 5 5E+0 4E+2 1.41E-2 2.2E-11 1.9E-11 In-111 9.0E+1 2000 3E-3 1E+4 5.12E-2 2.9E-10 2.3E-10 I-123 4.62E+2 10 2E-2 4E+1 1.85E-2 2.1E-10 7.6E-11 I-125 4.08E+0 10 2E-2 4E+1 6.39E-5 1.5E-8 5.3E-9 I-131 3.15E+1 20 2E-2 4E+1 5.93E-2 2.2E-8 7.6E-9 TI-201 8.35E+1 2000 2E+0 1E+3 6.64E-3 9.5E-11 4.7E-11 I
values taken from IAEA (2005).