2012:68
Assessment of cost for
dismantling of Ringhals 2 PWR
G. Varley Author:
Abstract
This study concerns a review of the estimated cost for dismantling the
Ringhals-2 Nuclear Power Plant (NPP). The reasonableness of the cost
estimate has been tested by comparing with contemporary
bench-marking data derived from actual NPP decommissioning projects in the
United States. The results of the study illustrate the value of systematic
comparisons and the derivation of benchmarks in regard to the high
level validation of estimated future dismantling costs.
Background
The Financing Act stipulates that future expenses for dismantling of
Nu-clear Power Plants (NPP) shall be financed from segregated funds that
are supervised by the Swedish Nuclear Waste Fund (SNWF).
Transparency of and confidence in the process to ensure collection of
sufficient funds is fundamental for the acceptance and sustainability
of the Swedish model for estimating environmental liabilities related to
dismantling of NPPs in Sweden.
Objectives of the project
The aim of this study has been to test the reasonableness of the
availa-ble data on estimated dismantling costs for Ringhals-2, substantially by
making a comparison with the actual cost of dismantling the Trojan NPP
in the U.S. and supported by other benchmark data derived from U.S.
dismantling projects underway or completed at the Zion and Rancho
Seco NPPs.
Results
The conclusions of the study suggest that the present interim estimates
made by SKB for Ringhals-2 dismantling probably are on the lower side
i.e. there is a risk that the estimated future cost for dismantling of
Ring-hals-2 may be underestimated. The extent of any such underestimate is
strongly dependent on assumptions for differences in labour rates and
productivity. With the most favourable assumptions about Swedish
rela-tive productivity the level of underestimation is estimated to be minimal.
On the contrary, with lower productivity the degree of under-estimation
can be substantial.
Project information
Geoffery Varley, Vice President of Fuel Cycle Consulting at NAC
Inter-national has performed the task with skill. At SSM Staffan Lindskog has
carried-out stewardship of the entire project.
2012:68
Author: G. Varley
NAC International, Branch Henley-on-Thames, England
Assessment of cost for
This report concerns a study which has been conducted for the
Swedish Radiation Safety Authority, SSM. The conclusions and
view-points presented in the report are those of the author/authors and
do not necessarily coincide with those of the SSM.
Contents
Introduction ... 3
1. Summary ... 4
2. Trojan Decommissioning Program ... 5
2.1 Overall Scope ... 5
2.1.1 Estimate ... 5
2.1.2 Actual Experience ... 6
2.2 Basic Principles and Techniques Applied ... 6
2.2.1 Estimate ... 6
2.2.2 Actual Experience ... 6
2.3 Planning and Licensing ... 6
2.3.1 Estimate ... 6
2.3.2 Actual Experience ... 7
2.4 Timing and Phasing of D&D ... 7
2.4.1 Estimate ... 7
2.4.2 Actual Experience ... 7
2.5 General Techniques and Methodologies ... 8
2.5.1 Decontamination ... 8
2.5.2 Dismantling of Contaminated Components (excluding RPV and Reactor Internals) ... 9
2.5.3 Dismantling Reactor Internals and RPV (Activated Components) ... 10
2.5.4 Demolition of Buildings and Site Restoration ... 14
2.5.5 Innovative Activities that benefited the Trojan D&D experience ... ... 15
2.6 Manpower Resources and Costs ... 15
2.6.1 Estimate ... 15
2.6.2 Actual Experience ... 16
2.7 Waste Management ... 19
2.7.1 Volumes and Masses ... 19
2.8 Building Demolition and Site Restoration ... 20
3. Other Benchmark References ... 21
3.1 Rancho Seco RPV Dismantling ... 21
3.2 Zion Decommissioning ... 22
4. Comparison of Ringhals 2 Cost Estimate with U.S. Benchmarks .... 25
4.1 Ringhals 2 Cost Estimate Status ... 25
4.2 U.S. Regulatory Financial Requirements ... 25
4.3 Interim Revised Ringhals 2 Cost Estimate ... 26
4.4 Summary of U.S. Decommissioning Benchmarks ... 27
4.4.1 Trojan and Zion ... 27
4.4.2 Other U.S. References ... 28
Tables/Figures
Table 2-1 Comparison of Projected and Actual Decommissioning Time Requirements (years)
Table 2-2 Trojan Employee Numbers by Year during Decommissioning (FTE)
Table 2-3 Costs ($M 2011) and Manpower for Decommissioning the Trojan PWR (man years)
Table 3-1 Rancho Seco RPV Segmentation Cost ($2006) and Direct Labour (manhours)
Table 3-2 Forecast Wastes from Zion Decommissioning Table 4-1 Summary Breakdown of Interim Revised Ringhals 2
Decommissioning Cost Estimate
Table 4-2 Summary of Trojan and Zion D&D Benchmarks
Figures
Figure 2-1 Trojan Facilities for Decommissioning Figure 2-2 RPV Removal from Inside the Containment
Figure 2-3 Preparation of the RPV Outside the Containment Prior to Shipping
Figure 2-4 Loading of the RPV onto a Barge adjacent to the NPP Figure 2-5 RPV Barge Transport on the Columbia River
Figure 2-6 Offloading of the RPV in Washington State Figure 2-7 Road Transport to LLW Disposal Site Figure 2-8 Unloading of RPV into LLW Disposal Trench Figure 2-9 Burial of RPV in LLW Disposal Trench
Figure 3-1 Schematic of S.A. Technology for Rancho Seco RPV Segmentation
Figure 3-2 Aerial View of the Zion Site
Figure 4-1 U.S. NPP D&D Cost Comparison for PWRs of Different Thermal Power (Relative)
Introduction
An international benchmarking comparison of nuclear power plant decommissioning cost estimates was completed by NAC International in 1995 and presented in an SKI report 95:65 entitled “An Evaluation of Cost Estimates of Nuclear Power Reactor Decommissioning in Sweden, Germany and the United States” dated November 1995 (hereinafter referred to as SKI 95:65). The main reason for performing the analysis at that time was to investigate the reason for there being a large discrepancy in the estimated decommissioning costs between Sweden, Germany and the U.S. for very similar PWRs and BWRs. The main reasons for these differences were clari-fied.
In the study performed for SKI, Ringhals 2 was used as the Swedish reference for decommissioning of a PWR and the Trojan nuclear plant was the U.S. PWR refer-ence. At that time Trojan was a shutdown reactor but decommissioning had not started in earnest. Accordingly the projected decommissioning information for Tro-jan was used in the benchmarking comparison.
Decommissioning of the Trojan nuclear plant now has been completed and infor-mation regarding actual decommissioning is available as a basis for an updated comparison with Swedish estimates for Ringhals 2. The cost estimate for Ringhals has not yet been updated in detail and such an update will not be available until the first half of 2013. As an interim step, some adjustments to the estimate have been made taking into account a more detailed estimate that has been completed for reac-tors in Barsebäck and using scaling facreac-tors for reacreac-tors of different type and size developed by the U.S Nuclear Regulatory Commission. A comparison between the latest data for Ringhals 2 and the actual Trojan data is the main basis for the content of this report.
The assumed decommissioning method for the Ringhals 2 reactor pressure vessel (RPV) involves segmentation, packaging and disposal. The Trojan actual method involved removal intact followed by disposal. A direct comparison between Ring-hals 2 and Trojan for this specific package of decommissioning activity therefore is not possible. The report therefore includes supplementary information on the seg-mentation and removal of the RPV at the Rancho Seco PWR in California. At this site, with the exception of the low-level waste and dry spent nuclear fuel storage facilities, the U.S. Nuclear Regulatory Commission has released it for unrestricted use.
To provide additional overall perspectives on decommissioning methodologies and costs, the report also includes information recently released by Zion Solutions in connection with the on-going decommissioning of the Zion twin PWRs that were operated by Exelon until 1996/97.
Financial information made available in respect of actual Trojan decommissioning was in U.S dollar 1997 money values. The latest available Ringhals 2 total cost estimate is quoted in Swedish Krona 2011 money values. In order to facilitate a meaningful comparison of monetary data, the Trojan figures have been inflated to U.S. dollar 2011 money values and then converted to Swedish Krona using the 2011 weighted average exchange rate of 6.5 SEK/$.
1. Summary
U.S. actual decommissioning and dismantling (D&D) experience principally at the Trojan and Zion PWRs has been investigated and analysed to develop benchmarking references that may be used to assess the reasonableness of the latest Swedish D&D cost estimate for the Ringhals 2 PWR (R2).
These data have been used to develop a constructed cost range that might be ex-pected to apply for R2. The analyses have taken into account the size difference between R2 and the U.S. reactors concerned (Trojan and Zion each 3,411 MWth versus 2,650 MWth for R2) and the fact that Zion is a twin PWR NPP with D&D activities for both units performed in parallel (potentially resulting in cost savings compared with a stand-alone D&D program for one reactor).
The analyses have investigated fundamental resource requirements, for example labour hours needed, rather than purely looking at costs. This has enabled the appli-cation of Swedish labour rates to translate U.S. D&D experience into a Swedish cost context.
The latest R2 cost estimate is an interim value based on a starting point of more detailed estimates performed for the Barsebäck BWR reactors (approximately two thirds the size of R2) and then applying scaling factors derived from U.S. NRC guidelines on D&D funding requirements for NPPs of different types (BWR, PWR) and different thermal powers.
The nominal R2 D&D cost derived on this basis is MSEK 1,513, excluding a con-tingency for uncertainties. Uncertainty overall has been assigned at a level of about 22 per cent, to give a gross estimate of up to MSEK 1,850.
In comparison, the U.S. benchmark analyses suggest the actual cost could be higher. The difference could be as low as 5 per cent or as high as about 60 per cent (perhaps even more). The percentage difference inter alia is sensitive to assumptions about Swedish versus U.S. relative labour rates and associated productivity levels in the D&D context, as well as on assumptions about the ratio of costs for reactors of dif-ferent thermal power.
2. Trojan Decommissioning
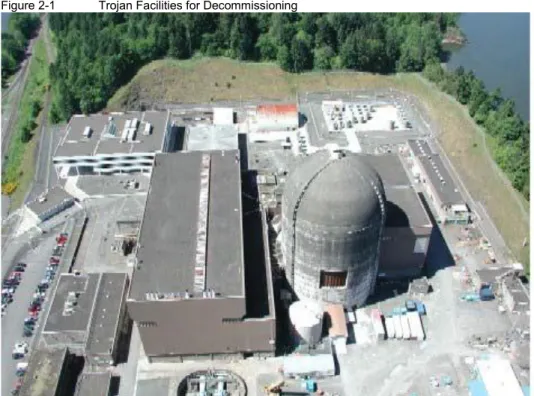
An aerial view of the facilities that were decommissioned at the Trojan site is pre-sented in Figure 2 1.
Figure 2-1 Trojan Facilities for Decommissioning
2.1
Overall Scope
2.1.1
Estimate
SKI 95:65 lists an overall decommissioning scope that includes the following activi-ties:
Planning and preparation activities
Reactor core unloading
License and construct an ISFSI
Chemical decontamination
RPV internals removal and packaging
RPV and systems dismantlement
Waste treatment
Radiological survey
2.1.2
Actual Experience
The basic scope listed above was the same for both projected and actual activities. Appendix A provides a detailed list of events and associated dates of the significant activities associated with the Trojan decommissioning program.
2.2
Basic Principles and
Techniques Applied
2.2.1
Estimate
SKI 95:65 lists the following basic principles and techniques forecast to be used at Trojan:
D&D objective – remove radioactivity so 10CFR50 license can be termi-nated
Plant operates for 30 EFPY (equivalent full power years) over a period of 40 calendar years
D&D occurs at a single reactor site so economies of scale do not apply
Reactor Pressure Vessel (RPV) is to be segmented over a six-week period during building dismantlement
Equipment and methodologies are assumed to be proven and available so no breakthrough R&D is required
2.2.2
Actual Experience
In contrast to the Trojan decommissioning plan, in reality Trojan operated for less than 15 EFPY. The impact of this on the decommissioning cost is judged to be neg-ligible. Neutron activation of some components will have been somewhat less but probably without any consequence for the categorization of waste for disposal, or for the method of dismantling. The volume of some operational wastes, such as ion exchange resins for reactor system and spent fuel pool water treatment will have been smaller than planned.
A major difference in the decommissioning methodology was that the RPV was not segmented. It was removed intact, filled with reactor internals and buried at the U.S. Ecology LLW facility in Washington State. This yielded considerable cost savings. Hence, more details of which are presented in section 2.5.3.2 and section 2.7.1.2.
2.3
Planning and Licensing
2.3.1
Estimate
SKI 95:65 indicates that the planning and licensing phase of the Trojan decommis-sioning program would include:
2 documents submitted to the NRC for information
5 documents submitted to the States of Oregon and Washington for review and approval
Licensing costs would include review of licensing applications and processing by the NRC. Planning costs would include conceptual and detailed plans.
2.3.2
Actual Experience
The planning and licensing scope was the same for both projected and actual activi-ties. Appendix A contains chronology of the approval of some of the major docu-ments.
2.4
Timing and Phasing of D&D
2.4.1
Estimate
Table 2.2 of SKI 95:65 indicated 10.62 years of elapsed time from reactor shutdown to completion of Trojan D&D activities. The process for obtaining a decommission-ing license was estimated to require 3.0 years and the process was foreseen to begin 2.5 years before reactor shutdown.
2.4.2
Actual Experience
Table 2-1 compares the actual time required to perform the D&D activities versus the original projection. The durations for each described activity or phase are not necessarily additive, because some were taking place concurrently. Accordingly the total elapsed time is lower than the sum of the individual activities.
The process to obtain a decommissioning license began only at the time of reactor shut down, rather than 2.5 years before shutdown, because reactor closure was premature and relatively sudden. This timing change is believed to have not affected the cost of such activities.
The period of shutdown operation, measured from plant shut down up to the point when all spent nuclear fuel (SNF) was transferred into away-from-reactor (AFR) dry storage, lasted for almost 10.6 years, much longer than planned (6.9 years). This period included a 3.4 year delay because the dry storage equipment initially pro-cured did not operate correctly in the spent fuel pool. The contract with the original dry storage supplier was terminated and an alternate supplier secured. Without this delay, the elapsed time was about 7.2 years, much closer to the original projection. The time required for loading the SNF into dry storage canisters was almost 0.6 years.
Table 2-1 Comparison of Projected and Actual Decommissioning Time Requirements (years)
Activity US PWR- Projected Trojan - Actual
Decommissioning License 3.0 3.25
Shutdown Operation 6.9 10.58 (7.2)
Removal of Final Core 0.5 0.58
Decontaminate RPV & Primary System 0.42 -
Procure Special Equipment 2.5 -
Service Operation 1.7 -
System Dismantlement 2.0 4.6
Total 10.62 12.33 (8.93)
The time required for actual dismantlement is an estimate based on available infor-mation. This work took place in discrete phases on a non-continuous basis. The elapsed time of 4.6 years indicated in Table 2-1 reflects an integration of these sepa-rate phases and will include activities that were broken out into sepasepa-rate items in the original projection.
The overall program duration turned out to be 12.3 years but this would have been only about 8.9 years if the SNF dry storage equipment problem had not been experi-enced – about 1.7 years less than projected.
2.5
General Techniques and
Methodologies
2.5.1
Decontamination
2.5.1.1
Estimate
SKI 95:65 indicated that the Trojan project would achieve a decontamination factor of 10, resulting in 84 m3 of dewatered ion-exchange resin from the decontamination project, incorporating 185 TBq of radioactivity.
2.5.1.2
Actual
2.5.2
Dismantling of Contaminated Components
(excluding RPV and Reactor Internals)
2.5.2.1
Estimate
SKI 95:65 lists five technologies for cutting and segmenting major contaminated systems and components that it was expected would be used in the Trojan D&D project, as follows:
Circular pipe cutter
Shearing
Diamond Rope Saw
Plasma-arc
Oxy-acetylene gas
Based on use of these cutting technologies, SKI 95:65 listed the following planned procedures:
Cutting of the reactor coolant circuit piping into 4.5 m sections using plas-ma arc technology
Cutting of other piping (steam and water pipes with diameters in the range of 0.019 – 0.36 m), also into 4.5 m sections, using circular pipe cutters or shears
Valves up to 76 mm would be left attached to the piping
Removal of large components (steam generators, reactor coolant pumps, reactor coolant motors, and pressurizer was based on removal intact i.e. not segmented
Segmentation and packaging into standard containers of the pressurizer re-lief tank
Intact removal, or with as little segmentation as possible, for other large components including tanks, ion exchange vessels and overhead cranes. Electrical supplies, compressed air, demineralized water and other service systems, would be available for the dismantling work. Such systems would be dismantled only when it was no longer possible to operate the systems due to the process of dismantling. It was foreseen that, during the last stages, mobile air compressors may have to be used. Other service functions, such as workshops, laundry, and surveil-lance would be retained as necessary.
2.5.2.2
Actual Experience
Due to airborne radiological considerations, mechanical cutting and/or shearing were the methods preferentially deployed, rather than the plasma-arc and/or oxy-acetylene gas torches methods. This was consistent with the assumptions in develop-ing the original D&D cost estimate. Sheardevelop-ing was used whenever possible because this technique minimized the quantity of radioactive debris compared to other cut-ting technologies. However, several notable exceptions include the following activi-ties:
One major exception involved the spent fuel pool liner. The original plan was to use mechanical cutting techniques to separate the liner from the concrete pool foundation. Due to the large number of liner anchors that
The pressurizer relief tank was a carbon steel tank with a stainless steel lin-er. The tank was located in a concrete shielded cubicle and so there was no external access to segment the tank. Two openings were cut to provide ac-cess and ventilation, after which segmentation proceeded from inside the tank, initially using handheld circular saws with abrasive blades of 35.6 cm diameter. After a ‘near miss’ incident involving the use of that saw, the segmentation technique was changed to an "air-arc" hot cutting method, which consisted of a copper clad carbon rod connected to a welding ma-chine. An air hose was used to remove the molten metal.
An Oxy-Propane cutting torch was used for some of the thicker walled pip-ing and equipment that required segmentation.
Another major exception to the original plan involved disposal of the concrete shield walls that surrounded the steam generators and pressurizer. The original plan called for scabbling the top layer of concrete to a depth of between 7.62 and 15.24 cm. Early on in this phase of work it was determined that activation of the concrete was more extensive than contemplated. A modified approach had to be adopted and the shield walls were completely removed, crushed into rubble, loaded into bags and transported by rail to a facility in the State of Tennessee for further processing and eventually buried in the LLW facility in Clive, Utah. A mainline rail track runs past the Trojan site but a rail spur had to be constructed in order to facilitate loading of the concrete rubble. This expense was not included in the original D&D estimate but the estimated cost was in the range of 393 – 589 MSEK only.
The scope of supply for plant services was the same for both projected and actual activities.
2.5.3
Dismantling Reactor Internals and RPV
(Activated Components)
2.5.3.1
Estimate
SKI 95:65 listed the following planned methods and procedures for dismantling the reactor internals and the RPV.
A temporary support structure would be needed to support the RPV during the dismantling work.
The RPV would be segmented using an oxy-acetylene torch and the seg-ments would be packaged in steel boxes suitable for disposal.
The waste would be classified as Class C waste or below, meaning that it could be buried in a low level waste site.
All reactor internals would be dismantled under water using plasma-arc technology. The internals include the upper and lower core support assemblies, the upper core plate, the core shroud, the core baffle and portions of the lower core support struc-ture, including the lower grid plate. It was foreseen that these probably would fall in the greater than Class C (GTCC) waste category. The remaining internals would be segmented and buried in a LLW site. Such components would be segmented into sections that would fit into canisters the same size as fuel assemblies, so that the canisters could be stored first in the spent fuel pool and then in the dry spent fuel storage facility. Depending on shielding needs, the remaining reactor internals would be segmented and placed in modified or standard containers.
2.5.3.2
Actual Experience
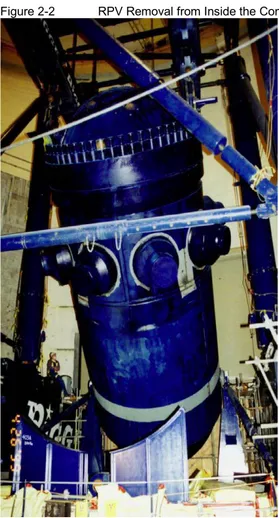
The most significant difference between projected and actual methods and tech-niques involves the disposal of the RPV and associated reactor internals. Instead of segmenting the RPV and internals, the internals were loaded back into the RPV, after which the RPV was filled with low density concrete. It was then removed from the containment, sealed using shrink wrap, placed on a barge and transported over 430 kilometres to the U.S. Ecology LLW facility located in central Washington State. The sequence of activities associated with disposing of the RPV is depicted in Figure 2-2 through Figure 2-9. This was facilitated by the very unique situation of the NPP and the waste disposal sit both being adjacent to the Columbia river, ena-bling easy access for barge transport of the large RPV package. Other reactors may have no alternative but to segment before removal, due to transport infrastructure dimension limitations.
Figure 2-3 Preparation of the RPV Outside the Containment Prior to Shipping
Figure 2-4 Loading of the RPV onto a Barge adjacent to the NPP
Figure 2-6 Offloading of the RPV in Washington State
Figure 2-7 Road Transport to LLW Disposal Site
Figure 2-9 Burial of RPV in LLW Disposal Trench
The approach to this part of the project was based on the assumption that, if the reactor internals could be inserted into the RPV and the RPV back filled with con-crete, the radioactivity contained in active metal would be calculated over the entire volume of the RPV. The RPV and internals together contained 74.37 E15 Bq of activated metal.
The significant result of the calculation was that the RPV package with internals embedded in concrete was classified as Class C LLW, which met the requirements for burial in a LLW facility. The NRC approved this calculation technique and clas-sification.
2.5.4
Demolition of Buildings and
Site Restoration
2.5.4.1
Estimate
SKI 95:65 referred to the following approaches for building demolition and site restoration:
The use of diamond wire rope saws, hydraulic hammers and explosives for building demolition.
Building structures to be removed to 1 m below ground level. Under-ground structures would not be removed. Holes would be drilled in the re-maining concrete structures to provide drainage paths and subsequently would be filled with concrete rubble from the demolition exercise.
2.5.4.2
Actual Experience
The scope and approach of the actual demolition of buildings and site restoration followed the projected activities. However the work was completed with a cost that was much lower than projected, further details of which are presented in section 2.8. PGE staff attributed the difference between actual and estimated cost to excellent
management of the demolition projects for the cooling tower, the containment build-ing and the power block (i.e. the turbine, control, auxiliary, and fuel buildbuild-ings). The demolition work was performed under fixed-price contracts. Under these con-tracts, any scrap including steel became the property of the contractor and so the potential scrap value could have indirectly influenced the price originally bid by the contractors.
2.5.5
Innovative Activities that benefited
the Trojan D&D experience
The following innovations assisted in a successful decommissioning experience.
A modular spent fuel pool cooling and demineralizer system was installed so that the main cooling systems could be deactivated and removed prior to moving the fuel from the pool.
The piping into and out of the spent fuel pool was isolated and the through-wall penetrations on both the inside and outside of the pool through-walls were capped, thus preventing inadvertent cutting of pool piping that could have resulted in loss of water from the pool.
A simple, temporary HVAC exhaust and supply fan system was installed on the roof of the Auxiliary Building, connecting the exhaust to the original exhaust stack for monitoring exhaust from the top of the Containment Building. This temporary system maintained a negative pressure (licensing requirement) on the radiological controlled areas of the Auxiliary and Fuel buildings and allowed deactivation and removal of the original HVAC equipment and ductwork.
In addition to the RPV, steam generators and pressurizer, other large com-ponents such as reactor coolant pumps and pump motors were removed in-tact. The components were secured (e.g. covered in shrink wrap), shipped and buried without placing the components into purpose-built boxes.
Access openings in the concrete shield walls of the equipment rooms in the Auxiliary Building (some up to 1.2 meters thick) were made to facilitate equipment removal. The access openings were made by drilling a number of adjacent holes that were approximately 10 to 13 cm in diameter through the walls rather than using more sophisticated diamond saw or water jet methods. This proved to be a simple, effective method to create the access openings.
An additional Containment Building opening (using the drilling method de-scribed above) was made at ground level and another new opening in the Auxiliary Building was created, to facilitate better flow of material out of the building complex.
2.6
Manpower Resources and
Costs
2.6.2
Actual Experience
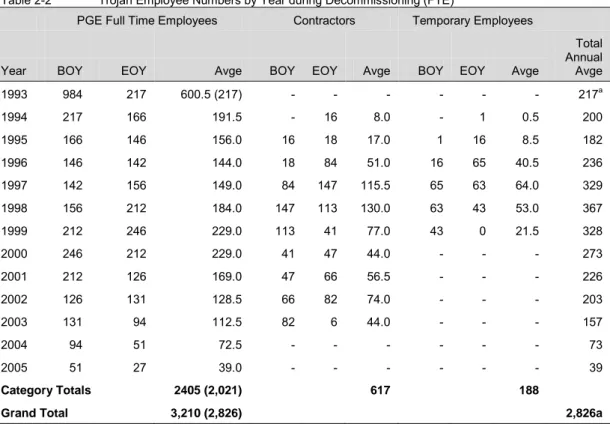
Table 2-2 lists the Trojan full time employees, temporary employees and contractor employees at the beginning (BOY) and end (EOY) of each year listed, all believed to be quoted on a full time equivalent (FTE) basis.
Table 2-2 Trojan Employee Numbers by Year during Decommissioning (FTE)
PGE Full Time Employees Contractors Temporary Employees
Year BOY EOY Avge BOY EOY Avge BOY EOY Avge
Total Annual Avge 1993 984 217 600.5 (217) - - - 217a 1994 217 166 191.5 - 16 8.0 - 1 0.5 200 1995 166 146 156.0 16 18 17.0 1 16 8.5 182 1996 146 142 144.0 18 84 51.0 16 65 40.5 236 1997 142 156 149.0 84 147 115.5 65 63 64.0 329 1998 156 212 184.0 147 113 130.0 63 43 53.0 367 1999 212 246 229.0 113 41 77.0 43 0 21.5 328 2000 246 212 229.0 41 47 44.0 - - - 273 2001 212 126 169.0 47 66 56.5 - - - 226 2002 126 131 128.5 66 82 74.0 - - - 203 2003 131 94 112.5 82 6 44.0 - - - 157 2004 94 51 72.5 - - - 73 2005 51 27 39.0 - - - 39 Category Totals 2405 (2,021) 617 188
Grand Total 3,210 (2,826) 2,826a
Source: Portland General Electric
a. For the purpose of the analyses in this report, the number of PGE employees assumed to be involved with decommissioning during 1993 is assumed to be not more than the num-ber on the payroll at the end of the year. On this basis the grand total of man years through 2005 is 2,826 rather than 3,210.
Based on actual labour costs incurred during Trojan decommissioning and assuming unit labor costs compiled by the U.S. Bureau of Labor Statistics for the Portland Oregon – Vancouver, Washington area for job classifications related to decommis-sioning work, the annual U.S. employment costs including overhead used in this analysis for PGE employees, contractor and temporary workers, escalated to 2011 money values, are as follows:
PGE Employees : $76,100 Contractors : $112,500 Temporary Workers : $94,300
The original D&D estimate and the actual costs are categorised on different bases. For example, the original estimate defined labour resources for Service and Shut down Operations, accounting for over 42 per cent of the estimate. PGE did not use the Service and Shut down Operations definitions. They defined three different peri-ods including:
a transition period that began at the time of permanent plant shutdown in January 1993 and continued until spent fuel was transferred to an ISFSI;
a decontamination and dismantlement period that began at the end of the transition period and ended when the NRC terminated the 10 CFR 50 li-cense; and
a site restoration period that began at the end of the decontamination and dismantlement period and involves the final non-radiological disposition of structures, systems, and components.
However, the actual cost breakdown eventually reported by PGE does not specifical-ly respect these three defined periods, because in reality D&D activities occurred in all three periods. Nevertheless, for the purposes of this report and to facilitate com-parison with Swedish D&D estimates, an allocation of labour resources to a notional Service and Shutdown Operations category has been made.
The PGE employee time was not all allocated to the D&D project. There were times during the transition period i.e. the period between reactor shutdown and final of-floading of spent fuel (achieved around 2003) when some of the staff resource costs were allocated to an operations and maintenance budget rather than the D&D budg-et. For this analysis these labour resources have been added back into the D&D cost under the category of Shutdown and Service Operations.
Based on accurate cost information available for various actual project categories during the Trojan decommissioning exercise, the associated labour resources used have been estimated, as presented in Table 2-3. For reference the original Trojan estimate of man-years needed also is included in Table 2-3.
The most obvious conclusion from these data is that the original Trojan D&D cost estimate, developed by one of the U.S. national laboratories (PNNL), used cost es-timating models that proved to be inadequate. The major shortcoming was the fact that the labour resources needed for system dismantling, including decontamination, were estimated to be approximatley10 times less than the actual cost (212 man years versus 2141 man years). Some other elements of the original estimate turned out to be reasonably close to the actual outcome but nevertheless low. In respect of waste management costs, for example, the ultimate amount disposed was higher than esti-mated (see section 2.7).
Table 2-3 Costs ($M 2011) and Manpower for Decommissioning the Trojan PWR (man years)
Activity Actual Cost
2011 $M Estimated percent Labour Content Trojan Man yrs Implied actual Original Estimated Trojan Man yrs Shutdown & Service
Opera-tions (Estimated) 35.4 100 415 541
Licensing & Planning 8.0 100 94 55
RPV & RPV Internals
Re-moval 28.7 60 182
212 Large component removal
& other decontamination & dismantling 168.7 85 1,683 Post-Dismantling Remedia-tion 14.7 95 164 Final Survey 10.1 95 113 Waste Packaging 9.2 90 97 a) Waste Reduction 10.4 50 61 a) Waste Transport 15.2 10 18 a) Waste Disposal 17.9 0 0 a) D&D Sub-Total 1 318.3 - 2,826 -
Additional Costs Formally Outside the D&D Budget Building Demolition/Site
Restoration 23.9 0 0 60
D&D Sub-Total 2 342.2 - - -
ISFSI Construction and
Procurement Costs 98.9 33 - -
Grand Total Cost 441.1 - - -
a. Original Trojan estimate included a total of $39.6 million equivalent in 2011 money values to cover waste packaging, waste transport and waste disposal, compared with actual costs of $52.6 million including waste reduction.
As stated in section 2.5.3.2, an important variation in D&D approach was the deci-sion to remove and dispose of the RPV intact, rather than employing segmentation in-situ. The cost implications of this are discussed in section 2.7.1.2. The motivation for the change probably was driven mainly by the fact that a disposal facility for GTCC waste is not available in the U.S. Add to this the fact that U.S. Ecology (op-erator of the LLW facility at the Hanford site) provided PGE with undisclosed strong economic incentives to dispose of the pressurizer and steam generators before 31 December 1995. PGE completed the disposal and benefited from the disposal cost savings. Indeed the burial rates at the U.S. Ecology LLW facility fluctuated and PGE took advantage of the periods when the rates were favorable.
The adopted approach for RPV removal intact necessitated the use of heavy lifting equipment and the creation of adequate accesses through the containment building. There is insufficient detail available to determine exactly the implications for labour resources versus the alternative of segmentation. The cost of this part of the D&D project, excluding waste transportation and disposal and escalated to 2011 money values, was as follows:
PGE Supervision : $5 million PGE Labor : $1.7 million Contractor labor, material and equipment : $22 million
On this basis, say if approximately 50 per cent of the contractor costs related to expensive equipment hire and construction (NAC estimate only), the overall labour resources required will have been approximately 182 man years.
The financial impact of the alternative of segmentation is discussed in section 2.7.1.2.
2.7
Waste Management
2.7.1
Volumes and Masses
2.7.1.1
Estimate
SKI 95:65 provided two estimates of the amount of LLW that would result from D&D at Trojan, as follows:
A generic estimate of 6,992 m3 from the report, “Revised Analyses of De-commissioning for the Reference Pressurized Water Reactor Power Sta-tion” (NUREG/CR-5884 and PNL-8742, Vol. 1), dated August 1993.
An estimate of 8,860 m3 from the Trojan Nuclear Plant Decommissioning Plan (PGE-1061), that was submitted to the NRC on January 26, 1995.
2.7.1.2
Actual Experience
A later revision of the Trojan Decommissioning Plan (Revision 9 dated 2001) listed an estimated LLW volume of 9,717.3 m3, excluding disposal of the RPV, the RPV internals, the steam generators and the pressurizer. The actual LLW volume generat-ed after Trojan was shut down, which includgenerat-ed LLW from both decommissioning and operations of systems required in shut down mode, was 12,375.6 m3. Of this total the RPV volume, including RPV internals, was 236.2 m3 and the pressurizer and steam generators together were 1,636.7 m3. The net volume for the balance, 10,503 m3, was slightly higher than the 2011 estimate. One reason for the increase was the disposal of the entire concrete shield walls that surrounded the pressurizer and steam generators.
Trojan did not experience ground water contamination (e.g. with Tritium) as was discovered at a number of other U.S. sites, so soil remediation was not required. In connection with the RPV removal and disposal, the cost savings in waste reduc-tion and transport may be summarised as follows:
SEGMENTATION
Segmentation of the RPV and reactor internals was estimated to generate wastes in three categories, as follows:
374.8 m3 of Class A LLW
127.8 m3 of Class B LLW
RPV REMOVAL INTACT
The actual outcome of RPV and reactor internals buried as one item of Class C LLW corresponded to 925.3 MT and 236.2 m3 disposed of using one barge ship-ment. PGE estimates that by adopting this strategy, overall there was a net saving (D&D operations plus waste transport and disposal) of approximately $20 million in 2011 money values.
2.8
Building Demolition and Site
Restoration
At the time that the 10 CFR 50 license was terminated in May 2005, the cost of site restoration was estimated to be approximately $42 million (2011 money values). The actual site restoration project was completed with a final cost of close to half that amount.
3. Other Benchmark
Refer-ences
3.1
Rancho Seco Dismantling
The approach to disposal of the RPV assumed in the Ringhals 2 D&D cost estimate is based on segmentation. The actual experience of RPV segmentation by Sacramen-to Municipal Utility District (SMUD) at the Rancho Seco PWR therefore is of inter-est.
During November 2005 – June 2006, SMUD segmented the Rancho Seco RPV. The actual cost was $4.7 million in 2006 money values (about $5.2 million in 2011). A breakdown of this total cost and the associated direct labour hours is presented in Table 3-1. The costs exclude:
transportation of the RPV segments to the Envirocare site in Clive, Utah,
disposal of the RPV segments
segmentation and long-term on-site storage of the RPV internals.
Table 3-1 Rancho Seco RPV Segmentation Cost ($2006) and Direct Labour (man hours)
Activity $ Labour hours
Labor – operations and maintenance 760 12
Labor – Plant Services 102,070 1,185
Labor – Engineering 437,320 4,728
Labor – Administrative 8,860 138
SMUD Technology Services – Allocation to the RPV
Segmen-tation Projecta 79,980 130
SMUD Internal Services– Allocation to the RPV Segmentation
Projectb 25,320 330
Material 188,950
Travel & Other 3,570
SA Technologies (segmentation equipment and Rancho Seco
staff training) 3,874,050
Contractor – Radiation Protection 3,050
4,723,930
a. The charges from SMUD Technology Services include such items as personal comput-ers, fax machines, printcomput-ers, plottcomput-ers, pagcomput-ers, cell phones, telephones, and small software support services that could be charged to Rancho Seco projects.
b. The charges from SMUD Internal Services include items such as vehicles and support from various departments including office services, human resources, payroll, etc. that could be charged to Rancho Seco projects.
The RPV was cut into 21 pieces by Rancho Seco staff. The cutting equipment used and the associated training of Rancho Seco was provided by S.A. Technology. A
The segmented RPV pieces were classified as Class A LLW (lowest classification under U.S. LLW regulations). The Energy Solutions Clive LLW facility located in the State of Utah is licensed to accept only Class A waste and so the pieces were transported to that facility.
3.2
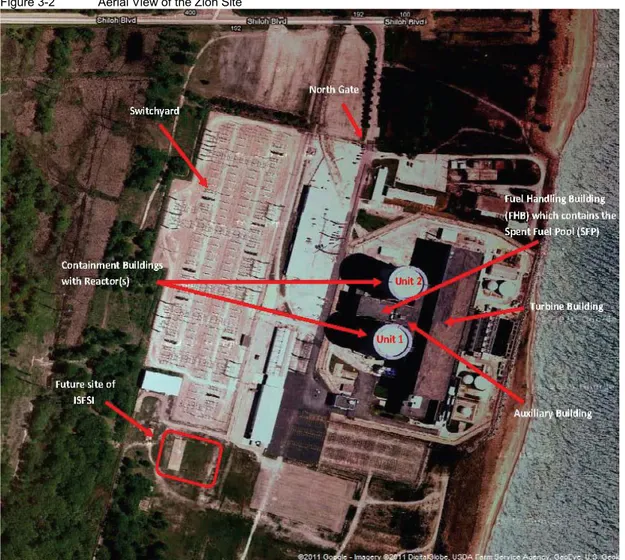
Zion Decommissioning
The shutdown Zion NPP comprises of two 4-looop PWRs that are sister plants to the Trojan reactor. The reactors were closed and held in safe store condition from 1998 to 2010. Decommissioning now is underway. An aerial view of the site prior to decommissioning is shown in Figure 3 2. The responsibilities of the D&D contractor are as follows:
Dismantle or demolish structures & systems
Removal of waste from the Site
Radiological, hazardous, soils, debris and sanitary waste streams
Transportation of all waste generated
Off-Site processing, disposal, recycle
Dry storage of spent nuclear fuel
Environmental remediation of site
Satisfy current and future regulatory requirements
Meet community expectations
Figure 3-2 Aerial View of the Zion Site
Information presented in March 2011 by Zion Solutions, the D&D contractor, pro-jects a final D&D cost of just over $900 million. Nominally this means $450 million for a single unit but there may well be some economies of scale by performing D&D on two units (e.g. avoiding mobilization of workforce and associated infrastructure twice).
Zion Solutions said that about one third of the D&D cost will be for waste manage-ment, including at-reactor processing, packaging, transport and ultimate disposal. This statement about wastes refers to wastes for disposal excluding spent nuclear fuel (SNF) interim storage. If taken literally this would mean a waste management cost of about $150 million and a balance of about $300 million per reactor for the other D&D costs, including provision of an (away from reactor) independent spent fuel storage installation (ISFSI).
The projected overall timescale to complete the two unit project is 10 years. Zion project staffing (actual and projected) includes 2,380 equivalent full time man years. The nominal labour requirement for one reactor therefore is 1,190 full time equiva-lent man years. The peak staff level will be 410 in 2013 when SNF will be trans-ferred to the ISFSI.
Wastes forecast to be generated in the D&D exercise for two units are summarised in Table 3-2.
Table 3-2 Forecast Wastes from Zion Decommissioning
Class A 102,000 m3
Class B and Class C 96 m3
GTCC 20 m3
Contaminated water 9 E6 litres Recyclable waste 76,500 m3
4. Comparison of Ringhals 2
Cost Estimate with U.S.
Benchmarks
4.1
Ringhals 2 Cost Estimate
Status
Based on discussions with Staff at SKB and SSM, there is a general recognition that the earlier cost estimates for the decommissioning of Swedish NPPs in general, and perhaps in all cases, were lower than the likely actual cost. It is understood that up-dated estimates for the Barsebäck NPPs have been completed. It is further under-stood that work is still ongoing to develop updated estimates for other reactors, in-cluding for Ringhals 2 but these will not be completed until sometime in 2013. Cost estimates will be prepared to reflect decommissioning in parallel (multiple reactors at a given site decommissioned at the same time) and sequentially (one reactor at a time).
As an interim measure, potentially to support financial accruals at a higher (more prudent) level than previously indicated to be necessary, a constructed D&D cost for Ringhals 2 has been generated by SKB using the detailed cost estimate for
Barsebäck and then applying a scaling factor based on U.S. NRC formulae that were created to provide regulatory guidance on minimum decommissioning funding re-quirements for reactors of different types and sizes in the U.S. (see section 4.2 and section 0). Some additional small adjustments also have been applied (see section 0).
4.2
U.S. Regulatory Financial
Requirements
NRC regulation 10 CFR 50.75 specifies the minimum amount, in January 1986 dollars, required to demonstrate reasonable assurance of funds for decommissioning nuclear plants as follows:
BWR greater than or equal to 3400 MWth - $135 million
BWR between 1200 MWth and 3,400 MWth - $104 million + 0.009 x (MWth)
BWR less than 1200 MWth - $104 million + 0.009 x (1200)
PWR greater than or equal to 3400 MWth - $105 million
PWR between 1200 MWth and 3400 MWth - $75 million + 0.0088 x (MWth)
PWR less than 1200 MWth - $75 million + 0.0088 x (1200)
The same regulation requires nuclear plant licensees to annually adjust this mini-mum amount to current year dollars. The equation for making the annual adjustment
Estimated D&D Cost (Current Year) = [1986 minimum amount] x [A.Lx + B.Ex + C.Bx]
where A, B, and C are the fractions of the total 1986 dollar costs that are attributa-ble to labor (0.65), energy (0.13), and burial (0.22), respectively.
The factors Lx, Ex, and Bx are defined as follows:
Lx, = labour cost adjustment, January of 1986 to January of Year X (Source: NRC report NUREG-1307(as revised), "Report on Waste Burial Charges." based on regional data from the U.S. Department of Labour – Bureau of Labour Statistics)
Ex, = energy cost adjustment, January of 1986 to January of Year X, (Source: NRC report NUREG-1307(as revised), "Report on Waste Burial Charges." Based on regional data from the U.S. Department of Labour – Bureau of Labour Statistics)
Bx = LLW burial/disposition cost adjustment, January of 1986 to January of Year X (Source: NRC report NUREG-1307(as revised), "Report on Waste Burial Charges.")
The LLW burial/disposition cost adjustment factor (Bx) is a function of the LLW compact associated with nuclear plant sites.
The following example summarizes the annual adjustment calculation to 2010:
Assume a 3,400 MWth PWR located in South Carolina (access to Wash-ington state waste disposal)
Base D&D cost in January 1986$ = $105 million
Lx, = 2.29; Ex, = 2.139 and Bx = 6.81 (Source: NRC report NUREG-1307 Rev. 14, "Report on Waste Burial Charges." – assumes 15 percent direct disposal by utility and 85 percent via waste service vendor)
D&D Costs (2008 $) = ($105 million)
*[(0.65)*(2.29)+(0.13)*(2.139)+(0.22)*(6.81)] = $343 million. The absolute cost values generated by such calculations were not used by SKB. Rather the relative ratios between such values were used to scale from the updated Barsebäck cost estimate.
4.3
Interim Revised Ringhals 2
Cost Estimate
Based on advice provided by SKB, the type of adjustment calculation just described resulted in an interim revised cost estimate for Ringhals 2, as summarised in Table 4-1. This estimate excludes the cost of waste disposal other than waste han-dling costs at the NPP and it also excludes costs associated with the ultimate disposi-tion of spent nuclear fuel, the costs for which are allocated elsewhere. The total estimated cost of MSEK 1,513 excludes an uncertainty allowance estimated at a level of about 22 per cent. Adding this would increase the cost estimate to about MSEK 1,850.
It is understood that this cost value is net after a small downward adjustment to account for the fact that it is assumed that more than one reactor will be decommis-sioned at the same time on the Ringhals site and, accordingly, the personnel re-quirements will be lower than for a stand-alone decommissioning project, due to
sharing/efficiency possibilities. A clear quantification of this downward adjustment is not available.
Table 4-1 Summary Breakdown of Interim Revised Ringhals 2 Decommissioning Cost Estimate
Activity MSEK
Planning and Preparation 84
Service Operation with SNF 122
Service Operation without SNF 13
System Dismantling 1,396
Deduction for RPV Removal Intact -64
Deduction for Leaving some Buildings -37
Net Total 1,513
4.4
Summary of U.S.
Decom-missioning Benchmarks
4.4.1
Trojan and Zion
Cost and other benchmark information for the completed Trojan D&D project and for the Zion NPP D&D project now underway are summarised in Table 4-2.
Table 4-2 Summary of Trojan and Zion D&D Benchmarks
Parameter Zion (2 Units)
(Estimated)
Trojan (Actual)
D&D Cost per reactor ($ millions) ~ 450 441
D&D Cost Excluding Wastes Management ($ millions) ~ 300 389
Total Labour per reactor (man yrs.) 1,190 2,826 gross
Approximate Duration 10 years 12.3 gross (8.9 net)
These data suggest that the main D&D activity (excluding waste management) bene-fits in terms of cost if more than one reactor is decommissioned at the same time ($300M versus $389M for more or less the same reactor – a ratio of 77 per cent). The labour hours expended at Trojan are tricky to interpret because there was a substantial period of delay due to the false start with the first attempt at developing an ISFSI – roughly in the order of 3.4 years in a total duration of 12.3 years. Accord-ingly the labour total of 2,826 man years for Trojan reasonably might be reduced for a more realistic comparison with the Zion experience. By how much is difficult to say. In the years outside the peak labour years (when the ISFSI was being construct-ed and SNF loadconstruct-ed into casks) the typical staff complement was approximately 150. At this level 3.4 years equates to about 500 man years that reasonably might be deducted from the nominal Trojan labour requirement, for a net amount of about
This level of labour at Trojan nevertheless is substantially higher than at Zion. Even after applying an approximate factor of 77 per cent for economy of multiple reactor D&D, the Trojan value still would be about 50 per cent higher than at Zion. In part this could be a reflection of the contracting model for Zion, where a commercial company has taken over full responsibility for the D&D effort and has financial incentives to perform well. Also experience in the D&D field continues to grow and productivity in 2011 may be much higher overall than in the period when Trojan was being decommissioned. The balance between labour intensive activities and activities benefitting from the use of more sophisticated technology (albeit with an associated cost) apparently has changed over time.
4.4.2
Other U.S. References
In a presentation of decommissioning costs by PGE they compared the Trojan cost experience versus five other U.S. PWR D&D projects and one BWR project, and against the cost guidelines of the NRC for required D&D activities. The reactors in this comparison varied from Big Rock Point (BWR) with a thermal power of only 240 MW to Trojan at 3,411 MW. The results are presented in relative cost terms in Figure 4-1.
The variation of actual cost outcome versus reactor thermal power in general ap-pears to be greater than that of the NRC guideline correlation. Accordingly the con-cept of scaling based on NRC guideline formulae reasonably might be questioned. At the same time however it should be noted that there may be factors that would cause the decommissioning cost of some of the reactors to be disproportionately higher. This might relate to generation of design, specific timing of the decommis-sioning program, availability and associated cost of waste disposal facilities and such like. The two trend lines do converge for the later and larger reactors, so the use of NRC derived scaling factors probably is not too bad as a first approximation.
Figure 4-1 U.S. NPP D&D Cost Comparison for PWRs of Different Thermal Power (Rel-ative)
A detailed analysis of these data is outside the formal scope of this report but is included here for completeness as a caveat to the rest of the analyses. Ringhals 2 with a thermal power of 2,650 MW is smaller than Trojan and Zion, so its D&D cost per MW might be expected to be higher relatively, even before accounting for
dif-ferences in local cost factors (especially labour costs). On a cost per MW basis, the data in Figure 4 1 suggest a factor of between 1.55 and 2 times higher for a PWR the size of Ringhals 2 versus Trojan or Zion, which would translate to a ratio for the absolute D&D cost of Ringhals 2 of between 1.2 and 1.55 (e.g. 1.55 x [2,650/3,411] = 1.20).
4.5
Constructed D&D Cost for
Ringhals 2
The Trojan project actual cost includes net labour of at least 2,300 man years at an estimated average cost of about $85,000 per man year, for a total cost of about $195 million (MSEK 1,268). Gross labour was 2,826 man years for a gross cost of about $240 million. Deducting the latter and the waste disposal costs ($33 million) from the total estimated project cost of $441 million leaves a balance of about $168 mil-lion. At Trojan about $98 million was for the ISFSI, leaving a net balance of about $70 million for non-labour D&D activities (MSEK 455). Before any adjustment for Swedish labour rates and without any adjustment for the effect of R2 reactor size, this would mean a basic D&D cost reference about MSEK 1,723.
In Sweden typical general labour and project group costs in the decommissioning sector are believed to be approximately SEK 575 per hour and SEK 1,000 per hour respectively (based on values used in recent Swedish decommissioning cost esti-mates for other facilities). This general labour rate is approximately double the aver-age labour rate used in the analyses for Trojan. If this were applied, implicitly
as-suming that Swedish productivity rates would be the same as in the U.S., it would
imply an extra labour cost of at least $195 million for Ringhals 2 (MSEK 1,268) for an adjusted estimate for R2 of not less than about $390 million labour plus $70 mil-lion estimated non-labour costs for a total equivalent to about MSEK 3,000. If in addition a size related adjustment for R2 is applied, this value increases to between MSEK 3,590 and MSEK 4,640.
Using the lower labour total of 1,190 man years per reactor at Zion (approximately $100 million total cost), the Swedish equivalent would be about MSEK 1,300. This corresponds to multiple reactor D&D activities concurrent at the same NPP site. Applying an allowance of about $100 million for the ISFSI at Zion, the balance of non-labour D&D costs for Zion would be about $100 million. Adding this to the adjusted labour cost for Sweden would give a total of about MSEK 1,950. If in addi-tion a size related adjustment for Ringhals is applied, this value increases to between approximately MSEK 2,350 and MSEK 3,000.
These rough constructed costs may be compared with the interim Ringhals 2 esti-mate based on scaling factors applied by SKB of about MSEK 1,850 (including contingency/uncertainty allowance). The preceding analyses suggest that the interim Ringhals 2 cost estimate might be on the low side, perhaps by a considerable amount. However, the detailed results are very dependent on the assumption of Swedish labour rates and productivity versus U.S. labour rates and productivity. On a preliminary basis, based on published statistics for labour and productivity rates1, the net effect of labour and productivity differentials might be expected to be more like a premium of 50 percent in Sweden compared to the U.S. If this ratio were
ap-imately MSEK 1,950 to MSEK 2,500. The low end of this range is much closer to the interim R2 D&D cost estimate.
2012:68 The Swedish Radiation Safety Authority has a comprehensive responsibility to ensure that society is safe from the effects of radiation. The Authority works to achieve radiation safety in a number of areas: nuclear power, medical care as well as commercial products and services. The Authority also works to achieve protection from natural radiation and to increase the level of radiation safety internationally.
The Swedish Radiation Safety Authority works proactively and preventively to protect people and the environment from the harmful effects of radiation, now and in the future. The Authority issues regulations and supervises compliance, while also supporting research, providing training and information, and issuing advice. Often, activities involving radiation require licences issued by the Authority. The Swedish Radiation Safety Authority maintains emergency preparedness around the clock with the aim of limiting the aftermath of radiation accidents and the unintentional spreading of radioactive substances. The Authority participates in international co-operation in order to promote radiation safety and finances projects aiming to raise the level of radiation safety in certain Eastern European countries.
The Authority reports to the Ministry of the Environment and has around 270 employees with competencies in the fields of engineering, natural and behavioural sciences, law, economics and communications. We have received quality, environmental and working environment certification.