SKI Report 96:51
Research
The Flooding Incident at the Ågesta
Pressurized Heavy Water Nuclear
Power Plant
C. Dahlgren
March 1996
SKI Report 96:51
The Flooding Incident
at the Agesta Pressurized
Heavy Water Nuclear Power Plant
c.
Dahlgren
Division of Nuclear Power Safety, Royal Institute of Technology,
100 44 Stockholm, Sweden
March 1996
SKI Order Number 94330
This report concerns a study which has been conducted for the Swedish Nuclear Power Inspectorate (SKI). The conclusions and viewpoints presented in the report
SAMMANFATTNING
Den här rapporten är ett examensarbete i Reaktorteknologi utfört på institutionen för kärnkraftsäkerhet, KTH, Stockholm, för SKis räkning. Den är en oberoende utredning . utav konsekvenserna av incidenten den la Maj 1969, då stora delar av Ågesta
kraftvärme-verk översvämmades av vatten. Händelsen aktualiserades efter en artikel i Dagens Ny-heter den 23 April 1993, vilken beskrev incidenten och spekulerade i dess konsekvenser. I denna rapport är utgångspunkten den händelsen, dåen kortslutning inträffade på grund av översvämningen, och ledde till attnöd kylningssystemet (härdsprinklings-systemet) momentant utsattes för ett tryck större än dimensionstrycket. Det hypotetiska scenariot som kommer att analyseras är att ett tungvatten-läckage uppstår i nödkylningssystemet vilket medför att trycket och vattennivån i reaktortanken sjunker.
Rapporten är indelad i tre delar. Den första delen innehåller en genomgång av Ågesta kraftvärmeverk, där de olika systemens funktion och dimensioner beskrivs, en genomgång av incidenten den l:a Maj 1969 samt utvecklandet av ett hypotetiskt scenario. Det senare förutsätter att ett brott i härdsprinklings-systemet verkligen skulle ha inträffat som en följd av tryckökningen.
Den andra delen innehåller en analys av förloppet efter brottet i det hypotetiska sce-nariot. Den innefattar en enkel modell av tryck- och nivåsänkningen i reaktorn efter brottet och en noggrann genomgång av flödesgeometrin för läckaget. Dessutom utföres en analys av avkokning av vattnet i primärkretsen, uppvärmningen av bränslet och förstörelsen av härden på grund av otillfredställande kylning av härden i kombination med zirkoniumoxidation. En genomgång av de system som kunde ha använts för att fylla primärsidan med vatten utföres.
Resultatet av förloppet efter brottet blev att nivå- och trycksänkningen hade ett mycket starkt beroende av läckagets volymetriska ång-andel. Denna parameter är myc-ket svår att beräkna och har i den enkla modellen som utarbetats antagits variera på olika vis. Dessutom har restriktioner vad gäller kritiskt utflöde inte tillämpats på denna modell. Analysen av uppvärmningen och avkokningen i reaktorn gav resultatet att den relativa vattennivån i reaktorn måste sjunka ned till 0.1 (där 1.0 representerar toppen
av härden, 0.0 härdbotten) innan en anmärkningsvärd temperaturökning sker i övre delen av härden. Avkokningen är en långsam process som kan ta flera dygn, vilket leder till slutsatsen att zirkoniumoxidation troligtvis aldrig kommer att inträffa, förutsatt att verket hade byggts om så att lätt vatten kan bringas in i reaktortanken.
För att få en mer pålitlig beräkning av initialskedet av förloppet efter brottet på härdsprinklings-systemet utvecklades en komplett modell av Ågesta kraftvärmeverk för koden RELAP5/MOD3.1. Denna modellering utgör den tredje delen i denna rapport.
Transientberäkningarna med RELAP5/MOD3.1 delades upp i ett basfall och flera alternativa transienter. Massflödet i basfallet befanns vara begränsat av kritiskt tvåfas flöde i ca 1 timme (4000 s) efter brottet. Dessutom befanns de dynamiska effekterna, såsom ångbildning i ånggeneratorn, vara av stor betydelse för tryckminskningen och massflödet ut ur reaktortanken.
Efter det att flödet ut ur reaktorn inte längre begränsas av kritiskt flöde och bara består av ånga, kan modellen som utarbetades i den andra delen av rapporten användas för att uppskatta den fortsatta tryckminskningen och massflödet ut ur reaktorn. Termo-dynamisk jämvikt mellan inneslutning och reaktortank sker enligt denna beräkning efter 4.5 timme (16,000 s). Då har den relativa vattennivån i reaktortanken sjunkit till 0.73. Nivåsänkningen till 0.1 tar ytterligare 4 - 5 dagar, beroende på resteffektsnivån.
ABSTRACT
This report is a Master's thesis in Nuclear Reactor Engineering to be submitted to the SKi (Swedish Nuclear Power Inspectorate). The work has been performed at the
Divi-sion of Nuclear Power Safety, KTH,Stockholm. It is an independent investigation of
the consequences of the flooding incident at the Agesta HPWR, in Stockholm, Sweden, which occurred on the 1st of May 1969. The issue was raised by an article in 'Dagens Nyheter' on April 23, 1993,which described the incident and speculated about its possible consequences.
The basis for this report is an incident, in which, due to short circuits in the wiring because of the flooding water, the EeeS is momentarily subjected to a pressure much higher than it was designed for. The hypothetical scenario that will be analyzed in this report is the case in which the EeeS subsequently breaks due to the high pressure. As a consequence of the break, the pressure and the water level in the reactor vessel decrease. The report has been subdivided into three parts. The first part describes the function and dimensions of the different operating systems in the Agesta HPWR, as well as a chronology of the incident. A hypothetical analysis, based on the event of a break in the EeeS due to the pressure increase, is developed.
The second part of this investigation is a scoping analysis of the incident,
whichin-cludes an energy equilibrium model of the pressurized vessel. It models the pressure
decrease and the mass flow rate out of the break. A model of the boil-off in the reactor was also included. The heat-up of the core, and the core degradation was modeled as well. The systems that could have been used to bring water into the primary system during the transients were examined.
The results indicate that the progression of pressure and level decrease after the break is strongly dependent on the volumetric void fraction assumed for the leakage. This parameter is very difficult to calculate, and in the simple thermohydraulic model used in this analysis, no such calculation is performed. The volumetric void fraction of the mass flow of the break is assumed to vary in different ways. Furthermore, other limitations on the mass flow rate in the break flow geometry, such as critical flow, are
not taken into account in the model. The analysis of the heat-up of the fuel and the boil off of the water in the reactor vessel led to the conclusion that a fractional water level of 0.1 (where 1.0 is the top of the core and 0.0 the bottom) has to be reached until significant temperature rise at the top of the core occurs. The boil-off has been found to be a very slow process, which takes several days. The conclusion of the analyses is that zirconium oxidation would never occur, provided that plant arrangements had been made to connect the system for emptying and filling the primary side of its water to an external light water source.
In trying to establish a more accurate picture of the events immediately after the break of the ECCS, a complete model of Agesta HPWR was made for the RELAP5/MOD3.1 computer code. Of particular interest is the amount of water that is going out from the primary circuit. This model development and the calculations made with the model form the third part in this report.
The RELAP5/MOD3.1 calculations of the transient were divided into the base case and several alternative transients. The mass flow rate was found to be restricted by two-phase critical flow up to about 1 hour (4000 seconds) after the break. Dynamic effects, such as steam formation in the primary side piping of the steam generator, also had a large impact on the pressure decrease and the mass flow rate of the break.
When the mass flow rate in the break flow geometry is no longer restricted by the critical flow, and consists entirely of steam, the model in the second part of the report can be used to describe the- remaining part of the transient. Equilibrium between the containment and the reactor vessel is assumed to occur about 4.5 hours (16,000 seconds) after the break. The fractional water level in the core at that point is 0.73. The level decrease down to the point of significant temperature rise in the top of the core takes
Contents
1 INTRODUCTION 1
2 PLANT DESCRIPTION 5
2.1 Location of the Agesta PHWR . 5
2.2 Containment
. . .
52.3 Reactor Core and Vessel 6
2.4 Primary System . . . 7
2.4.1 Main Coolant Circuit. 7
2.4.2 Pressurizer. . . 8
2.4.3 Steam Generators . 8
2.4.4 Main Coolant Circulation Pumps 9
2.5 Secondary System. 9
2.6 Recooling System . 10
2.7 District Heating System 10
2.8 Emergency Core and Containment Cooling System 11
2.8.1 Emergency Core Cooling System . . . . . 11
2.8.2 Emergency Containment Cooling System. . . . . 12
3 THE FLOODING INCIDENT AT THE AGESTA NUCLEAR POWER
PLANT 20
3.1 Review of the Flooding Incident. 20
3.2 Chronology of the Flooding Incident 21
3.3 Hypothetical Scenario . . . 23
3.3.1 Nuclear Safety Aspects. 23
3.3.2 . Break . . . . . 24
. 3.3.3 Break Location 24
4 SCOPING ANALYSIS 26
4.1 Introduction . . . . . ... 26
4.2 Reactor System Thermodynamics 26
4.3 Break Flow ... 28 4.4 Outflow Geometry 29 ~:: .' 4,,' 4.5 Boil-off Level 31 4.6 Core Heatup . 32 , , 4.7 Core Degradation 34 4.7.1 Heat Balance 34 4.7.2 Transient Phase . 35
4.8 Alternative Systems That Could Possibly Have Been Used for Cooling the
Core . . . 37
." . / 4.9.1 TEENAGE 39 4.9.2 Boil-off Level 40 4.9.3 Core Heatup : 40 4.9.4 Core degradation 40 4.10 Discussion . . . 41
5 DYNAMICAL TWO-PHASE FLOW ANALYSIS 48
48
48
49 51 51 52 53 53 54 55 55 5.1 5.2 5.3 5.4 5.5 . Code Description Input Description 5.2.1 Hydrodynamic Model.5.2.2 Heavy Water Properties
5.2.3 Heat Structures
5.2.4 Trip Logic . . .
Steady State Analysis. Transient Analysis
Base Case
...
5.5.1 Coolant Flashing
5.5.2 Natural,Circulation.
5.5.3 Steam Void Formation in Steam Generator Prima.ry Piping. 55
5.5.4 Critical Flow 56
5.5.5 Core Heatup. 56
5,5.6 Extension of RELAP5 56
5.6 Comparisons Between Base Case Transient and Some Variations 57
5.6.1 Accident Management
...
575.6.2 Change Of Break Location. 57
5.6.3 5" Break . . . 58
5.6.4 Junction 319 58
5.6.5 Reactor Coolant Pump Not Tripped 58
5.7 Discussion ... 59
List of Figures
1.1 Plant Layout
...
31.2 Overall Flow Diagram 4
2.1 . Modified Hexagonal Fuel Pattern 14
2.2 Pressurized Reactor Vessel . . . . 15
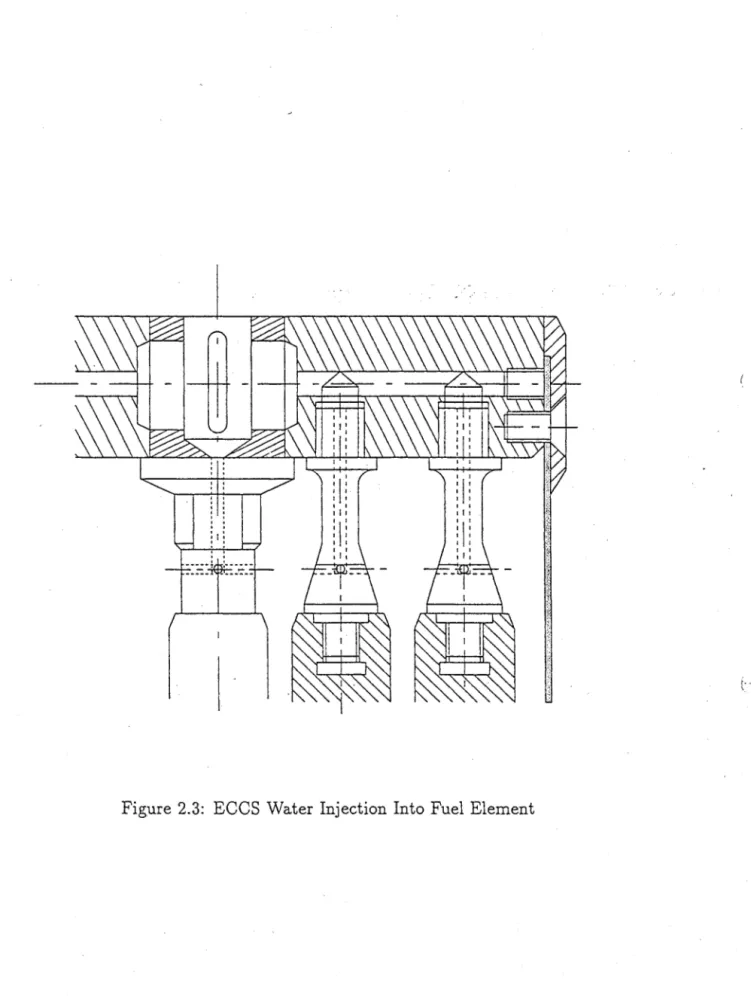
2.3 ECCS Water Injection Into Fuel Element . 16
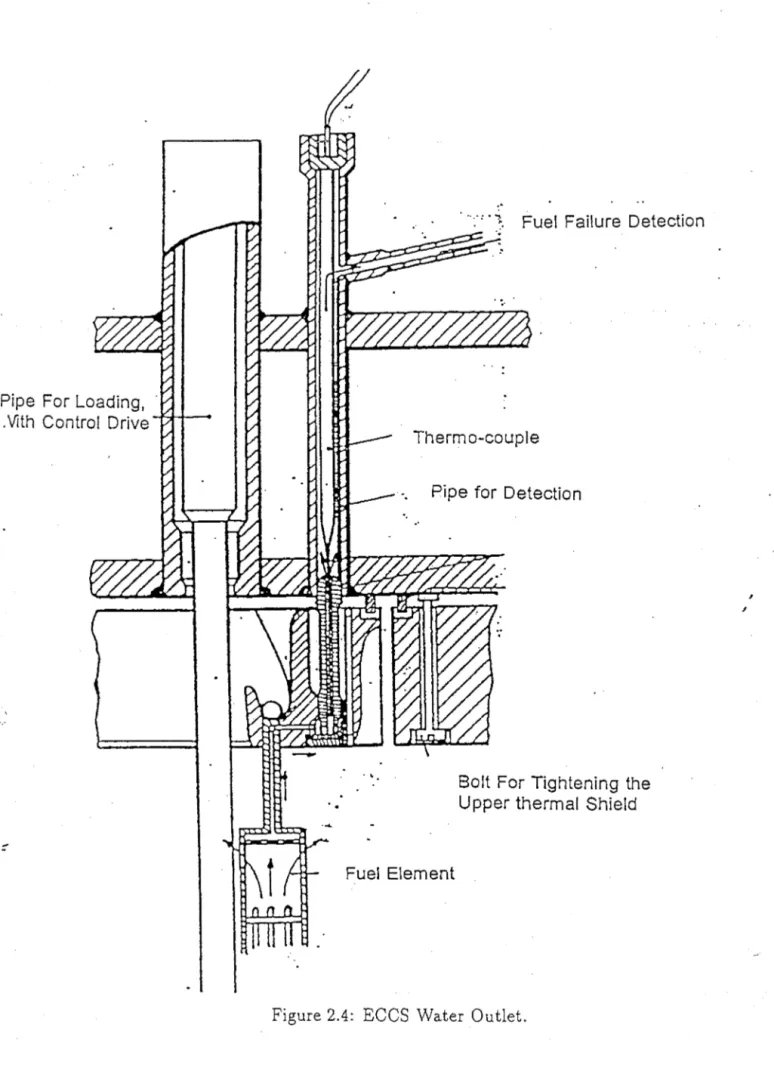
2.4 ECCS Water Outlet. 17
2.5 Steam Generator
..
182.6 Emergency Core Coolant System Flow Chart . 19
,,,j
4.1 Leaking Reactor Vessel . . . 27
4.2 The Water Volumes of the Primary System. 43
4.3 Break Flow Geometry (Corresponding To Table 4.1) . 44
4.4 TEEN AGE: Levels During the Blowdown. 46
4.5 TEENAGE: Pressures when Level = 0.5 46
4.6 TEENAGE: Massfiow of Blowdown .. 46
4.7 Boil-off: Collapsed level.
...
46...
4.8 4.9
Heatup: Temperatures in top of core. . . . Temperature rise due to zirconium oxidation .. 4.10 H2 - production due to zirconium oxidation.
5.1 Nodalization of Agesta for RELAP5/MOD3.
5.2 RELAP5: Pressure during the blowdown .. 5.3 RELAP5: Mass flow rate of the blowdown. 5.4 RELAP5: Velocities in the break flow geometry. 5.5 RELAP5: Void fraction in break flow geometry. 5.6 RELAP 5: Pressure in break flow geometry. . . .
. . . .
.. '. 47 47 47. 61 63 63 63 63 645.7 RELAP5: Primary and Secondary Steam Generator Temperatures. 64
RELAP5: Cladding Temperatures . . . . Cladding temperature when water is added.
5.10 RELAP5: Comparison of pressure with different break locations .. 5.11 RELAP5: Mass flow rates with different break locations.
5.12 RELAP5: Pressure of 5" break and base case . . . . 5.13 RELAP5: Mass flow rates of 5" break and base case. 5.14 RELAP5: Mass flow rates with and without junction 319 5.15 RELAP5: Pressures with and without junction 319 5.16 Extension of RELAP5: Pressures . . . . 5.17 Extension of RELAP 5: Break mass flow rates
64 64 65 65 65 65 66 66 66 66
6.1 Collapsed level in Agesta before boil-off. . . . 68
6.2 Boil-off: Collapsed level. . . .. 68
List of Tables
4.1
Features of the different sections in the break flow path ..30
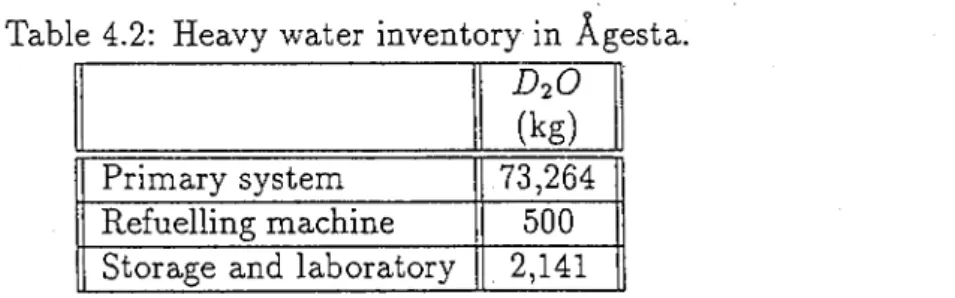
4.2
Heavy water inventory in Agesta.38
4.3
TEENAGE Results.. . .
4'5
4.4
The materials in the core of Agesta ..45
4.5
The Oxidation Fraction for the Zircaloy in the Core.45
5.1
Heavy and Light Water Properties.....
60
5.2
Primary system condition in steady state.60
Nomenclature
Arabic: A C Cv D EH
Area [m2] Constant [-]Volumetric heat capacity
[J
/K]
Diameter [m] Internal energy
[J]
Enthalpy[J]
Loss factor [-] K Level NuFractional water level in reactor vessel [-] Nusselt number [-] P . Pr
Q
Power [W] Prandtl number [-] Heat[J]
Reynold number [-] Temperature[K]
Volume [m3] Re T V W XWork done by the system
[J],
Formation of hydrogen per area [kg/m2]Oxidation fraction [-]
Cv Specific volumetric heat capacity
[J
/kgK]e Specific internal energy
[J
/kg]f
Friction factor [-]~ Iteration step
h Specific enthalpy
[J
/kg]he Heat transfer coefficient [W /m2K]
h J Latent heat of fusion
[J
/kg]k Thermal conductivity [W /mK]
l Length [m]
m Mass [kg]
'. ~.
m Mass flow rate [kg/s]
n Time step
t Time [s]
u Specific internal energy
[J
/kg]v Velocity [m/s], Specific volume [m3/kg]
x Mass fraction of steam [-]
Greek symbols:
~ Difference
a Volumetric steam fraction [-]
p Density [kg/m3]
1/ Viscosity [m2/s]
Subscripts:
H2 Hydrogen properties
STARV Starvation constant
U02 Uranium oxide properties
Zr Zirconium properties
Zr02 Zirconium oxide properties
bo Boil-off
break Break properties
core Core properties
d Decay
h Hydraulic
t Beginning of iteration step i
i+l End of iteration step i
leak Leakage properties
n Beginning of time step n
n+l End of time step n
0 Initial properties
re} Reference properties
stm ' Steam properties
ACKNOWLEDGEMENTS
This report is to be submitted to the SKi and was made at the Division of Nuclear Safety at KTH, Stockholm, Sweden. The purpose is to evaluate the potential consequences of the flooding incident at the A.gesta PHWR on the first of May 1969.
Attention to this subject was drawn by an article in DN in April 1993 [11], which de-scribedthis incident and the potential consequences that it could have caused. SKi asked the Division of Nuclear Power Safety at KTH, Stockholm, to conduct an examination of this incident.
I want to thank the staff at the Division of Nuclear Power Safety, and especially Mr.
T. Okkonen, whose resources in terms of patience and knowledge have been of decisive
importance for this report. Also, I want to thank Pro£. B. R. Sehgal for providing me
with a project that gave me a wide range of experience, from practical engineering work to theoretical analysis.
I also want to thank Mr. S-O. Andersson and
A.
Bergman for their helpfuless andpatience when helping me find information in the archives of Vattenfall.
Chapter 1
INTRODUCTION'
The Swedish nuclear program began in the late 1940's. The Agesta Heavy Pressurized
Water reactor was the starting point for water reactors designed and built in Sweden. It
gave essential construction experience and was used as a training facility for operational staff for other Swedish nuclear power plants. The Agesta nuclear power plant was a
pressurized heavy water power reactor (P HWR ) located in Farsta, approximately 17 km
south of Stockholm.
The Agesta nuclear power plant was one of the first nuclear district heating plant in the
world. It was planned and constructed between the years 1956-1964 and it first became
critical on the 17th of July 1963. It was then successfully in use for ten years, producing
electricity (10 MW) and distributing district heating (55 MW) to the inhabitants of Farsta. In the beginning of 1970, an upgrade of the core power to 80 MW was made. Except for the removal of the fuel and one of the four steam generators, the plant is still in place and is being visited by student groups and others.
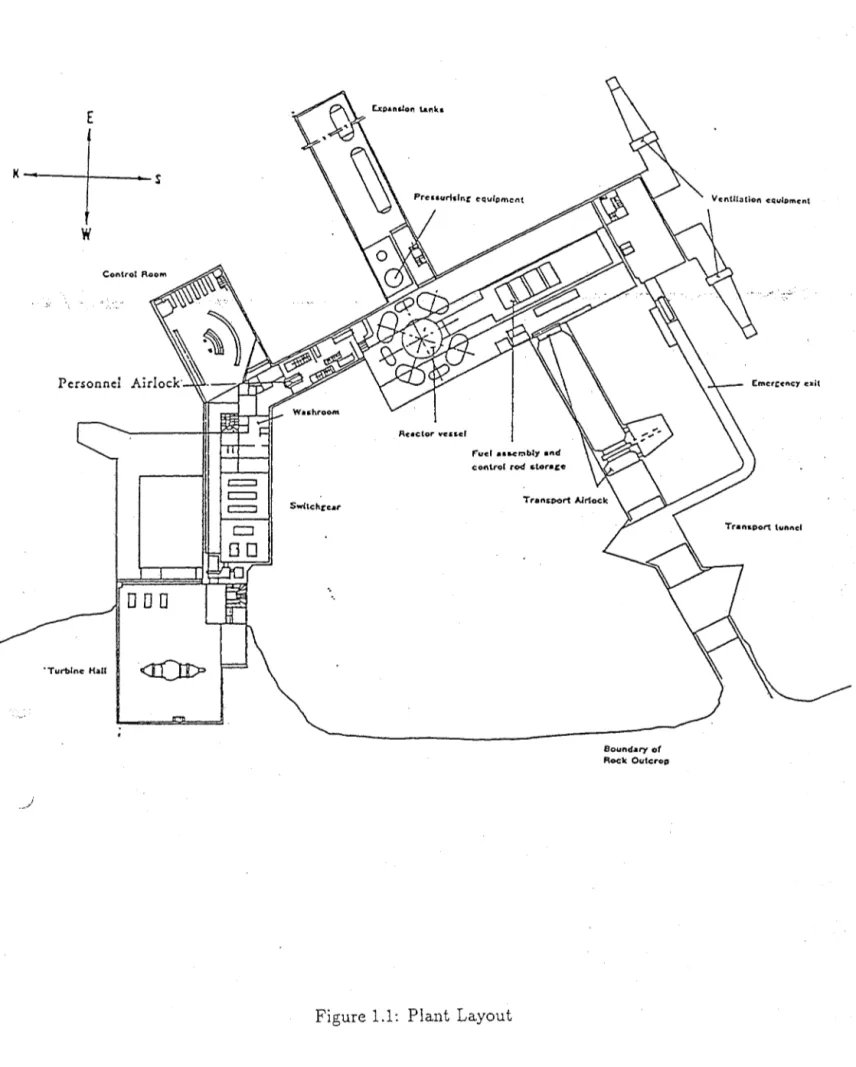
The Agesta reactor was a unique design that is hardly used anymore; the only plant with a similar design concept can be found in Argentina. The concept was that of a large pressurized vessel using heavy water both as coolant and as moderator. The reactor and
the primary system were situated within a rock cavity,see Figure 1.1. Agesta was fueled
with natural uranium dioxide (U02 ). The fuel was cooled by heavy water, which was
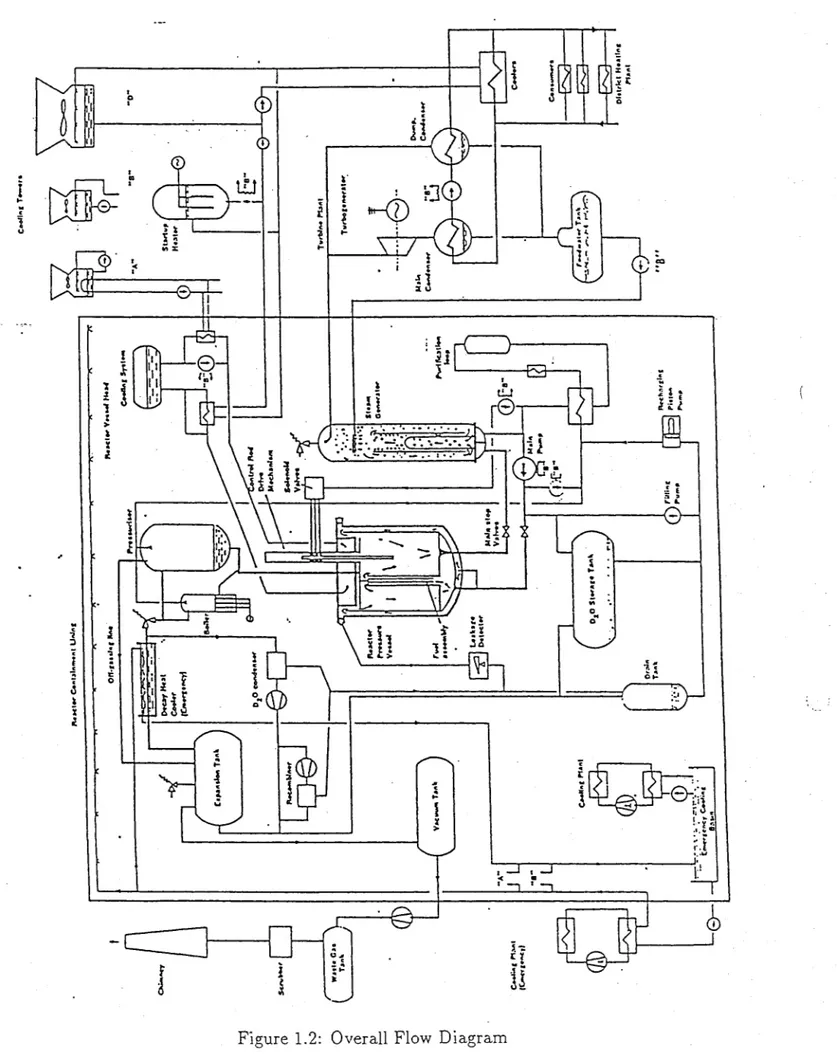
circulated through the core (heat-up) and the steam generators (cool-down). The heat transferred to the secondary circuit containing light water could be used either directly for district heating or for generation of electricity in the steam turbine [2].
The incident described in this report occurred on the 1st of May 1969; it was a typical
flooding scenario. It was also an example of the objective reality that an incident in one
part of a plant might have severe, unexpected consequences in other parts of the plant.
Attention to this subject was drawn by an article in 'Dagens Nyheter' in April 1993 [11], which described this incident and the potential consequences it could have caused. SKi asked the Division of Nuclear Power Safety at KTH, Stockholm, to conduct an examination of this incident.
The report has been divided into three parts as described below;
• Technical survey of the plant, and an overview of the incident (Chapter 2 and 3). The different parts (and their function and properties) of the plant were described. A chronology of the incident was made, and a hypothetical scenario was considered.
• Scoping analysis of the hypothetical scenario (Chapter 4). A simple
thermody-namic model of the leakage was developed, and the outflow geometry was defined. Alternative cooling systems were examined.
• Dynamical two phase flow analysis (Chapter 5). A RELAP5/MOD3 model of Agesta was developed,and a steady state run was performed. Different transient were run.
It has to be stressed that the hypothetical scenario analyzed in this report never
E
K - - - + - -__ S
w
Control Room .1 •..•• " ." Personnei000
'Turbine Hall Swltchcurf"ue( a&SoCl':\bty and
control rod ,,{orace
Figure 1.1: Plant Layout
Bound.ary of Roc:k Outcrop
VcntU:ltion eQuipment
,:~ ... >.
I
..
wi
u w ~ :J~
5
~ i c I; I o I 111 - - - ' - - - 1 III '% i 1 : >,
i c 1 w1
z': 0 ;,1'H
i
' - - - - + " v I - - . . . , I ~Figure 1.2: Overall Flow Diagram
~ E "
.
Chapter 2
PLANT DESCRIPTION
2.1
'Location of the Agesta PHWR
The Agesta pressurized heavy water reactor is located in Agesta, 3.5 km south of Farsta, which is a suburb 17 km south of Stockholm. The reactor and the primary system (main
pumps and steam generators) are located inside a man-made cavern in a rock cavity. It
was placed there for two reasons, namely for protection of the surrounding environment from possible radioactive release in case of an accident and for protection of the plant from possible external attacks [2]. The turbine hall, the cooling towers, the laboratory building, the purification system and the administration building were situated on open ground.
Within a radius of one kilometer from the rock cavern, no buildings were allowed, other than those vital for plant operation. Within a radius of two kilometers from the plant, however, a small population was allowed. In 1964, the population was estimated to be 220 [1, page 7].
2.2
Containment
Most of the equipment of the primary system was situated inside the containment. Inside the rock cavern but outside the containment were the control room, the heavy water support system, the distribution plant and the battery backup [1, page 10].
The containment pressure boundary consisted of 4 mm thick steel walls and roof
as well as a 8 mm thick steel floor. It was almost completely surrounded by rock and
i
concrete. Where concrete or rock did not exist, 22 mm thick steel was used. The total
volume of the air-tight containment compartment was 29.000 m3 . In order to operate the
plant, the containment was penetrated with access holes, system penetrations (piping, electrical wiring and ventilation) and a large (4 x 4 x 24 m) air-lock. All the penetrations were designed to withstand a pressure of 4 bar [1, page 11]. In case of a large LOCA (Loss Of Coolant Accident), the pressure inside the containment was estimated to rise to 2.5 bar [3]. When the pre-operational testing was performed, the relative integral leakage
was measured as 1.55 x 1O-4/h (or 0.372%/day) for a pres~ure of 2.5 bar [1, page 14J.
2.3
Reactor Core and Vessel
The reactor core was situated inside the reactor vessel. The core contained fuel of natural
uranium dioxide (U02 ), and the moderator/coolant that was heavy water (D20). The
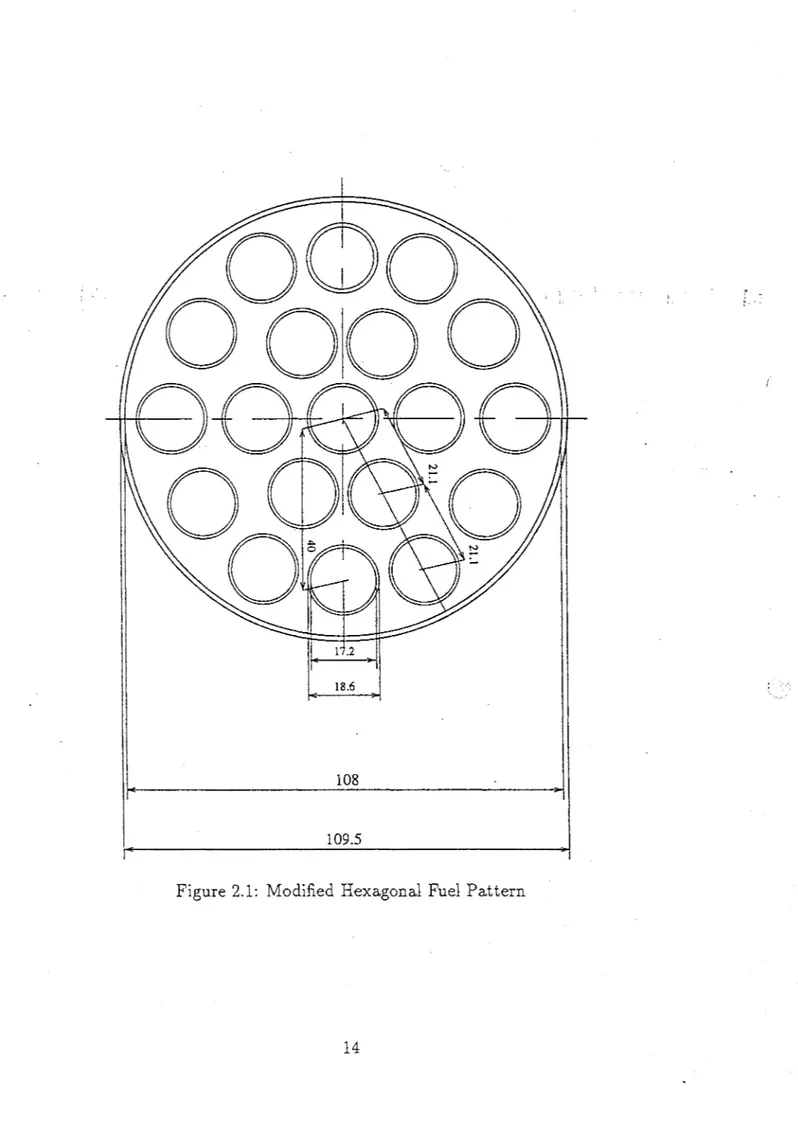
core consisted of up to 140 fuel elements, each containing 19 fuel rods. The fuel rods were placed in a modified hexagonal pattern; see Figure 2.1. Each fuel rod consisted of four
parts, each part being a tube of Zircaloy (Zr-2) that contained 32 pellets of U02 and was
filled with helium gas. Each fuel rod was approximately 18 mm in outer diameter and 3074 mm in length. The fuel element had a total length of 3750 mm and a diameter of 110 mm [1, page 20].
The design power of the core was 65 MW, of which 60 MW were deposited in the fuel and 5 MW in the moderator [1, page 19]. The height of the core was 3.04 m and the. effective diameter was 3.61 m. The mean linear heat rating was relatively low, i.e. 78.5 W /cm. The coolant (moderator) to fuel volumetric ratio was 16.4 [1, page 20]. The core
co~ld be characterized as a self-stabilizing core (negative void-reactivity coefficient). The central rod, and the spacer that held the fuel rods in place, had channels from which the detection system for fuel failures took its bleed-water. The ECCS water was also injected here; see Figure 2.3 [1, page 22]. At the top and the bottom of the fuel elements, there existed openings (junctions) to the moderator, in the form of penetrations in the fuel assembly wall, to provide more efficient natural circulation.
To control and shut down the nuclear reaction, 29 control elements with neutron ab-sorption by an alloy of 80% silver, 15% indium and 5% cadmium were placed throughout the core. The control elements were all canned in stainless steel. Two of them were controlled with fine rod drives, whereas the 27 remaining had coarse rod drives [2].
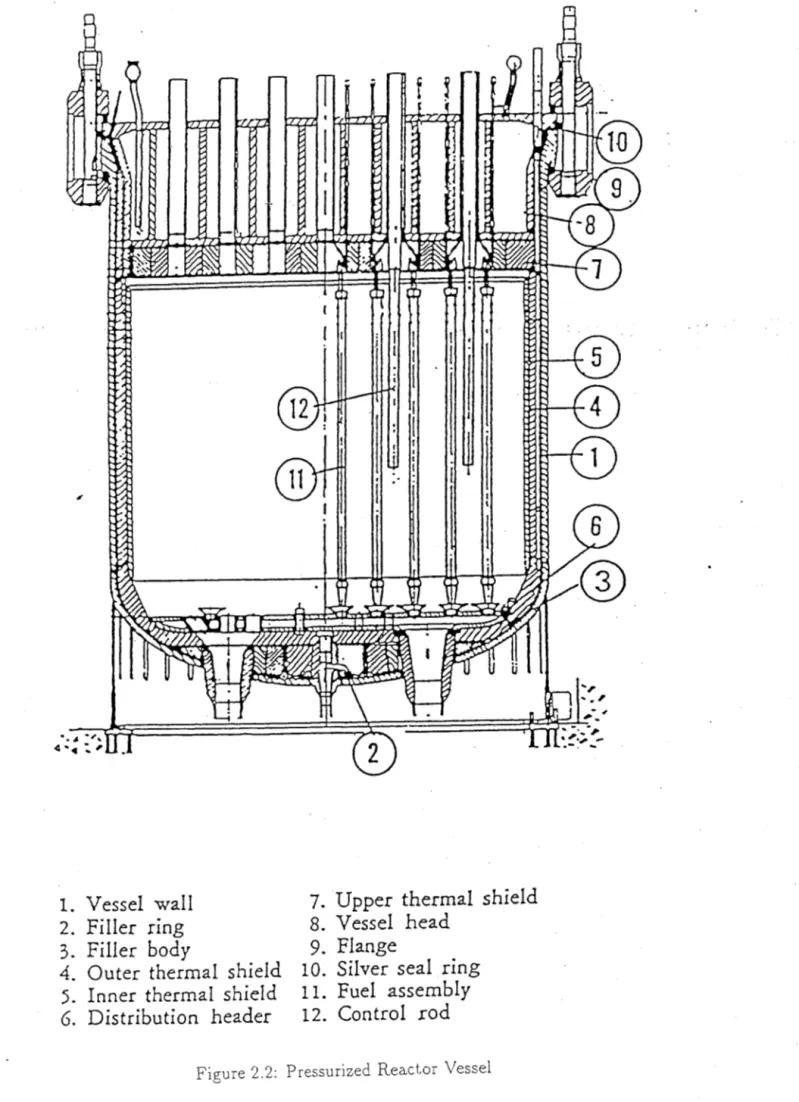
The reactor pressure vessel was a cylinder made of 65 mm thick steel with a ellipsoidal
bottom head and a flat lid; see Figure 2.2. It had an outer diameter of 4890 mm. The
total volume of the vessel was 50 m3 . The temperature of the lid was kept equal to that
approximately 7 m. The vessel had an internal stainless steel liner that was 5 mm thick. The lid was connected to the vessel by 48 bolts. The tightness of the lid was ensured by a ring of silver, which was plastically deformed when the lid was connected to the tank, and a toroidal seal. The total weight of the vessel, without piping and insulation, was 296.6 tons [1, page 34].
Thermal shields were used to protect the steel in the vessel from embrittlement due to neutron bombardment. The upper thermal shield consisted of thick square slabs of stainless steel. The radial shield consisted of two concentric cylinders and the bottom . thermal shield of the water flow distributor [1, page 34].
The lid was penetrated by many holes of different sizes, among others 37 loading holes (for control rods and refueling) and 140 pipes for fuel failure detection (and the ECCS
injection) [1, page 34]. It was cooled by light water, to keep the temperature equal to
that of the vessel. The maximum temperature difference between the vessel and the lid was 10°C [1, page 31].
2.4
Primary System
2.4.1
Main Coolant Circuit
The primary system was a closed circuit containing pressurized heavy water. The heavy water transferred heat from the fuel elements to four steam generators, where primary heat was transferred to the secondary system. The water flow was circulated by four main circulation pumps, one in each loop, located downstream of the steam generator.
Water flows in the vessel through two parallel routes [1, page 34];
• The fuel cooling flow took care of the cooling of the fuel elements. From four inlets in the bottom of the vessel, heavy water was brought into the core and distributed to the 140 fuel elements. The heavy water flowed upwards through the elements and then downwards through the moderator volume. The heavy water left the vessel through the four outlets, also located at the bottom of the vessel.
• The annulus flow went through the annulus between the vessel and the outer ther-mal shield. The annulus flow then joined the moderator flow. The purpose of the annulus flow was to cool the thermal shields and to cool the vessel itself. The flow kept the temperature of the vessel walls of the vessel equal to that of the fuel inlet cooling flow.
The heat released from the fuel in the pressurized vessel was 65 MW. It was trans-ported by a heavy water flow. of 1020 kg/so The temperature of the heavy water was increased by 15°C, from 205°C to 220°C, during its passage through the vessel [1, page 49]. Under normal conditions, it took approximately 50 s for the water to enter and leave the vessel.
The nuclear process was coupled with the heatup of the coolant/moderator, therefore the moderator could automatically control the nuclear process (if more nuclear fissions take place, the moderator temperature increases and the fast neutrons are not slowed down as efficieptly as before so that fewer thermal fissions take place). Because of the
large volume of the moderator (VD20/VU02 = 16.4), the system was self· regulating and
stable. While the inlet temperature could be altered to change the power level (the lower the inlet temperature the higher the power), the outlet temperature was kept constant [1, page 48].
2.4.2
Pressurizer
The heavy water had a high pressure, 34 bar, to prevent boiling [1, page 48]. To control
the pressure in the reactor vessel, it was connected to a pressurizer 20 m3 in volume.
The bottom of the pressurizer was located about 5 m above the top of the reactor vessel. The pressurizer was connected to the vessel top by four 225 mm pipes. During normal operation at an outlet temperature of 220°C (which is equal to a sub cooling of 20°, at the operation pressure of 34 bar) steam was generated in the electrical boiler. The heavy
water volume in the pressurizer vessel was 1 m3 . The pressurizer also contained some
D2
and N2 gases. The pressurizer served both for pressure control and relief. The design
pressure in the system was 40.2 bar. Pipes from the pressurizer went to the expansion tanks, which were also designed to handle the heavy water steam that would be produced in the event of a LOCA and afterwards. During normal operation the expansion tanks were used to collect the leakage of heavy water [2].
2.4.3
Steam Generators
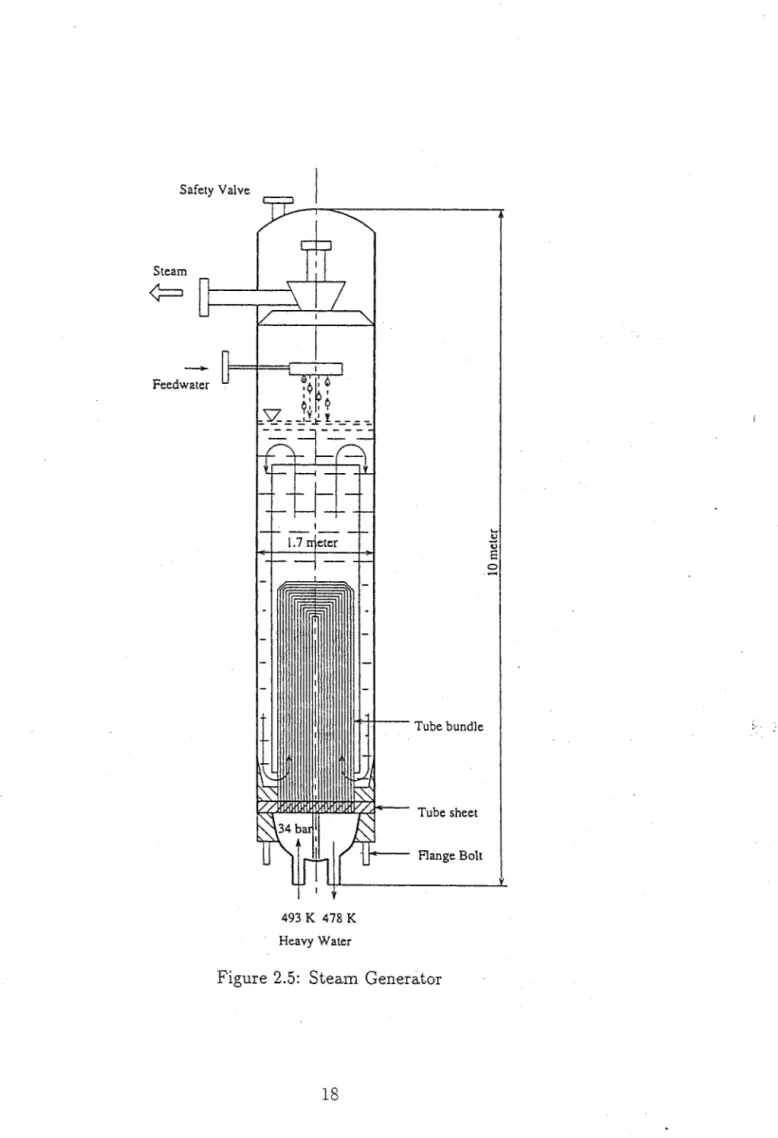
The four steam generators were of the 'inverted tube in shell' type [2]. They were mounted vertically, with the heavy water inside the tubes and the light water on the shell side. At full power, steam was generated at 196°C and 14.3 bar. The steam flow was 30 kg/so The tubes had an outer diameter of 10 mm and an in).1er diameter of 7.5 mm. The steam
generators had a heat exchange area of 500 m 2 each. The steam generator shell was made
of 150 mm thick stainless steel [1, page 44£]. During startup, the steam generators were used for warming the heavy water of the primary side with electrically heated light water
on the shell-side. The steam generators were 10.5 m high, and had an inner diameter
of 1.7 m. The volume of the secondary side in each steam generators was 22 m3 ; see
Figure 2.5.
2.4.4
Main Coolant Circulation Pumps
The four main coolant circulation pumps were of the one-step centrifugal type. Each pump had a flow capacity of 255 kg/s, the pumps used 129 kW of power altogether at a
pump efficiency of 81
%.
The pumps had two speed drives.2.5
Secondary System
The secondary system contained light water, which was used for generating electricity and district heat in the steam plant. The steam plant consisted of the steam turbine, the condenser system and the feed water plant [1, page 62].
• The ,steam piping brought the steam that was produced in the steam generators to the steam turbine and/or the dump condensers.
• The condensation plant brought the condensed water from both the turbine
con-denser and the hot-well to the feed water tank. It also brought the condensed water
from the dump condensers to the feed water tank.
• The feed water system included pumps pressing the water from the feed water pumps to the steam generators and to the feed water tank. It was also used for bringing the water to the startup heat exchanger when warming up the feed water tank. Finally, it was used for the storage of feed water during de-gasifying.'
Since the system was planned to keep the outlet temperature and the heavy water flow constant through the reactor vessel, the reactor power was controlled by altering the
pressure on the light water side in the main heat exchangers. If the turbine load increased,
the steam consumption increased while the steam pressure (and the temperature) in the steam generator domes was decreased. Then, the temperature on the primary side
dropped - and thereby the core inlet temperature. More power could then be taken out
from the reactor.
The plant had two separate ways of operating the secondary side; the control by bypass cooling and the temperature control [1, pages 69-70]. In the temperature control mode,
the load on the district heating side decided the reactor power. Temperature control means that the temperature of the outgoing district heating water was kept constant.
2.6· Recooling System
If the reactor power had to be kept at a certain power level regardless of the district
heat consumption (for example, when full electrical power from the steam turbine was needed, or for reasons of reactor engineering), the hot water that returned from the .' district heating grid was cooled by the recooling system, in case of a turbine failure a dump condenser could take the reactor heat load. Connection was made from the turbine hall building to the cooling towers, which could accept the heat in the event of a failure in the district heating system [2].
The recooling system (P210) consists of 4 separate units, each containing the following;
a propeller, 4 water spreaders, heat exchanger bodies which are made out of paper with
a plastic surface and a water cleaner which separates any particles from th~ water and
cleans the water from algae. All the equipment were located in a cooling tower and the
water was kept in a big basin (500m3 )
The recooling system was designed to absorb a large amount of heat. It was used for
the following purposes [1, page 181]:
• To cool the surplus heat of the district heating grid when the reactor is not operated and a constant temperature is desired.
• Residual heat removal on certain occasions. • To cool the core during refuelling.
2.7
District Heating System
The district heating system was designed to provide hot water for the 10,000 households in Farsta. The distance from Agesta power plant to the local, oil-fueled subheating plant was 3.5 km.
The district heating water that was heated in the secondary side condensers of the plant was piped to the central heat exchanger and the warm water pipes in each house. The district heating piping system was a closed circuit. The outlet and inlet temperatures
of the district heating water
(Tout
=
75 - -120°C,Tin
=
50 - -20°C) varied with the demand. The large amount of water and the long circulation time made it possible to shut down the reactor for short periods of time, without causing any inconvenience for the customers [1, page 78].2.8
Emergency Core and Containment Cooling
Sys-tem
~ ; ,
The Emergency Cooling System of Agesta reactor was subdivided into two parts [4]:
• The Core Spraying System (denoted ECCS) P214/P82 prevented over-heating of the fuel in case of a LOCA.Light water was sprayed on the core through the fuel failure detection system (P82), which was a system which monitored tempera-. tures and radioactive content of the primary side coolant during normal operation
(its characteristics are described in further detail in section 4.4). In a large break LOCA, the core spraying system was vital for preventing core damage .
• The Containment Spray System (denoted CCS) P214 was designed to cool down and depressurize the containment after LOCA. Containment spray lines were in-stalled in the steam generator rooms, the rooms where the expansion tanks of the plant were located, and the reactor hall.
The water that was used in both spray systems was taken from a basin that has a
volume of 600 m3 . The basin was insulated with styrofoam and the water was kept cool
(about +2°C) by a cooling unit. When an accident had taken place and both spray systems were working, the water from the core spray system and from the containment spray system was collected in the drainage system and kept in a separate basin to cool down [4]. After approximately 45 minutes, the water level in the large cooling basin would be low and the water from the blowdown would then be pumped back there again from the drainage system (mixing heavy and light water). During the first 6 hours of operation, the temperature in the large cooling basin increased from +2°C to +15°C [4].
2.8.1
Emergency Core Cooling System
The Emergency Core Cooling System (ECCS) was designed to give a cooling effect enough to handle the heat released after a large break LOCA (Loss Of Coolant Accident), which in this case was assumed to be a break of one of the main coolant circulation pipes. The
containment would then receive the heavy water content of the vessel plus the light water contents of one of the steam generators (when one of the pipes break, the steam generator connected to that pipe was assumed to lose its light water as well, but the other three steam generators are not affected). In such an accident, the core coolant would escape from the reactor system, therefore, the core was sprayed with water, to prevent the fuel from over-heating.
The ECCS consisted of two pumps, P214 B1 and B2, each with the other one as a backup, if the activated pump showed any signs of malfunction, see Figure 2.6. Each pump had a capacity of 33 kg/s at 11.8 bar. The pumps were located outside of the air-tight containment [4, page 4] and [5, page 8], and took their (light) water from the big
basin that contained 600 m3 water, at a temperature of +2°C. The valves for opening
and shutting the system were placed upstream and downstream of the pumps. All of them were opened and closed by motors. The ECCS piping was connected with three valves to the system for fuel failure detection [4]. The light water flow through the core spray system into the vessel was 2000 kg/min (33.3 kg/s), it was distributed over the 140 fuel elements. Each fuel element was to receive approximately 15 kg/min of light water.
The flow was distributed over the cross-section of the fuel elements
[9].
All power to thesystem was taken from the power lines backed up by the diesel generators.
The ECCS was actuated if any of the following three conditions were fulfilled [6];
• The pressure in the vessel was lower than 7.5 bar.
• The temperature inthe steam generator room was over 60°C. • The water level in the vessel was lower than 0.7 m (from the top).
Because of possible malfunctions when opening the valves that connected the ECCS to the system for fuel failure detection, cross connections were made between the three lines of piping to ensure distribution of water over the whole core [6].
2.8.2
Emergency Containment Cooling System
The Emergency Containment Cooling System (CCS) was designed to lower the
over-pressure that would be created in the containment or in the reactor after an incident. It
was also designed to keep the containment at a pressure below the atmospheric pressure for a long time, approximately 100 days. The low pressure would prevent any radioactive gases from escaping out from the containment.
The maximum pressure in the containment after a large break LOCA was estimated to be 2.5 bar, and the containment spray system was designed to reduce that to a pressure of 0.995 bar in an hour. The low pressure was then kept for 100 days, a time necessary for decay of the noble gases and the short-lived radioactive iodine that may have accumulated in the containment. The temperature in the containment after a large break LOCA was calculated to be 105°C. That would be reduced to normal indoor temperature, 20°C [6J.
The containment spraying system consisted of three pumps, P2l4 B3 - B5. Each pump had a capacity of 45 kg/s, with a pressure head of 8.3 bar. The containment spraying system took its water from the same basin and used the same piping as the core spraying system. The water that was pumped from the basin passed through three emergency pre-cooling units before it was sprayed. From the emergency pre-cooling units, five pipes led to different parts of the containment; the main steam generator room, the room where the expansion tanks of the plant were located, the reactor hall for coarse spraying, the reactor containment with fine sprinkling (two lines). The valves for these operations were all opened and closed with motors [4].
Parts of the containment spray system could be activated individually, regardless of other parts of the system or the core spray system. That was the case when the pressure difference between the main steam generator room and the environment exceeded 0.025 bar [6J.
1 .2 18.6
j 108
109.5
Figure 2.1: Modified Hexagonal Fuel Pattern
" - +'
. I • .
~ . .
, .... ,
1.
Vessel wall
7. Upper
thermal shield
2.
Filler ring
3. Filler body
4. Outer thermal shield
5. Inner thermal shield
6. Distribution header
8. Vessel head
9. Flange
10.
Silver seal ring
11.
Fuel assembly
12.
Control rod
--::-T
---t·· \
,.,.,/
Pipe For Loading,
. Vith Control Drive
~-t----'.
Fuel Failure Detection
Thermo-couple
Pipe for Detection
Bolt For Tightening the Upper thermal Shield
Fuel Element
Safety Valve Steam Feedwater .... ~
..,
E o -... .: .. ' Tube bundle Tube sheet Flange Bolt 493 K 478 K Heavy WaterTo Fuel Elements t-rj oq" ~ ,..,
I I
I I
(1)To P 82 (System for Detection of Fuel Failures)
N Q) tr:l
a
-::t (1) C6 C7 C8 00 \0 ,.., N ' \0 00 ()"q -::t r- 00 (1) ~>
> >
() '-< 0 0 ,.., t - ' (1) t>1<l t><l ~P 82
1.0 0 0 2-P> ~-
M-111
V412 en '-< enI
I
P 214
M-(1)El
k 1-3 V772 t-rj-
0~~~
V808 I V 38~
~
V 33 ~ 0 P96 VXX V 37 V 32 ::r P> ,.., M- I B2t t
BI V788 P96 V16 V 36 V 31,- P
114
T1
600mChapter 3
THE FLOODING INCIDENT AT
THE .AGESTA NUCLEAR
POWER PLANT
3.1
Review of the Flooding Incident
The incident that took place in Agesta on 1st of May 1969 was a typical flooding scenario.
It was also a good example of the fact that an accident in one part of a nuclear power
plant, or any complex industrial plant, may cause severe unexpected consequences in other parts of the plant.
On the 1st of May 1969, the Agesta HPWR had been producing electricity and
dis-trict heat with full power (55 MWth , and 10 MWe ) since October the year before. In
the morning of that day a switching between two pumps, P210 El and B2 which were working in the recooling (P210) system, was performed according to instructions. In this
-' operation, however, valves were opened and closed in an incorrect order [7] and [8]. This
resulted in a rupture in one of the valves, which caused a major leakage of cooling water.
One of the large basins in the recooling system was emptied of its contents of 400 m3 of
light water. The stream of water hit a main busbar of the generator and caused a turbine shut-down. Due to the short-circuits in the wiring, flooding was not indicated on the control board, even though a ground fault was recorded.
The flood water caused many short-circuits in the electrical wiring and other problems. The water ended up in a room in the turbine building and the drainage system became overloaded. In that room pumps for the system P242 (the emptying of feed water and condensed water) and two drainage wells were located. Subsequently, the water 'ended
': ~.'
up in a separate basin and in the big cooling basin used in the ECCS. These basins were flooded and water had to be pumped out into the Lake Orlangen.
In another area of the plant a plug for cleaning the piping of the drainage system (a " cleaning eye") was pressed out. Water then flooded through it. Unfortunately, the plug
was located right above a cubicle, where many of the vital relays for the ECCS (P2l4)
were located. When the cubicle was flooded with water, several of these relays were short
circuited. The core spraying system was activated, one of the pumps started (P214 Bl)
and two valves opened, connecting the primary side water with the ECCS. Consequently, the other pump of the system also started automatically.
The ECCS (Emergency Core Cpolant System) worked at the pressure of 16 bar and
the piping was designed to withstand as much as 20 bar [ll]. The reactor was not
shut down at the moment when the core spraying system started, which means that the piping in the ECCS was exposed to a pressure that was probably much higher than it was designed for (the reactor pressure was 34 bar). Instead of working as it normally should, pumping in light water into a de-pressurized core (which would have been the case after
a large break LOCA), a total of 0.46 m3 of heavy water was pushed into the piping of
the ECCS. One possible reason that the piping did not break would be a leakage in the
isolation valves that separated the system for detection of fuel failures (P82) from the
ECCS (P214), see Figure 2.6.
Half an hour later, two isolation valves on the primary side closed due to further short circuits. The reactor was then shut down, to prevent the steam generator from being emptied of its contents.
About 8 hours later, the room that was flooded with water could be entered. Because
of the serious damage to the electrical components, and the large amount of water in
the plant, it was decided that the reactor-could not be restarted immediately. It was
considered that the· shut down time would help to dry out the systems and eliminate the possibilities of new ground faults.
3.2
Chronology of the Flooding Incident
1st of May 1969
09.14 According to instructions, a routine change of a pump is started in the recooling
system P210 (used to control the temperature of the incoming water from the district
heating grid). The pump in the recooling system was operating one month at the time, the other pump was on standby.
09.15 A valve located downstream of the pump that was recently shut down ruptures. The cooling water pond, which contains the cold water used to cool the incoming water
from the district heating grid is emptied of its contents; 400 m3 of light water. The pond
is located at the level +30 m.
A stream of escaping water from the ruptured valve hits the main busbar of the generator (6 kV). This leads to a turbine trip.
No indication of the flooding is given on the control board. Another signal in the control room showed, however, that the turbine shut-down was due to a ground failure.
09.15 - 09.20 The water continues to flow down through the plant, filling a room of
the turbine hall building with water, causing several electrical short circuits on its way.
09.20 ..:.. 09.25 The drainage system in the turbine hall becomes overloaded. Now
the plug for cleaning the draining pipe in another part of the station is pressed out. Unfortunately the plug is located right above a cubicle (called MA13) where many of the
vital relays of valves and pumps of the
EeeS
are situated.When the basins in the drainage system become full, the water flow is directed to the lake Orlangen. (Only a small amount is pumped out. The radioactivity is measured later and no increase is recorded.)
The cubicle is flooded with water. This leads to several short circuits in the wiring,
one of which leads to the startup of both
EeeS
pumps. Also, two of the valves thatseparate the heavy water of the primary system (the system for detection of fuel failures)
and the light water of the
EeeS
are opened shortly after the pumps are started. Theservice personnel shut off the
EeeS
manually, but did not realize that the valves hadopened.
When the valves opened, the pressure in the piping of the
EeeS
momentarilyin-creased from the operating pressure of the
EeeS
(16 bar) to the pressure in the primarysystem (34 bar). The piping in the
EeeS
was only designed to withstand pressures ashigh as 20 bar, yet it did not fail (because of the leakage in the isolation valves V886 in Figure 2.6).
Instead of pumping water to a depressurized core, 480 kg of heavy water flowed from
the primary circuit into the
EeeS.
If theEeeS
piping had broken, heavy water wouldhave been released from the pressure vessel and the core would have suffered a small
break accident. If a break would have happened outside the containment, the heavy
reactor had only one emergency cooling system.
09.42 The reactor is shut down, after shutting of two isolation valves on the feed water piping in the secondary system, caused by other short circuits in the wiring.
09.43 - 09.44 Two of the three pumps of the containment spraying system start and the valves of the system open. However, the system is shut down manually after a short time. A small amount of water was sprayed into the containment and the steam generator room.
09.45 and later Because of electrical failures, the valves of the ECCS (P214) opened and closed a few more times during the day, probably causing further pressure peaks in the piping of the core spraying system. A total of 15 main electrical failures are observed,
among others problems with indicators being 'half-lit' instead of not shining at all
[8].
Other valves are also shut or change function due to short circuits in the wiring.
17.15 The room that was filled with water can be entered, when some of its content
has leaked out through the door
[11].
5th of May 1969
Nuclear restart of the plant. All the electrical systems have by now been dried out, and the relays and the wiring that failed have been changed. An analysis of the safety in the plant due to flooding and also about the condition of the electrical equipment is ordered
[8] .
3.3
Hypothetical
Scenario
3.3.1
Nuclear Safety Aspects
The hypothetical scenario that will be analyzed in this report is a case in which a break would have occurred in the ECCS-piping at the moment when it was put under the reactor pressure (34 bar), which was higher than its design pressure of 20 bar. Under such circumstances, the single system for adding water to the primary side during a
LOCA and afterwards would not be available. The small break in the primary system may have the potential of uncovering the core, leading to a severe accident in which the following safety related aspects will have to be considered:
• The reactor core is not cooled successfully, core degradation would occur, and
D
2-gas which is produced due to the Zirconium oxidation, and fission products could be released to the break.
• The possible retention of fission products (the aerosols, not the noble gases) in the tortuous pathway through the ECCS-piping.
• The break location determines the possibility of fission product retention in the
containment, w~ich might be threatened by
D2
combustion.3.3.2
Break
Given the hypothetical occurrence of a break, the worst assumption is made that the break would have occurred in the part of the ECCS-piping where the diameter was the largest, and where the piping was designed to withstand 20 bar. This assumption originates from the fact that, generally speaking, pipes with a larger diameter are more prone to cracking when pressurized, than pipes with small diameters, see the assumed break location in Figure 4.3.
In consequence of this assumption, the leakage will consist of heavy water, or a two-phase mixture, escaping via all fuel rods in the core (at the time of the incident, the number of fuel elements was 97).
If a break would have occurred elsewhere in the system, water would not escape from
the core from all fuel rods in the core (the total break area would decrease) and the mass flow rate of the break would decrease.
3.3.3
Break Location
One possibility was that the break would have taken place inside the containment. For
such an event, one should consider also the generation and distribution of D2-gas, due
to steam induced oxidation of Zircaloy. This could lead to
D2
gas combustion in thecontainment. If the containment remained intact, it would mitigate the environmental
Since parts of the EGGS-system were located outside the containment, see Figure 2.6, the hypothetical break could have occurred in parts of the piping situated outside the containment. In that situation, primary system-gases and fission products would have been released to the environment, without the mitigating effect of the containment.
Chapter 4
SCOPING ANALYSIS
4.1
Introduction
In the hypothetical scenario to be analyzed (see section 3.3), the assumption is made that a break occurs in the ECCS piping. In consequence, heavy water will leak out of the primary system, which will result in a decrease of the volume and level of the cooling water in the reactor vessel. The analyses in this chapter will try to find an answer to the question; how soon would the leakage of water result in uncovering of the core? And if so, what would the behaviour of the core heat-up look like? An analysis of the rate of fuel temperature rise and the potential metal/water reactions that would take place has
also been performed. Possible release of fission products and D2-gases will be considered,
considering a break outside/inside the containment. Different means of cooling the fuel during the blow down and afterwards, will also be discussed.
4.2
Reactor System Thermodynamics
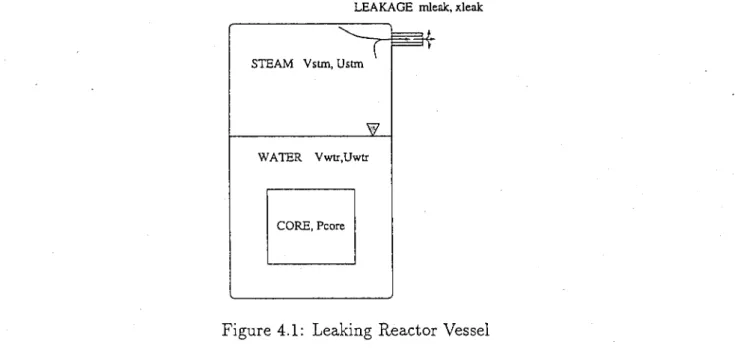
The first law of thermodynamics forms the basis for estimating the pressure in a leaking vessel;
6.E
=
6.Q - 6. W - 6.EZea k=
6.Q - 6.HZeak(4.1)
where:
6.E Change in internal energy
[J]
6.Q Heat transferred to the system
[J]
flHZeak = Enthalpy leaked from the system
[J]
When modeling the changes in a leaking reactor vessel, the terms are expressed by using
the core power (Pcore ) and the properties of the leaking coolant.1
flHZeak = (mZeakXZeakhstm
+
mZeak(l - xZeak)hwtr)flt flE = fl(aV pstmUstm+
(1 - a)V PwtrUwtr)(4.2)
(4.3)
(4.4)
Where a denotes the volumetric fraction of steam (void fraction), x denotes the mass
fraction of steam (quality), V denotes the total volume, and P denotes the density.
LEAKAGE mleak, xleak
'-...
=~( = r
STEAM Vstm, Ustm
WATER Vwtr,Uwtr
CORE, Peore
Figure 4.1: Leaking Reactor Vessel
The time discretization of the equations is performed to calculate the pressure inside the vessel as a function of time after leakage has begun. As noted, saturation is assumed all the time during the leakage. In this case, pressure alone determines the properties of the water, which are obtained with functions of Garland and Hand [14] for the water steam equation of state.
After each time step, a certain amount of mass and enthalpy has leaked out from the system, heat has been transferred to the coolant, and the internal energy has changed to
E'. The void fraction can be calculated from the total internal energy of the system.
1 Here the system refers to the mixture of water and steam, which is assumed to remain in thermal
equilibrium (saturation) through the event.
.~ .. :;.\
a'=
E' /V -
UwtrPwtr(4.5)
UstmPstm - UwtrPwtr
where U is the specific internal energy of water and steam.
The corresponding mass can then be calculated;
rn'
=
aV pstm+
(1 - a)V pwtr (4.6)The new mass can be based also on the leakage;
rn' = rn - mleak.6.t (4.7)
The new pressure is iterated until the equations (4.6) and (4.7) will give the same value of the new mass. The heat from the structures and the influence of the non-condensable gases in the pressurizer are omitted in this calculation.
4.3
Break Flow
Single-phase flow of heavy water, or steam flow through a path with a certain total pressure loss can be calculated using the Bernoulli equation;
(4.8)
where:
.6.p Pressure drop in the piping [Pa]
]{i - Loss factor
[-J,
including frictional pressure dropPi Density of the flowing liquid [kg/m3]
Vi - Velocity of the flowing liquid [m/s]
rni Mass rate of the flowing liquid [kg/s]
Ai - Cross-sectional area of the piping [m2]
By assuming constant density of the flowing liquid (or steam), the serial term becomes independent of water (steam) conditions, and the mass flow rate of the break can be expressed in terms of a reference pressure difference and density.
mbreak 6.PbreakPbreak
6.prej Prej
( 4.9)
Such reference values are estimated in the next section. It also has to be noted that
the method applied here is approximate, including severe limitations, when considering high velocity flows at high pressure . differentials (critical flow, coolant flashirig).
In order to relate the primary water inventory to the heavy water level in the reactor
vessel, the primary system volumes have to be examined, see Figure 4.2. It is assumed
that the most elevated water volumes in the primary system (the pressurizer, the water above the core, and parts of the steam generator volumes) are the first ones to be emptied
of water. The total volume of the primary system is 88.7 m3 . The initial void fraction,
CY, is 0.223. The total heavy water volume above the core is approximately 5 m3 •
This means that a relatively small amount of heavy water has to leak out of the system before the core is uncovered. However, when the system is depressurized, the water in the system begins to boil, and the water level swells.
4.4
Outflow Geometry
As mentioned, the assumption is made that the break would have occurred where the diameter of the piping of the EeeS is largest, and where the piping was designed to withstand only 20 bars. The flowpath via each individual fuel rod to the place where the break would have occurred can be divided into 13 parts (see Figure 2.3 and 4.3). The pressure loss can be calculated for the reference flow (using Equation 4.8), which is the relatively low mass flow rate that the fuel failure detection system has during normal
operation (mrej).
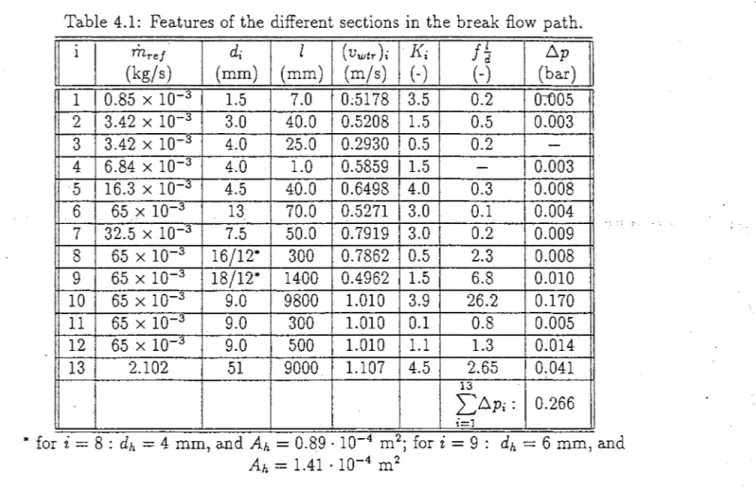
Table 4.1 shows the features of the break flow path, with calculated velocities and pressure drops for the reference conditions, and sections numbered according to Figure
4.3. It has to be noted that the calculation is similar to the design analyses, but no
information was found about possible measurements during operational testing of the fuel failure detection system, or the EeeS.
The pressure drop during the break would be the difference in pressure between the reactor and the containment, which is 33 bar at the initiation of the break. \iVhen the
. )
Table 4.1: Features of the different sections in the break flow path.
1 mref di I (vwtr
)i
]{if~
6.p (kg/s) (mm) (mm) (m/s) (-) (-)
(bar) 1 0.85 x 10 3 1.5 7.0 0;5178 3.5 0.2 0-:'005 2 3.42 x 10⁻³ 3.0 40.0 0.5208 1.5 0.5 0.003 3 3.42 x 10 3 4.0 25.0 0.2930 0.5 0.2 -4 6.84 X 10⁻³ 4.0 1.0 0.5859 1.5-
0.003 5 16.3 x 10 3 4.5 40.0 0.6498 4.0 0.3 0.008 6 65 x 10 3 13 70.0 0.5271 3.0 0.1 0.004 7 32.5 x 10 3 7.5 50.0 0.7919 3.0 0.2 0.009 8 65 x 10-3 16/12* 300 0.7862 0.5 2.3 0.008 9 65 x 10 3 18/12* 1400 0.4962 1.5 6.8 0.010 10 65 x 10-3 9.0 9800 1.010 3.9 26.2 0.170 11 65 x 10 3 9.0 300 1.010 0.1 0.8 0.005 12 65 x 10-3 9.0 500 1.010 1.1 1.3 0.014 13 2.102 51 9000 1.107 4.5 2.65 0.041 13 :L6.Pi: 0.266 i-I* for i
=
8 : dh=
4 mm, and Ah=
0.89.10-4 m2j for i=
9: dh=
6 mm, andAh = 1.41 . 10-4 m2
reactor pressure decreases, the pressure drop of the break decreases, and the mass flow rate decreases as well, according to Equation 4.9. As the pressure goes down, saturation of the water is reached, and therefore the steam content in the tank becomes larger.
One way of assigning a steam quality of the leaking heavy water is assuming a steam
quality of zero (x = OJ the leakage consists of water), right after the break has occurred.
The quality of the leakage then varies with the level of water in the tank1 which is related
to the calculated void. One assumption could be that the quality of the steam will change when the saturation pressure of the primary side is reached, but this assumption has not been included into this model.
Another way is to alter the steam quality of the break flow in one step from water
(x
=
0) to steam (x=
1). To approximate steam-dominated critical flow through thelong flow path and the phase change due to the pressure decrease in the piping of the ECCS, the break flow could be assumed to consist of steam during the whole time of the transient.
The model described here was programmed in FORTRAN, and named TEENAGE (Thermal Equilibrium ENergy calculation for AGEsta).
4.5
Boil-off Level
The water in the core and moderator starts to boil off as soon as the pressure in the primary side reaches saturation pressure (24 bar). After equilibrium between the contain-ment and the reactor vessel has been reached, a pressure difference between the reactor vessel and the containment has to be established in order to press steam out through the long, and thin pipes of the ECCS. The pressure inside the reactor vessel is increasing, as long as no steam is leaking out of the system. When the pressure difference between the containment and the reactor is large enough, steam escapes to the containment, then the reactor vessel is depressurized. This way, the pressure is varying. However, in this model,
constant pressure is assumed. The relative water level is 1.0 at the top of the core, and
0.0 at the bottom.
The boil off mass flow is described as follows:
where: Level Pd .6.hwtr Level· Pd mbo = .6.hwtr
Boil off mass flow rate [kg/ s]
Fractional water level in reactor vessel [-] Decay power [W]
Latent heat of water [kJ /kg]
The fractional water level can be expressed like this:
where:
.6.t Time step [s]
Vwtr - Specific volume of water [m3/kg]
Vcore Volume of core [m3]
n - Beginning of time step
n
+
1 End of time step31