Research
Robust structural verification of pressurized
nuclear components subjected to ratcheting,
part two – stress-strain curves for cyclic
elastoplastic analysis.
2017:05
SSM perspective
Background
Pressurized components in nuclear applications that are subjected to cyclic loading may exhibit progressive deformation, so called structural ratcheting. If the component is made out of a material that are deformation hardening, it may also exhibit material ratcheting.
The combined effects of structural- and material ratcheting are not taken into account in the methods and material models currently used for struc-tural verification of pressurized nuclear components.
Objective
The project aims to develop guidelines on how to evaluate pressurized nuclear components subjected to ratcheting in a rational and conservative way that are code compliant with ASME III.
In part one (SSM 2015:43) experimental studies where performed with two different laboratory test set ups, one called “two-rod test” and the other a tube test. Numerical studies with five different constitutive models where investigated for the ferritic steels P235 and P265 as well as the austenitic steel 316L. The constants in the constitutive models are based on mate-rial characterization via tensile testing and fully-reversed strain controlled cycling.
This report constitutes the second and final part of the project. It contains the experimental results of uniaxial testing of ferritic pressure vessel steels at elevated temperatures. It also contains stress-strain curves for stainless steels. These results give complementary information on material behaviour so that cyclic elastoplastic analysis, as specified in part one, can be performed to analyse ratcheting
Results
• The presence of the yield plateau in the stress-strain curve of ferritic steels presents a problem when analysing ratcheting which is resolved with these results.
• Stress-strain curves for cyclic elastoplastic analysis of the ferritic pressure vessel steels 16M03 and P250GH are determined experimentally.
• The curves of 16M03 and P250GH are scaled to fit code values of strength according to SS-EN 10028.
• Information is also given for the ferritic pressure vessel steels P235GH, P265GH and P295GH as well as for the stainless steels 316L/1.4404 and 304L/1.4307.
• The curve data are also given in tabular form to allow for convenient input in finite element analysis software
Project information
Contact person SSM: Daniel Kjellin Reference: SSM2015-3854
2017:05
Author: Mikael Möller
Senior structural engineers AB
Robust structural verification of pressurized
nuclear components subjected to ratcheting,
part two – stress-strain curves for cyclic
elastoplastic analysis.
This report concerns a study which has been conducted for the Swedish Radiation Safety Authority, SSM. The conclusions and view-points presented in the report are those of the author/authors and do not necessarily coincide with those of the SSM.
SUMMARY
Herein, experimental results on uniaxial testing of ferritic pressure vessels steels at ele-vated temperatures are reported. The objective of these tests is to provide complementary information on material behaviour for the application of the results reached in the previ-ously conducted research project ROBUS. More specifically, the presence of the yield plateau in the stress-strain curve of ferritic steels presents a problem for cyclic elasto-plastic analysis and this problem is resolved herein.
Stress-strain curves applicable for cyclic elastoplastic analysis are experimentally deter-mined for 16Mo3 and P250GH. The curves are scaled so as to compensate for the over-strength observed in the experiments in comparison to code values of over-strength. Hence, the given stress-strain curves may be used directly for analysis. The curves are given also in tabular form so as to allow for a convenient input in finite element analysis software. Information is given also for the steels P235GH, P265GH and P295GH. These steels were not tested due to inabilities of the workshop to manufacture circular specimen out of plates (oven test machine required circular specimen) and these steels cannot be delivered as round bars. However, they are similar to P250GH and generation of stress-strain curves via scaling of the ones for P250GH should be acceptable and this is done herein. All specimens for each material are manufactured from the same round bar and hence the statistical variation in properties between specimens is negligible. Therefore one speci-men per curve is sufficient.
For the sake of completeness, stress-strain curves are given also for stainless steels 316L/1.4404 and 304L/1.4307. These steels do not exhibit the problematic yield plateau but pressure vessel codes in general do not give any information on stress-strain curves and hence such information is valuable enough to repeat herein. The information given herein for these steels is collected from the French nuclear code RCC-MRx, and is given in the same tabular form as the ferritic steels.
SAMMANFATTNING
Föreliggande rapport redovisar enaxliga provningar av ferritiska tryckkärlsstål vid för-höjda temperaturer. Avsikten med dessa provningar är att generera kompletterande materialdata för tillämpning av de resultat som erhölls i projekt ROBUS. Mer specifikt är det förekomsten av flytplatå i arbetskurvan (spännings-töjningskurvan) hos ferritiska stål som är problematisk för cyklisk elastoplastisk analys och detta problem adresseras i denna rapport.
Arbetskurvor tillämpliga för cyklisk elastoplastisk analys har bestämts experimentellt för 16Mo3 och P250GH. Arbetskurvorna är skalade så att effekten av överstyrka i förhål-lande till normvärden på styrka är kompenserad för. De kan sålunda användas direkt i be-räkning. Informationen är given även i tabellform vilket underlättar indata till beräknings-program.
Information är given också för P235GH, P265GH samt P295GH. Dessa stål är inte pro-vade eftersom verkstaden inte kunde tillverka cirkulära provkroppar ur plåtar (provnings-maskinen i ugn fordrade cirkulära provkroppar) och dessa stål kan inte fås som rundstång. Dessa stål är dock lika P250GH och en skalning av resultaten för P250GH bör vara ac-ceptabelt och detta är gjort här. Alla provkroppar för respektive material är svarvade ur samma stång och spridning av egenskaper mellan provkroppar är därför försumbar och ett prov per kurva är tillräckligt.
För fullständighetens skull redovisas även kurvor för rostfria stål 316L/1.4404 och 304L/1.4307. Dessa stål uppvisar inte den problematiska flytplatån men arbetskurvor anges i allmänhet inte i normer och sådan information är därmed värdefull och lämnas därför häri. De arbetskurvor som redovisas här är hämtade från den franska kärnkraftsnor-men RCC-MRx.
CONTENTS
Summary ... 1 Sammanfattning ... 2 Contents... 3 1. Introduction ... 4 2. Background ... 4 3. Experimental investigations ... 7 3.1. Experimental setup ... 73.2. Monotonic tensile tests ... 8
3.3. Tensile to plateau extinct followed by load reversal ... 10
3.4. Stress-strain curves for cyclic elastoplastic analysis ... 16
References ... 21
Appendix 1 Stress-strain curves for 316L / 1.4404 ... 22
Appendix 2 Stress-strain curves for 304L / 1.4307 ... 26
1. Introduction
Herein, experimental results on uniaxial testing of ferritic pressure vessels steels are re-ported. The objective of these tests is to provide complementary information on material behaviour for the application of the results reached in the previously conducted research project ROBUS.
2. Background
Progressive deformation is one of three failure modes to address in the design and analy-sis of nuclear power plant pressure vessels and piping. Alternative denotations are ratch-eting or incremental collapse. The remaining two failure modes are plastic collapse and low-cycle fatigue. All three involve plastic deformations. This suggests elastoplastic anal-ysis would yield superior precision as compared to elastic analanal-ysis and that is indeed true for plastic collapse and low-cycle fatigue. The former is more or less independent of what constitutive model is adopted. The latter needs a kinematic hardening constitutive model but the type of kinematic model is more or less insignificant.
For progressive deformation however, there has been quite some scatter in numerical sim-ulation reported in the literature. This is in distinct contrast to simsim-ulation of plastic col-lapse and low-cycle fatigue. Obviously, since progressive deformation is a case of cyclic loading in the plastic range, simulation requires constitutive models with kinematic ele-ments. Different constitutive models have however been reported to predict very different results. This is indeed troublesome since the main objective with elastoplastic analysis is to provide accuracy.
There is indeed no lack of attempts to remedy this problem. In the literature there is a vast amount of proposals in terms of modification of constitutive models to better fit experi-mental data. In general, these modifications involve an increasing amount of model pa-rameters. Constitutive models using 20 parameters or more have been presented. Alt-hough parameter adjustment of such models may results in agreement with a certain set of experimental data, the parameter setup is likely unsuitable for other loadings. Such refined constitutive models obviously have an academic value. For industrial pur-poses however, the use of such models is not feasible. Constitutive models for industrial applications should be reasonably simple and involving as few model parameters as pos-sible. For that purpose, the research project ROBUS (Robust structural verification of pressurized nuclear components subjected to ratcheting) was initiated by Areva NP Uddcomb and Inspecta. The aim of the project was to reach a conclusion on what consti-tutive model is feasible for ratchet simulation. The project was funded by SSM, RAB, OKG, FKA and TVO and is reported in [1] .
In the project, extensive experimental investigations were conducted. The project was or-ganized such that Inspecta conducted experiments and simulations of a Bree-type prob-lem, and Areva NP Uddcomb conducted experiments and simulations of a pressurized
pipe subjected to axial strain cycling, corresponding to a pressurized pipe subjected to cy-clic secondary bending. These subprojects were conducted independently of each other. Simulations were conducted with the kinematic models of Prager, Armstrong-Frederick, Chaboche and Besseling. Moreover, simulations were conducted for ideal-elastoplastic material for comparison.
Armstrong-Frederick is a development of Prager and Chaboche is a development of Arm-strong-Frederick. Subsequent more advanced models in general exhibit the same mathe-matical structure as Chaboche. Prager, Armstrong-Frederick and Chaboche are conven-tional kinematic models with a translating yield surface. The mathematical structure of Besseling is different. The material is assumed to be a composition of several ideal-elas-toplastic subvolumes with different yield strengths. Hence, it does not involve yield sur-face translation. The kinematic feature follows from the build-up of internal residual stresses. This in fact resembles the real physical behaviour of metals on a crystal level. In [1] , a firm conclusion was reached. Simulations with the Besseling model were able to predict ratchet response with a surprisingly high accuracy. This was the case for both the Inspecta part of the project and for the Areva NP Uddcomb part. The number of different setups in the experimental tests was large and hence the agreement is not due to circum-stance. The predictions from the Besseling model were far better than the predictions from the other models.
In addition to being more precise, there is a major benefit of the Besseling model.
Whereas the others need adjustments of model parameters, the only input to the Besseling model is the stress-strain curve. The stress-strain curve is well defined and it needs no ad-justments. As a result, there is only one possible outcome from a ratchet simulation. As for the applicable stress-strain curve in ratchet simulation, the question arises whether to use the virgin monotonic stress-strain curve or the stabilized cyclic stress-strain curve. The latter is defined by subjecting a number of specimens to strain cycling at various strain amplitudes until the cyclic hardening is stabilized. The corresponding strain and stabilized stress amplitude constitutes a point in the stabilized cyclic stress-strain curve. The cyclic curve is considerably more beneficial than the virgin monotonic one due to the cyclic hardening. However, it requires a number of cycles to reach the stabilized stress amplitude for each strain amplitude. Simulating a ratchet response of a virgin material us-ing the virgin stress-strain curve will over-estimate the accumulated plastic strains. Con-ducting the same simulation with the stabilized cyclic stress-strain curve will under-esti-mate the accumulated plastic strains for a finite number of cycles. Because of this, the vir-gin stress-strain curve have been used in Sweden for ratchet simulations.
The virgin monotonic stress-strain curves of ferritic steels are however problematic in this respect. They exhibit a yield plateau which is unlike any other strain hardening metal. The yield plateau is a consequence of a complex interaction between interstitial and sub-stitutional atoms around dislocations and really represents an artificial raise of the yield strength. Without the plateau, the stress-strain curve would be similar in shape to any
strain-hardening metal with considerably smaller yield strength Rp02 than the actual yield strength R . eL
Once the yield plateau is wiped out, the steel behaves as the plateau never existed. Hence, at a load reversal following tension to the point of yield plateau extinct, the reversed stress-strain curve is more or less identical in shape to the reversed stress-strain curve of stainless steel subjected to the same loading.
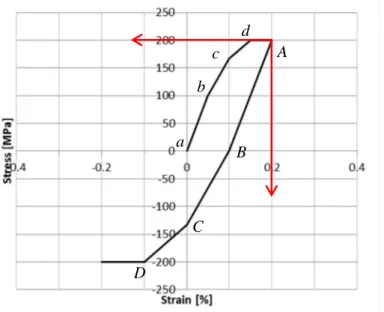
Obviously then, the applicable stress-strain curve of ferritic steels for simulation of cyclic elastoplastic loading is not the standard monotonic stress-strain curve. The applicable stress-strain curve may however be obtained as outlined already above. A uniaxial speci-men is i) loaded in tension to the point of yield plateau extinct, whereafter ii) the loading is reversed. The stress-strain curve is taken as the unloading curve from the point of yield plateau extinct by which the stresses and strains are divided by 2 in accordance with the Masing’s rule. Such curve was used in [1] for ratchet simulation with excellent results and the procedure is entirely compatible with the Besseling model as seen from the sim-plified illustration below. Assume a Besseling material with three equal subvolumes of elastic perfectly plastic (epp) materials according to Figure 1. The response in loading and subsequent load reversal is then according to Figure 2. Imagine stress-strain axes for the load reversal curve as indicated in Figure 2. Due to the build-up of internal residual stresses the load reversal curve ABCD comes out twice the loading curve abcd. Hence, the stress-strain curve abcd is reproduced taking the load reversal curve ABCD and divid-ing stresses and strains by 2.
Figure 2. Besseling response in loading and load reversal for three equally large subvolumes of
materials according to Figure 1. Red stress-strain axes for the load reversal curve.
The objective of this work is to generate such curves at room temperature as well as ele-vated temperatures for steel 16Mo3 and P250GH. The latter grade was selected on the ba-sis that it is the only PXGH steel available in round bar and it should represent P235GH – P295GH well enough, compensating for level of strength.
3. Experimental investigations
3.1. Experimental setup
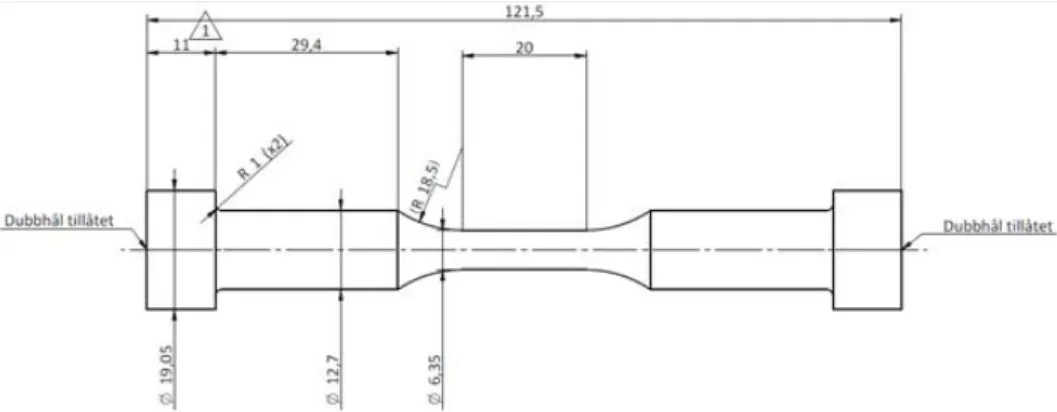
The tensile tests were conducted at Lund University of technology, division of solid me-chanics. The test specimen dimensions were according to Figure 3 below. The length 20 mm of the portion with diameter 6.35 mm was chosen as a compromise between obtain-ing an undisturbed stress field over the gauge length 12 mm and obtainobtain-ing a bucklobtain-ing re-sistance enough to generate reasonably large compressive stresses and strains.
The tests at elevated temperatures were conducted in an oven as seen in Figure 4. Ther-moelements was mounted so as to determine saturation of temperature.
The strain rate was determined so as to reach yield strength in approximately 30 seconds.
A B C a D b d c
Figure 3. Test specimen.
Figure 4. Test setup in oven. Thermoelements to the left, displacement gauges to the right.
3.2. Monotonic tensile tests
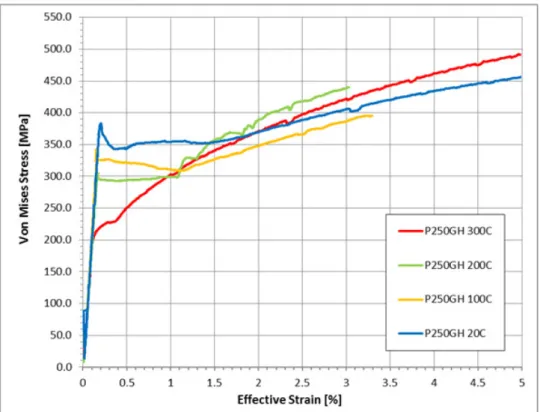
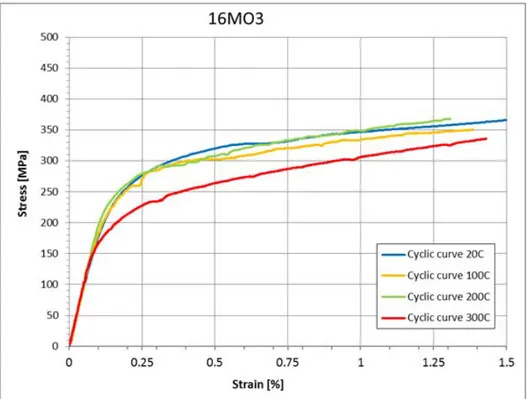
The monotonic stress-strain curves obtained from tensile tests within this work are shown in Figure 5 for 16Mo3 and in Figure 6 for P250GH. These curves certainly exhibit some interesting and unexpected characteristics.
The first observation is that the yield strength decreases with increased temperature, as expected.
The second observation is that the extent of the yield plateau decreases with increased temperature. This was not expected but it is not really surprising since increased tempera-ture increases dislocation mobility.
Third observation is that for strains beyond the yield plateaus, in the < 5 % range, the stress is higher for 300 °C and 200 °C than for 20 °C for P265GH. For 16Mo3, also the stress for 100 °C is higher than for 20 °C. This was certainly unexpected. In fact, it was so unexpected that initially it was believed that the tests were erroneously conducted. The French code for experimental and high-temperature reactors RCC-MRx, [2] , is an invaluable source of material data. It contains monotonic stress-strain curves for P265GH and for P295GH. These are shown in Figure 22 and Figure 23, respectively, in Appendix 3. As seen, in the < 5 % range, the same behavior is reported in the RCC-MRx for P265GH and P295GH as the observed behavior herein for P250GH. This behavior is par-ticularly clear for P295GH.
The objective of these monotonic stress-strain curves was to determine the strain magni-tudes at stress reversal for the subsequent tests. For instance, the length of the 16Mo3 yield plateau for 20 °C is seen to be 2 % in Figure 5 below and hence stress reversal (red curve) in Figure 7 is conducted at 2 %.
Figure 5. Stress-strain curves at room temperature and elevated temperatures for 16Mo3 as
Figure 6. Stress-strain curves at room temperature and elevated temperatures for P250GH as
ob-tained from tensile tests within this work.
3.3. Tensile to plateau extinct followed by load reversal
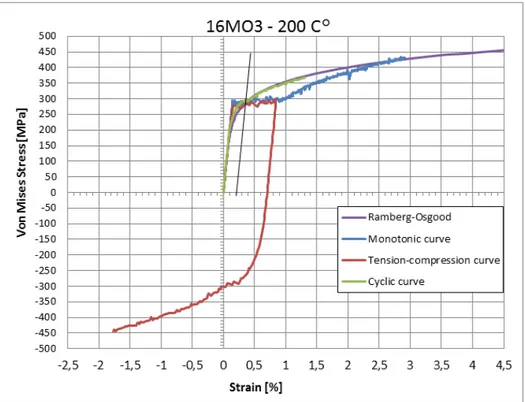
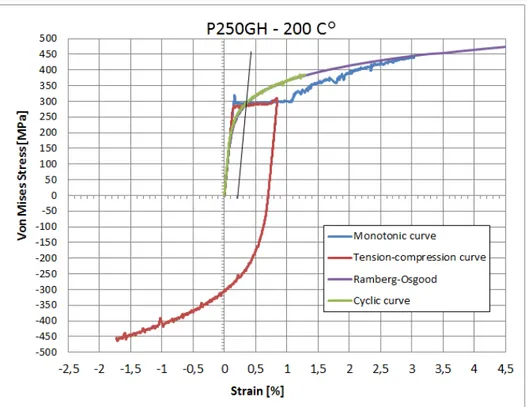
The tension to extinct of yield plateau followed by load reversal tests are conducted anal-ogously to the monotonic tests. The results for 16Mo3 are shown in Figure 7 – Figure 10. In these figures the monotonic tests are included as well as the unloading curve divided by 2 as discussed above (denoted in the figures as cyclic curve), and a Ramberg-Osgood fit of this unloading curve. The corresponding graphs for P250GH are shown in Figure 11 – Figure 14. In Figure 15 and Figure 16 the unloading curves divided by 2 (denoted in the figures as cyclic curve) are given for 16Mo3 and P250GH, respectively.
These unloading curves constitute the applicable stress-strain curves to be used for cyclic elastoplastic analysis. Their magnitudes however need be corrected so as correspond to code strength values. This is conducted in the following section.
Figure 7. 16Mo3 at 20 °C. Monotonic curve (blue), loading plus unloading curve (red), loading plus
unloading divided by two and moved to origo (green), and Ramberg-Osgood fit to the green (pur-ple).
Figure 8. 16Mo3 at 100 °C. Monotonic curve (blue), loading plus unloading curve (red), loading
plus unloading divided by two and moved to origo (green), and Ramberg-Osgood fit to the green (purple). Thin black line indicates 0.2 %.
Figure 9. 16Mo3 at 200 °C. Monotonic curve (blue), loading plus unloading curve (red), loading
plus unloading divided by two and moved to origo (green), and Ramberg-Osgood fit to the green (purple).
Figure 10. 16Mo3 at 300 °C. Monotonic curve (blue), loading plus unloading curve (red), loading
plus unloading divided by two and moved to origo (green), and Ramberg-Osgood fit to the green (purple).
Figure 11. P250GH at 20 °C. Monotonic curve (blue), loading plus unloading curve (red), loading
plus unloading divided by two and moved to origo (green), and Ramberg-Osgood fit to the green (purple).
Figure 12. P250GH at 100 °C. Monotonic curve (blue), loading plus unloading curve (red), loading
plus unloading divided by two and moved to origo (green), and Ramberg-Osgood fit to the green (purple).
Figure 13. P250GH at 200 °C. Monotonic curve (blue), loading plus unloading curve (red), loading
plus unloading divided by two and moved to origo (green), and Ramberg-Osgood fit to the green (purple).
Figure 14. P250GH at 300 °C. Monotonic curve (blue), loading plus unloading curve (red), loading
plus unloading divided by two and moved to origo (green), and Ramberg-Osgood fit to the green (purple).
Figure 15. 16Mo3. Reversed stress-strain curve divided by 2.
3.4. Stress-strain curves for cyclic elastoplastic analysis
The stress-strain curves in Figure 15 and Figure 16 are applicable for cyclic elastoplastic analysis of 16M03 and P250GH components, respectively, but their magnitudes corre-spond to the particular batch they are made from and hence they do not represent code magnitudes of strength. As seen in Figure 5 and Figure 6, the experimental yield strengths at room temperature are Sy 320MPa for 16Mo3 and
S
y
350
MPa for P250GH. The corresponding code yield strength values are Sy 275MPa for 16Mo3 and Sy 250 MPa for P250GH according to SS-EN 10028. Hence, to obtain room temperature stress-strain curves with strength level according to code values, the experimental stress-stress-strain curves are scaled with the factors 275 / 320 and 250 / 350 for 16Mo3 and P250GH, re-spectively.Now, as for the corresponding curves at elevated temperatures, there is no particular cor-respondence between the monotonic curves and the unloading curves. This appears to be due to the varying magnitudes for the yield plateau. Therefore, to obtain elevated temper-atures stress-strain curves with code strength levels, these are scaled with the same factors as the room temperature curves.
The experimental investigation covers 16Mo3 and P250GH. As seen, there are only small differences between the two. The behavior of steels P235GH, P265GH and P295GH are likely to be very similar to P250GH and to obtain applicable stress-strain curves for these materials, the stress-strain curves for P250 GH are scaled with factors 235 / 250 ,
265 / 250 and 295 / 250 , respectively.
The stress-strain curves applicable for cyclic elastoplastic analysis are given in Figure 17 - Figure 21 below. The information is given also as tabular data in Table 1 – Table 6. It is recognized that the stress-strain curves for temperatures 20°C, 100°C and 200°C in Fig-ure 17 – FigFig-ure 21 are more or less the same. The minor deviations are not worthwhile to account for and therefore one curve is used for temperatures up to 200°C in the tabular data.
The stress-strain curves in Figure 17 – Figure 21 go to 1.5 % strain. However, for the 20 °C case experimental data covers 5 %. The reason for the others not reaching 5 % was due to buckling of the specimen. The same tangent modulus is therefore assumed for ele-vated temperatures between 1.5 and 5 % strain, which allows for tabular data up to 5 % strain for all temperatures. Larger strain than that is not required for stress-strain curves used for cyclic elastoplastic analysis.
For completeness, this report gives information also about stress-strain curves applicable for stainless steels. The information given herein is collected from [2] and applies to steel X2CrNiMo17-12-2 which is a 1.4404 steel corresponding approximately to 316L, and X2CiNi18-9 which is a 1.4307 steel corresponding roughly to 304L.
The derivation of the tabular data for stress-strain curves for these steels are conducted in Appendix 1 and Appendix 2. The results are shown in Table 7 and Table 8 below. It should be mentioned the strength data is collected from [2] and the strength magnitudes are slightly low which may be due to the fact that there are no limitations on thicknesses. For applications where higher strength is applicable, the stress-strain curves may be scaled by the ratio of yield strengths. This is compatible with the rules given in [2] .
Figure 17. Stress-strain curves applicable for cyclic elastoplastic analysis of 16Mo3 components.
Figure 19. Stress-strain curves applicable for cyclic elastoplastic analysis of P250GH components.
Figure 21. Stress-strain curves applicable for cyclic elastoplastic analysis of P295GH components.
Table 1. Tabular data point 1 for stress-strain curves applicable for cyclic elastoplastic analysis of
all ferritic components.
T[°C]
< 200 0.0005 100 300 0.0005 95
Table 2. Tabular data points 2 – 7 for stress-strain curves applicable for cyclic elastoplastic analysis
of 16Mo3 components.
T0,001 0,002 0,003 0,005 0,01 0,05 < 200 °C 160 MPa 225 MPa 250 MPa 270 MPa 300 MPa 370 MPa
300 °C 140 MPa 180 MPa 205 MPa 225 MPa 255 MPa 325 MPa
Table 3. Tabular data points 2 – 7 for stress-strain curves applicable for cyclic elastoplastic analysis
of P235GH components.
T0,001 0,002 0,003 0,005 0,01 0,05 < 200 °C 122 MPa 169 MPa 188 MPa 212 MPa 235 MPa 301 MPa
Table 4. Tabular data points 2 – 7 for stress-strain curves applicable for cyclic elastoplastic analysis
of P250GH components.
T0,001 0,002 0,003 0,005 0,01 0,05 < 200 °C 130 MPa 180 MPa 200 MPa 225 MPa 250 MPa 320 MPa
300 °C 115 MPa 155 MPa 170 MPa 190 MPa 220 MPa 290 MPa
Table 5. Tabular data points 2 – 7 for stress-strain curves applicable for cyclic elastoplastic analysis
of P265GH components.
T0,001 0,002 0,003 0,005 0,01 0,05 < 200 °C 138 MPa 191 MPa 212 MPa 239 MPa 265 MPa 339 MPa
300 °C 122 MPa 164 MPa 180 MPa 201 MPa 233 MPa 307 MPa
Table 6. Tabular data points 2 – 7 for stress-strain curves applicable for cyclic elastoplastic analysis
of P295GH components.
T0,001 0,002 0,003 0,005 0,01 0,05 < 200 °C 153 MPa 212 MPa 236 MPa 266 MPa 295 MPa 378 MPa
300 °C 136 MPa 183 MPa 201 MPa 224 MPa 260 MPa 342 MPa
Table 7. Tabular data for stress-strain curves applicable for cyclic elastoplastic analysis of 316L /
1.4404 components.
T 0,00049 0,00054 0,00061 0,00070 0,002 0,003 0,005 0,01 0,05 20 °C - - - 140 MPa 174 MPa 186 MPa 202 MPa 224 MPa 297 MPa 100 °C - - 119 MPa - 153 MPa 164 MPa 177 MPa 194 MPa 275 MPa 200 °C - 100 MPa - - 129 MPa 138 MPa 146 MPa 162 MPa 238 MPa 300 °C 86 MPa - - - 112 MPa 118 MPa 129 MPa 140 MPa 212 MPaTable 8. Tabular data for stress-strain curves applicable for cyclic elastoplastic analysis of 304L /
1.4307 components.
T 0,00042 0,00046 0,00054 0,00066 0,002 0,003 0,005 0,01 0,05 20 °C - - - 131 MPa 163 MPa 175 MPa 190 MPa 210 MPa 280 MPa 100 °C - - 105 MPa - 135 MPa 144 MPa 155 MPa 171 MPa 242 MPa 200 °C - 86 MPa - - 111 MPa 118 MPa 126 MPa 139 MPa 204 MPa 300 73 MPa - - - 95 100 110 119 180REFERENCES
[1] Möller, M., Gustafsson, A., Segle, P., Robust structural verification of pressurized
nuclear components subjected to ratcheting. SSM research report 2015:43.
[2] RCC‐MRx. Design and construction rules for mechanical components of nuclear installations. Afcen, 2012 edition.
APPENDIX 1 STRESS-STRAIN CURVES FOR 316L
/ 1.4404
Information on monotonic stress-strain curves for stainless steel 316L / 1.4404 may be collected from the French nuclear code RCC-MRx, [2] . The information given below is taken from Appendix 3 of that code. The section A3.3S.451 gives stress-strain curves up to 1 % and the section A3.3S.452 gives stress-strain curves up to ultimate strain, however up to 5 % strain is sufficient for elastoplastic cyclic analysis. Section A3.3S.452 gives stress-strain curves also in tabular data.
All given curves below are average curves. The average and minimum yield strengths
0.2,moy
R and R0.2,min are given in table A3.3S.41 below. As seen in section A3.3S.451
be-low, the minimum stress-strain curves are obtained simply by scaling the average ones by the factor R0.2,min /R0.2,moy. Doing so, the obtained applicable stress-strain curves for cyclic elastoplastic analysis are given in Table 9 below.
Table 9. Tabular data for stress-strain curves applicable for cyclic elastoplastic analysis of 316L /
1.4404 components. The information may be used also for 316 / 1.4401.
T 0,00049 0,00054 0,00061 0,00070 0,002 0,003 0,005 0,01 0,05 20 °C - - - 140 MPa 174 MPa 186 MPa 202 MPa 224 MPa 297 MPa 100 °C - - 119 MPa - 153 MPa 164 MPa 177 MPa 194 MPa 275 MPa 200 °C - 100 MPa - - 129 MPa 138 MPa 146 MPa 162 MPa 238 MPa 300 °C 86 MPa - - - 112 MPa 118 MPa 129 MPa 140 MPa 212 MPaAPPENDIX 2 STRESS-STRAIN CURVES FOR 304L
/ 1.4307
Information on monotonic stress-strain curves for stainless steel 304L / 1.4307 may be collected from the French nuclear code RCC-MRx, [2] as for 316L / 1.4404 in Appendix 1 above. The section A3.4S.451 below gives stress-strain curves up to 1 %. The corre-sponding information on stress-strain curves for strains exceeding 1 % as given for 316L / 1.4404 in section A3.3S.452 is lacking for 304L / 1.4307.
However, noting that in the mathematical representation of stress-strain curves in sections A3.3S451 and A3.4S451, the only parameter that differs is the yield strength. Hence, the applicable stress-strain curves for cyclic elastoplastic analysis of 304 L / 1.4307 compo-nents are obtained simply by scaling the yield strengths. The yield strengths at tempera-tures for 304L / 1.4307 are given in table A3.4S.41 below.
Table 10. Tabular data for stress-strain curves applicable for cyclic elastoplastic analysis of 304L /
1.4307 components. The information may also be used for 304 / 1.4301.
T 0,00042 0,00046 0,00054 0,00066 0,002 0,003 0,005 0,01 0,05 20 °C - - - 131 MPa 163 MPa 175 MPa 190 MPa 210 MPa 280 MPa 100 °C - - 105 MPa - 135 MPa 144 MPa 155 MPa 171 MPa 242 MPa 200 °C - 86 MPa - - 111 MPa 118 MPa 126 MPa 139 MPa 204 MPa 300 °C 73 MPa - - - 95 MPa 100 MPa 110 MPa 119 MPa 180 MPaAPPENDIX 3 STRESS-STRAIN CURVES FOR
P265GH AND P295GH
Virgin monotonic stress-strain curves for P265GH are shown in Figure 22 below and for P295GH in Figure 23 below. The information is collected from Appendix 3 in [2] . The information below is only given as a background for discussion of the experimental re-sults presented within this report. It is not intended for any other use in relation to ratchet simulation.
Figure 22. Stress-strain curves at room temperature and elevated temperatures for P265GH, from [2] .
Figure 23. Stress-strain curves at room temperature and elevated temperatures for P295GH, from [2] .
Strålsäkerhetsmyndigheten Swedish Radiation Safety Authority
2017:05 The Swedish Radiation Safety Authority has a comprehensive responsibility to ensure that society is safe from the effects of radiation. The Authority works to achieve radiation safety in a number of areas: nuclear power, medical care as well as commercial products and services. The Authority also works to achieve protection from natural radiation and to increase the level of radiation safety internationally.
The Swedish Radiation Safety Authority works proactively and preventively to protect people and the environment from the harmful effects of radiation, now and in the future. The Authority issues regulations and supervises compliance, while also supporting research, providing training and information, and issuing advice. Often, activities involving radiation require licences issued by the Authority. The Swedish Radiation Safety Authority maintains emergency preparedness around the clock with the aim of limiting the aftermath of radiation accidents and the unintentional spreading of radioactive substances. The Authority participates in international co-operation in order to promote radiation safety and finances projects aiming to raise the level of radiation safety in certain Eastern European countries.
The Authority reports to the Ministry of the Environment and has around 300 employees with competencies in the fields of engineering, natural and behavioural sciences, law, economics and communications. We have received quality, environmental and working environment certification.