NUTRIENT RECOVERY FROM
ANAEROBICALLY DIGESTED ORGANIC
WASTES
Deshai Botheju
10ystei11 Svalheim
2Bjorn Rydtu,i
2Jo-Ela Johansen
2RuneBakke
1 1Telemark University College, Norway,
2BioTekAS, Norway
ABSTRACT
Effluents (digestates) resulting from anaerobic digestion of wet organic wastes can be recycled as fertilizers. Separation of such digestates into a wet and a dry fraction is common. The solid fraction is often sold as a soil enhancement product while the liquid fraction is usually discarded as wastewater. A large portion of the digestate nutrients is dissolved as ions in the liquid. The aim of this study is to establish an efficient way to convert this into a liquid "organic fertilizer". Enhancement of the nutrient concentration is necessary in order to make the final product commercially acceptable. Direct evaporative concentration is not suitable as it would lead to a significant loss of ammonia due to the fact that most of the available nitrogen in these digestates is present in the ammonium/ammonia form. Thus stabilizing the product by partial nitrification prior to evaporation is proposed based on a series of experiments conducted to evaluate the appropriateness of this approach.
The ammonium-N concentration of the digestate used was 1.7 g/L. The nitrification does not appear to be inhibited by ammonia, nitrate or nitrite accumulation, except when pH > 7.5, a situation that can be avoided by regulating the feeding rate based on pH measurements. Significant nitrite accumulation was not observed either. Nitrification is however consistently limited by alkalinity so that only about 75% of the ammonia can be converted to nitrate without alkalinity supplementation. The nitrification brings the pH down below 5.0 where the remaining ammonia is present as> 99% NH/. At this condition the nitrified digestate can be evaporated without a significant nitrogen loss and the product is recognized to be a high quality liquid fertilizer. It is suggested that the production of concentrated partially nitrified organic fertilizers can become a sustainable way of nutrient recovery from anaerobic digestates originating from municipal organic wastes.
KEYWORDS
Anaerobic digestion; Nutrient recovery; Organic fertilizer; Partial nitrification; Wet organic wastes.
97 https://doi.org/10.15626/Eco-Tech.2007.008
1 INTRODUCTION
Nutrient mismanagement can lead to disastrous environmental alterations due to excessive accumulation of Nitrogen in soil and water. Eutrification of surface water bodies, ammonia toxicity in aquatic life forms, groundwater poisoning, acid rains, assisting ground level ozone and smog are among the major environmental impacts of different nitrogenous compounds resulting from untreated nutrient releases to open environment [ 1, 2]. After the EU directive of 91 /271 /EEC [3], European member states were guided to adopt more stringent water nutrient standards and incorporate nutrient removal stages into theit wastewater treatment facilities. However, instead of following the traditional nitrogen removal treatment strategy which converts chemically bound nitrogen into N2 gas, the modern day treatment practice encourages the reuse and recycle of nutrients from wastes. For example, it is estimated that the recycling nutrients from domestic wastes can replace 35-45 % of the (industrially produced and energy intensive) fertilizer use [ 1 ]. This level of nutrient recycling will be essential in future for achieving a sustainable relationship between the natural environment and ever increasing human interferences on it.
The effluents from anaerobic digesters operating on municipal organic wastes contain relatively high amounts of ammoniacal nitrogen. This is due to the reason that ammonium being one of the basic end products of protein metabolism [4] and municipal organic wastes are usually rich in protein sources instigating from food residues. On the other hand, methane fermentation processes do not fix nutrients in an effective manner [5, 6]. In fact anaerobic digestion increases the content of soluble nutrients via dissolution of particulate organic matter [6] by hydrolysis and other degradation pathways. Not only the proteins but also various other organic nitrogenous compounds such as amino acids, urea, etc., are mainly reduced to ammonia under the anaerobic conditions, but ammonia itself cannot be further degraded without an aerobic treatment stage [2] to oxidize ammonical nitrogen to nitrites and nitrates.
The direct application of anaerobic digestates as nitrogen fertilizers in farmlands [5, 6] is the most straightforward method of nutrient recycling in small scale and closed systems (like small scale farms, diaries, sugar mills etc.). But when it comes to the large commercial scale applications, such easy dumping may not be acceptable due to number of reasons including, the state's guidelines on toxic substances in commercial fertilizers (e.g. heavy metals), the public acceptance based on aesthetic quality of the product (odor, color, particulate matter etc.). However the most critical barrier for using these digestates as direct commercial fertilizers is the instability of the ammonical nitrogen (NH4-N) at and above neutral pH levels typical for digestates. The high ammonical nitrogen content hinders the capability of concentrating these digestates by evaporation as it tends to release ammonia (gas), heavily reducing the fertilizer quality and causing air pollution.
Partial nitrification of such digestates prior to evaporative up-concentration is proposed to make a commercially acceptable high grade fertilizer product. Nitrification converts ammonical nitrogen into nitrates (N0-3) which is more stable in the soil and is a highly mobile nitrogen source for plants. Nitrification can be achieved by biological means with two basic biochemical reactions. Ammonium is first oxidized into nitrite (Equation 1) by a group of bacteria (nitritifiers) and then nitrite is further oxidized into nitrate (Equation 2) by another group of bacteria (nitratifiers). Both bacterial groups are aerobic autotrophic organisms.
2NH; +302 ➔ 2NO� +4H+ + 2H,O (I)
(2)
A laboratory study was carried out on nitrification of anaerobic digestates to investigate the feasibility of commercial grade liquid fertilizer production based on large scale municipal organic waste/food residue anaerobic digesters. The experiment was based on an assay of bio reactors comprising five intennittently fed continuously aerated nitrification columns. 2 MATERIALS AND METHODS
2.1 Feed source
The feed digestate was obtained from an active anaerobic digestion plant (Hadeland and Ringerike Avfallselskap, Jevnaker, Norway). This plant has a total reactor volume of 2300 m3 in three stage reactors; one hydrolysis tank (350 m 3) followed by two consecutive methanogenic reactors ( 1500 and 450 m 3 respectively). The plant is operated at a (total) hydraulic retention time of 20 days. This plant has been operating on municipal source separated organic residues for more than one year. The first methanogenic reactor is maintained at thermophilic conditions (52 - 55 ° C) and the second digester is operated under ambient conditions without temperature control. At the time of the experiments reported here the effluent from this second reactor contained approximately 1700 mg/L of NH4-N (see
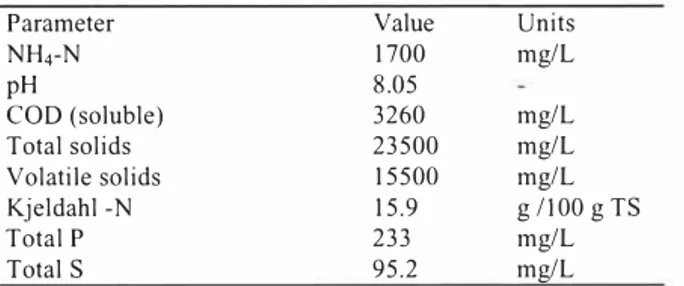
Table 1), and was used as the feed source in this study. Table 1. Characteristics of anaerobic digestate used.
Parameter Value Units
NH4-N 1700 mg/L pH 8.05 COD (soluble) 3260 mg/L Total solids 23500 mg/L Volatile solids 15500 mg/L Kjeldahl -N 15,9 g /l00 g TS Total P 233 mg/L Total S 95,2 mg/L
2.2 Nitrification reactor set up
The reactor assembly consisted of five glass columns (Im height and 5 cm internal diameter) each equipped with aeration diffusers and tube connections (Tygon tubes of 6 mm outer diameter) to feed and take out samples. The diffusers placed at the bottom of the columns provided air supply and also the mixing. Continuous aeration was provided by aquarium aerators (Eheim 400, 4 Watts) with two channels in each unit.
The used inoculum was a mixture of, 4.0 L sludge from a nitrifying wastewater treatment facility (ESSO petroleum refinery at Slagentangen, Vestfold, Norway), 0.8 L sludge from a municipal wastewater treatment plant with biological N and P removal stages (Risor, Norway), and 0.2 L sludge from a bench top scale nitrification reactor operated on a synthetic 99
nutrient feed (4,438 g/L of (NH4)2 SO4, 3.581 g/L of K2HPO4, 0.344 g/L of KHe2PO4, and 7,445 g/L of NaHCO3), This inoculum mixture was pre-acclimated with the anaerobic digestate in an aerated vessel for 20 days before introduced to the reactor columns. During this period a total ofe200 ml of digestate was fed to the acclimatization vessel,
After starting the column assay experiment, each column was fed daily (for most of the experimental period) and the same amount of effluent was taken out before feeding, A sedimentation phase of 15 minutes was allowed (by stopping the aeration) before the effluent removal, Small amounts of tap water had to be added each day for the compensation of evaporation losses from the column tops, The effluents from all the reactors were collected and stored in a separate vessel in order to carry out other intended tests (e,g, evaporation tests, plant growth tests etc.), planned as a continuation of this study,
40 35 -;:; 30
"'
"O ::: 25•-••
,s
E
20 �•••'"•••......
]15� "O u. 10-5 • col 1 -col 2 .i.col 3 col 4 o col 5
0 10 20 30 40 50 60 70
Time (days)
Figure 1. Volumetric feed pallernfor the jive columns. 2.3 Operating conditions
The reactors were operated in a laboratory ventilation hood maintained at ~ 25 °C temperature, Two different NH4-N loading schemes were tested (Figure 1). In order to further acclimate the culture to the digestate feed and to avoid overloading, the columns were initially fed low amounts of daily feed volumes (IO and 15 mL/day) and then feeding volumes were stepwise increased. This step increasing was done from day I to day 1 2 until it reached the 20 and 30 mL/day steady feeding levels which were maintained constant during the main phase of the experimentation lasted for 31 days (from day l 3 to day 43),
ln addition to the difference in feed volumes, two of the columns (columns l and 5) were fed with the clear phase of gravity settled digestate (after allowing the digestate to sediment for one day in a 100 mL volumetric cylinder filled to a liquid height of 20 cm), The other three
This unsedimented and sedimented feed difference was made to reveal possible effects on the process and the final product induced by the heavy particulate fraction of the digestate.
After finishing the main steady feeding phase of the experiment (3 I days long), the increased volumes of 25 and 35 ml/day were fed during the period between day 44 and day 51 as displayed in Figure 1. Once again, during the period of day 52 to the end of the experiment (on day 68) feed volumes were reduced back to 20 and 30 ml/day. The feeding was less regular during these last two periods.
2.4 Analytical methods
Daily pH measurements were made before and after feeding using a Beckman <ll 390 pH meter. More detailed pH measurements (usually on two hours basis) were made at selected feeding cycles (between two consecutive feedings). The concentrations ofNH4-N, NOe3-N and NO2-N in the five columns were measured at selected feeding cycles. NH\, N0-3, and N0-2 analyses were perforn1ed with Dr. Lange mobile photometer (Lasa I 00) by using Dr. Lange analysis cuvettes LC K 335 (ammonium), LC K 340 (nitrate) and LCK 342 (nitrite). CO D (s) measurements were made by using the closed reflux colorimetric method with Hach DR2000 photometer. For the analyses of NH\, N0-3, N0-2 and CO D (s), IO ml samples were taken from the each column and centriefuged at 9000 rpm for IO minutes and then the supernatants were filtered through 0.45 µm syringe filters and finally diluted to required ranges (I 0, 20 or 50 times) using deionized water. The levels of dissolved oxygen in the reactors were measured using W TW Oxi 340- A oxygen meter in order to confirm that a sufficient aeration efficiency was maintained in the reactor assay. Sludge sedimentation rates of the different reactor columns were estimated at the start and at the end of the 3 2 days long steady feeding phase. Standard methods were used to determine the total suspended solids ( T S S) and volatile solids (V S) contents of the feed digestate [ 7].
3 RES UL TS AND DISCUSSION
3.1 System monitoring via pH measurements
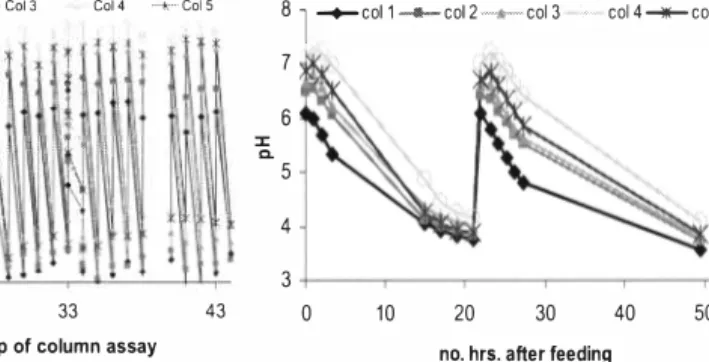
The variation of pH during each consecutive feeding interval (I day) was monitored as an easy and appropriate way of following the nitrification dynamics in the reactors. The pH drop follows nitrification as nitrification consumes 7.0 7 g alkalinity (as CaC03 equivalent) per gram of NH4-N converted [8]. According to Figure 2a, it is clear that pH respond consistently to feeding cycles. A closer look at the pH measurements for all 5 reactors during two consecutive feeding cycles confirm the consistent pH response and show that differences between the reactors can be detected (Figure 2b).
Columns fed 30 ml of digestate (columns 3, 4 and 5) show a larger pH drop, compared to the columns fed 20 ml of digestate (columns I and 2), but maintain a higher average pH (Figure 2b), suggesting that ammonia availability is the limiting factor in these tests. The columns fed pre-sedimented digestate (I and 5) had less alkalinity compared to the columns fed unsedimented digestate ( 2, 3 and 4), resulting in a steeper pH drop. This is illustrated by comparing the pH curves of columns with the same feed volume; 5 with 4 and I with 2 (Figure 2b). The suspended solids present in the digestate evidently contribute additional buffer capacity via dissolution of solids to soluble ions.
--Col 1 •·-· Col 2 >0<-·· Col3 Col4 ····k-ColS
81
--
col 1 -<1-col 2 _,,__col 3 -col4--col5 513 23 33 43 0 10 20 30 40 50
days from start up of column assay no, hrs, after feeding
Figure 2a. pH variation for the duration from Figure 2a, pH variation for the duration from
day 13 to day 44 (steady feeding phase).
day 13 to day 44 (steady feeding phase). 7 1 6,5 � 5,5 4,5 3,5 7 6 :c Q, 5 4 3
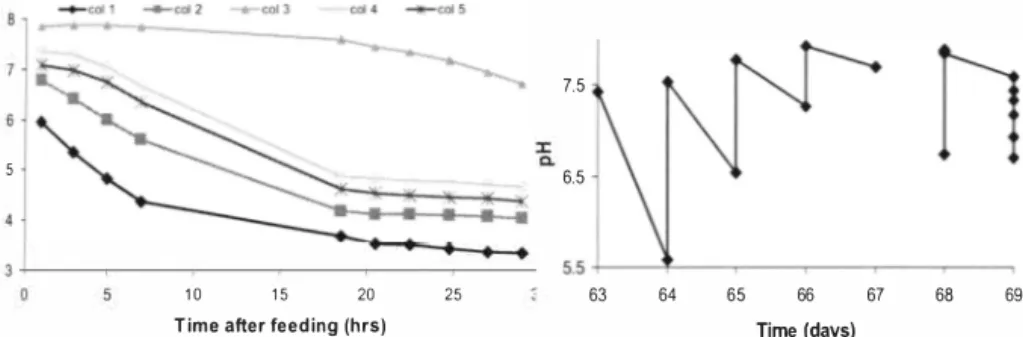
At the end of the 32 days long steady feeding duration, the two feeding levels were increased from 20 and 30 mL/day to 25 and 35 mL/day. The corresponding pH measurements suggest that the nitrification rate has dropped significantly after the load increase, For example, before the load increase (on day 43 and day 44) pH drops observed in a single day time period (between two consecutive feedings) for five columns (col, l to col, 5) were 6,1 to 3.9, 6.4 to 3.8, 7 .0 to 4.1, 7,3 to 4.4 and 7 .1 to 4.4 respectively, But after the load increase (on day 44 ), it took four days for the pH in columns l and 5 to drop from 7.3 to 4.1 and from 7.3 to 4.5, respectively (without any feeding in between). This condition was defined as an overload. Meanwhile, for columns 2, 3 and 4, pH value drops were 6,9 to 3,3, 7,2 to 3,9, and 7,5 to 4,5, respectively, and these drops took place during two days time period (without feeding in between), However, during the next two feeding cycles (on day 48 and day 50), all columns behaved in a more similar manner and pH dropped below 4,5 within two days time period (without feeding in between), But the initial (just after feeding) pH values started to increase beyond the previously intended 6,0 and 7,0 limits and ascend towards 7,5 for most of the reactors. Thus on day 52, it was decided to reduce the feed rates back to 20 and 30 mL/day and to observe the recovery of the reactors to early conditions. This phase continued for another 14 days and the detailed pH measurements made during a single feeding cycle (days 68 - 69) were illustrated in Figure 3, It is evident that these pH curves correspond well with the curves shown in Figure 2b except for the behavior of column 3, It is concluded that the reactor column 3 has failed in its activity at this stage, However its almost parallel reactor column 4 had not failed in a similar way, When searching for an explanation it was seen from pH data (not shown here) that until the day 63 both columns 3 and 4 behaved in a parallel manner, After feeding on day 63, the initial pH values were 7.4 in both the columns, but during the next day column 4 dropped to pH of 4,6 meanwhile column 3 dropped only to 5,6, After this, the column 3 never recovered and consecutive feedings led to higher and higher initial (after feed) pH values until a complete failure occurred. Figure 4 illustrates the behavior of column 3 during this time period, As a recovery measure, on day 67 column 3 was not fed for one cycle which resulted in positive signs of recovery as seen in Figure 4. After feeding on day 68, the pH of column 3 returned to a lower value of 6. 7 compared to the value of 7,7 on day 67, Nevertheless, this series of experiments was terminated on day 69.
The exact reason for the sudden loss of nitrification in column 3 on day 63 was not clear but could have caused by the loss of aeration for a certain period, However the complete failure coul d have been avoided if the feeding on next cycle was stopped, Feed accumulation can lea d to increased amounts of free ammonia (NHe3) and even at low concentrations like 0, 1
mg/L, free ammonia can inhibit nitrifying organisms [5], However this is a clear example of the nature ofebioreactor failures commonly found in practice and it emphasizes the importance of detecting the early signs of failures by simple measurement techniques (like pH) and the necessity of taking direct corrective measures quickly as possible to avoid complete system failures on course, :I: Cl, 5 7.5 6.5 10 15 20 25 63 64 65 66 67 68
Time after feeding (hrs) Time (days)
Figure 3, Detailed pH measurements for a Figure 4, Progressive failure of reactor
single feeding cycle (days 68- 69). column 3 (from day 63 to day 69).
3.2 Nitrification during a single cycle
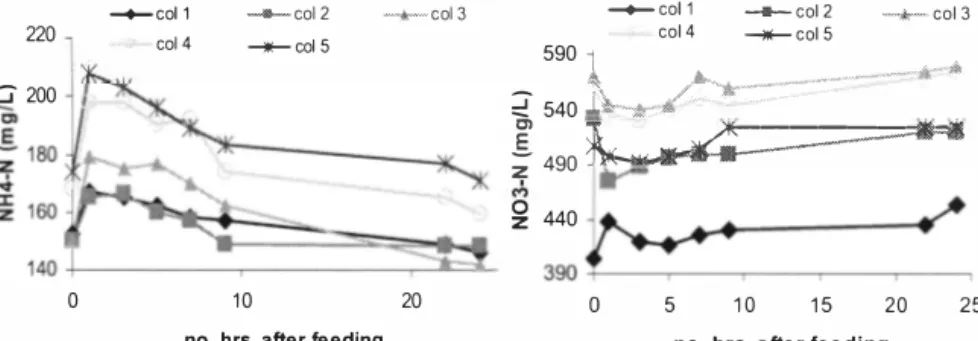
Figure 5a and Figure 5b show the variation of NH4-N and N03-N concentrations (in mg/L) respectively in reactor columns during a single feeding cycle (days 33 - 34), Greater than 75% conversion of ammonical nitrogen to nitrate nitrogen is observed in most of the time, But significant ammonia losses are also observed in some columns ( 24 % in column I and 2 7 % in column 5) and can be linked to the assimilation into microbial cells and stripping out as NH3 at the higher pH conditions prevailing in the early phase of the cycle, Pambrun et al. (200e7) [9] observed that ammonia loss due to combined effect of assimilation and stripping could be as high as IOe- 20 %, Instant ammonia stripping was observed also by Yamamoto et al. ( 200 6) [5] while experimenting on nitrification of anaerobically digested swine wastewater, They further reported that nitrification conditions were restored to a greater
degree by lowering the pH from 9.0 to below 7.5.
As should be expected, the columns fed 30 ml per day (3, 4 and 5) shows higher nitrate concentrations compared to the columns fed 20 ml per day (I and 2), (Figure 5b), The columns fed pre-sedimented digestate had lower nitrate accumulation than the columns fed unsedimented digestate (I and 5). For example, column 5 had significantly lower nitrate content than columns 3 and 4 (which are parallel to each other) fed the same amount of unsedimented digestate, Comparison of columns I and 2 further confirms this observation,
69
-
�
..
It is plausible that suspended solids (SS) may release extra NH4-N during the process leading to higher NO3-N levels, This may as well explain the NH4-N and NO3-N imbalance observed in columns 2 and 4, where a higher amount of NO3-N has resulted than the measured NH4-N decrease (see Figures 5a and 5b). This can happen when SS release additional NH4-N upon the depletion of NH4-N concentration in the solution phase. Note that, only the solution phase concentrations were determined during analysis. It was observed by [ 1 OJ that large amounts of NH4-N can be present in the solid phase of sludge. The mineralization of bound nitrogen in the solids was also confirmed in analyses made during this study. The portion of plant available nitrogen in the digestate increased after nitrification (data not shown).
-+- col 1 --- col 2 ...,.._ col 3 -- col 1 -- col 2 --.- col 3
220 col 4 -- col 5 col 4 -- col 5
5 0 9 :::; 200
�
::::! 540k
·�!
4 0�;...t,,-111r-ll�::===========-=-·
9 � 440 0 1 0 20 0 5 1 0 1 5 20 25no. hrs, after feeding no. hrs, afte r fee d i ng
Figure 5a. NHrN reduction during a Figure 5b. NOrN increase during the
single feeding cycle (days 33 -34). same feeding cycle (days 33 -34).
The amount of nitrogen present as nitrite (NO2 -N) was measured and found to be low (below 10 mg/L). Since nitrite is an intermediate product, it will be consumed and converted rapidly to nitrate (NO3 .) unless special provisions are made to inundate the nitrite oxidizing organisms via low sludge retention time, low dissolved oxygen or high level of free NH3 inhibition. Nitrite oxidizing organisms have a lower yield and lower oxygen uptake compared to the ammonia oxidizing organisms [2]. Conditions to favor nitrite oxidation were promoted here and dissolved oxygen levels in the reactor columns were measured to be high all the time with values exceeding 8.0 mg/L (at the temperature of 25°
C).
COD (soluble) measurements were also made as an additional indicator of the biological activity. In the majority of the reactors, a temporary increase of soluble COD during the early phase of the feeding cycles was observed. It is possible that this can be attributed to the degradation of particulate COD [6]. However, the lack of homogeneity of reactor fluid at the beginning of the feeding may also have caused this behavior. The overall reduction of soluble COD during the cycle indicated that there was a reasonable level of heterotrophic bacterial activity in addition to the autotrophes, This could have helped to breakdown the recalcitrant compounds surviving the anaerobic digestion. High COD (soluble) value of 3260 mg/L observed in the undiluted digestate ( Table 1) confirms the presence of such anaerobic defiant
compounds. The differences in COD variation for the five columns were not especially perceptible but apparently in accordance with the feeding volumes.
,: 45
45 30
Columns 3, 4 and 5 which were fed with 30 ml of digestate per day indicated higher COD values compared to the columns ( I and 2) fed with 20 ml per day,
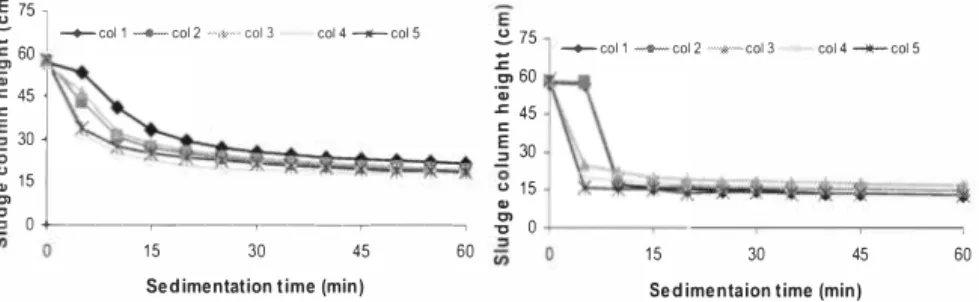
3.3 Sedimentation quality
Sedimentation effectiveness of the sludge in different reactor columns was examined by carrying out simple sedimentation tests prior to the start up and also at the end of the 32 days long steady feeding phase experiment (sedimentation tests were carried out on day 11 and day 44 (see Figures 6a and 6b). Generally, it is clear that a significant improvement of sedimentation quality of the reactor mixed liquor has occurred with the establishment of an efficient nitrification process. The anaerobic digestate had very poor sedimentation qualities. Even after centrifugation at 9000 rpm for 15 minutes, a clear liquid phase was not obtained (the same dark color as the original digestate remained). Filtration of the supernatant (resulting from centrifugation) through a OAS µm filter, however, produced a filtrate with a yellowish color. This indicates that the digestate contains a significant amount of colloidal solids which cannot be easily settled, However the nitrified mixed liquor from reactor columns produced a clear phase with the same yellowish color as obtained by filtering the original digestate through OAS µm filters, just by allowing it to settle for 15 minutes. This improvement of effluent quality by accelerated sedimentation (hence enhanced clarity) after nitrification can play a major role in producing a commercially acceptable liquid fertilizer. The effect of pre-sedimentation of the digestate seems to be marginal on the final sedimentation characteristics of the effluent, The sedimentation rates of the all five columns at the end of the 32 days duration are pretty similar in practical terms (Figure 6b). However it does show a bit slower sedimentation rate in the columns I and 2 at the beginning of the sedimentation test, This difference may be related to the hydraulic retention time (HRT) of the reactors. Columns I and 2 were operated with a 50 days HRT (20 ml/day feed rate) while columns 3, 4 and 5 were operated with a HRT of 33 days (30 ml/day feeding). Thus, after 32 days experimentation, columns I and 2 still virtually carries 36% of its initial mixed liquor (inoculated) while the other three columns have almost rejuvenated their reactor contents with feed digestate, Note that a part of the inoculum for this study was taken from a waste treatment facility in an oil refinery and hence oily substances present with sludge (even in minor quantities) may reduce the sedimentation rate, The slower sedimentation observed at the beginning (Figure 6a) may also have caused partly due to this fact
e
15::-
l
--+- col 1 -lf- col 2 =,i� col 3 col 4 -M- col 5 � 75--+- col 1 ,....__ col 2 ~.,w,w, col 3 col 4 -+it-- col 5 ,: 60 � 60 ·.; C: � 1 5 C)
"'
!
:,:1
0 +----�--�---�---� ] 30 " 1 5..
tn ,::, 0 1 5 30 60 1 5 45 60 Sedimentation time (min) Sedimentaion time (min)Figure 6a. Sedimentation tests carried out on Figure 6b, Sedimentation tests carried out
day 1 1. on day 44.
[5]
4 CONCLUSIONS
Nitrification of digestates from anaerobic digesters operating on source separated municipal organic wastes containing high amounts of ammonical nitrogen ( -1 700 mg/L) can be accomplished successefully without addition of extra bu ffer capacitye. Nitrification of such digestates would lead to a stable, aesthetically improved ( free from particulates and strong odors) liquid N-fertilizere. The process should be operated at pH levels below neutral to avoid ammonia stripping, a condition that can be obtained by proper feeding schemese. However the extent of nitrification can be limited by the alkalinity and also by the ammonium content in the feede.
It is advantageous to conduct the nitrification without pretreatment for removing the particulate fraction of the digestate, as solids can contribute additional NHe4-N and buffer capacitye. Significantly improved sedimentation characteristics are observed with the nitrified effluent compared to the anaerobic digestatee.
However it is believed that further observations must be done in pilot scale before planning a commercial scale production scheme based on this concep t Moreover, the real field compatibility of the intended fertilizer product must be confiem,ed by conducting a series of plant growth testse.
ACKNOWLEDGEMeENTS
The authors wish to express their gratitude to the staeff members of Telemark University College and Bio- Tek A S, for their support contributed at diefferent stages of this studye. A special thank goes to Mrse. Hildegunn H . Haugen, Laboratory Engineer at Telemark University College for her generous assistance provided during experimentinge. Fellow researcher Carlos R 0ed shall also be mentioned here for valuable comments o ffered at several occasionse.
REFERENCES
[IJ Fokes, J. ( 200 7)e. Nitrogen balance for the urban food metabolism ofeToranto, Canadae. Resources, Conserv Recycl . Article in Press , Doie:10 , IO 1 6/j ,resconrec .200 7 .0 2 .003 . (2 ) Bernet, N ., Delgenes, N., Akunna, J. C ., Delgenes, J. P ., Moletta, R . ( 2000) . Combined
anaerobic aerobic S BR for the treatment of piggery wastewatere. Water Research , Vole. 34, Noe. 2, pp , 61 1- 619 ,
[3 ) The Council of the European communities . (1991 ) . Council Directive of 21 May 1991, concerning urban waste water treatment (9 1/271 /EEC) .
Crab, R., Avnimelech Y., De foir dt, T ., Bossier P., Verstraete W . ( 200 7) , Nitrogen
[4]
removal te chniques in aquaculture for a susta inable production , (Rev iew Art icle)e. Aquaculture 2 70 ( 200 7), pp , 1- 14e.
Yamamoto, T ., Takaki, K., Koyama, T ,, Furu kawa, K. ( 200 6) . Novel partial n itr itat ion treatment for anaerobeic digesteion liquor of sweine wastewater useing sweim bed technology . J. Bioscience and Bioengineering, vol . 10 2, Noe. 6, ppe. 49 7-503 .
Luostarinen, S ., Luste, S ., Valentin, L ., Rintala, J. ( 200 6) . Nitrogen removal from on (6 )
site treated anaerobic effluents using inteennittently aerated moving bed biofilm reactors at low temperatures . Water Research 40 ( 200 6), ppe. 1 60 7- 1 615e.
[8] Metcalf and Eddy. (2003). Wastewater Engineering, Treatment and Reuse. Tata McGrow-Hill publishing company. 4th
Edition, 2003.
[9] Pambrun, V., Paul, E., Sperandio, M. (2007). Control and modeling of partial nitrification of effluents with high ammonia concentrations in sequencing batch reactor. Chem. Eng. and Processing, Article in Press.
(10] Meknassi, Y. F., Tyagi, R. D., Narasiah, K. S. (2000). Simultaneous sewage sludge digestion and metal leaching: effect of aeration. Process Biochemistry 36 (2000), pp. 263-273,