ACTINIDE-AMINOPOLYCARBOXYLATE COMPLEXATION THERMODYNAMICS: AMERICIUM, BERKELIUM, CALIFORNIUM, AND EINSTEINIUM
by Matthew Urban
Copyright by Matthew Urban 2017 All Rights Reserved
ii
A thesis submitted to the Faculty and the Board of Trustees of the Colorado School of Mines in partial fulfillment of the requirements for the degree of Master of Science (Nuclear Engineering). Golden, Colorado Date _____________________ Signed: _______________________ Matthew Urban Signed: _______________________ Dr. Jenifer C. Shafer Thesis Advisor Signed: _______________________ Dr. Mark Deinert Committee Member Golden, Colorado Date _____________________ Signed: _______________________ Dr. Mark Jensen Program Director Nuclear Science and Engineering Department
iii ABSTRACT
Previous experiments revealed evidence for modestly selective interactions, encouraged by orbital degeneracy driven covalency, between berkelium and curium using the aromatic aminopolycarboxylate dipicolinic acid. To further probe the ability for the heaviest available actinides to participate in orbital degeneracy driven covalent interactions, solvent extraction competition investigations were completed with the late actinides americium, berkelium, californium, and einsteinium. These studies were completed with aliphatic
aminopolycarboxylates (nitrilotriacetic acid, 2-hydroxyethyl ethylenediaminetriacetic acid, trans-1,2-cyclohexanediaminetetraacetic acid, and diethylenetriaminepentaacetic acid). The stability constants and thermodynamic parameters derived from these studies may provide some
indication of covalency in heavy actinide-aliphatic amine complexation chemistry. The stability constants derived for all metal-ligand complexes in this study were compared to lanthanide stability constants of the same aminopolycarboxylates (APCs) in linear free energy relationships to address, in part, whether a difference in selectivity exists between the late actinides and their lanthanide counterparts. Californium and einsteinium displayed a 2% difference in selectivity from europium and gadolinium, respectively, in absolute terms. Little evidence was obtained that shows intra-actinide selectivity between the aliphatic amines and the trivalent actinides.
iv
TABLE OF CONTENTS
ABSTRACT ... iii
TABLE OF CONTENTS ... iv
LIST OF FIGURES ... vii
LIST OF TABLES ... xiv
LIST OF SYMBOLS ... xxii
ACKNOWLEDGEMENTS ... xxiii Chapter 1 INTRODUCTION ... 1 1.1 Executive Summary ... 1 1.2 Motivation ... 2 1.3 Thesis Organization ... 2 Chapter 2 BACKGROUND ... 4
2.1 The Nuclear Fuel Cycle ... 4
2.2 Overview of actinide covalency ... 9
2.3 Recent findings ... 13
2.4 Hypothesis... 15
2.5 Project Specific Reagents ... 16
2.5.1 Nitrilotriacetic acid (NTA) ... 16
2.5.2 2-Hydroxyethyl Ethylenediaminetriacetic acid (HEDTA) ... 17
2.5.3 Trans-1,2-cyclohexanediaminetetraacetic Acid (CDTA) ... 18
2.5.4 Diethylenetriaminepentaacetic acid (DTPA) ... 19
2.5.5 HDEHP Organic Cation Exchange Extractant ... 19
Chapter 3 EXPERIMENTAL CONDITIONS ... 21
3.1 Chemicals ... 21
3.2 Potentiometry ... 22
3.3 Extraction Studies ... 22
3.4 APC Distribution Studies ... 25
v
4.1 Extraction Equilibria ... 28
4.1.1 Extraction Equilibria Results ... 29
4.1.2 Extraction equilibria thermodynamics ... 33
4.1.3 Extraction thermodynamic results ... 37
4.2 Competition Studies ... 37
4.3 NTA Complexation Studies ... 39
4.3.1 NTA-Am Studies ... 39
4.2.2 Bk-NTA Studies... 41
4.2.3 Californium-NTA Studies ... 43
4.2.4 Einsteinium-NTA Studies ... 45
4.4 HEDTA Competition Studies ... 47
4.4.1 Americium-HEDTA ... 47
4.4.2 Bk-HEDTA ... 49
4.4.3 Cf-HEDTA ... 50
4.4.4 Es-HEDTA ... 51
4.5 CDTA Competition Studies ... 52
4.5.1 Bk-CDTA ... 52
4.5.2 Cf-CDTA ... 54
4.5.3 Es-CDTA ... 55
4.6 DTPA Complexation Studies ... 56
4.6.1 Bk-DTPA ... 57 4.6.2 Cf-DTPA ... 59 4.6.3 Es-DTPA ... 61 Chapter 5 DISCUSSION ... 63 5.1 NTA ... 63 5.2 HEDTA ... 66
vi
5.3 CDTA ... 69
5.4 DTPA ... 71
5.5 Comparison to Lanthanides ... 75
Chapter 7 FUTURE WORK ... 85
REFERENCES ... 87
Appendix A INDIVIDUAL VAN’T HOFF PLOTS ... 90
Appendix B ACID DISSOCIATION CONSTANTS AND STABILITY CONSTANTS ... 92
Appendix C EXAMPLE STABILITY CONSTANTS DETERMINATION ... 95
Appendix D RAW DATA ... 98
D. 1 Americium-NTA ... 98 D.2 Americium-HEDTA... 102 D.3 Berkelium-NTA ... 107 D.4 Berkelium-HEDTA ... 112 D.5 Berkelium-CDTA... 117 D.6 Berkelium-DTPA ... 122 D.7 Californium-NTA... 138 D.8 Californium-HEDTA ... 143 D.9 Californium-CDTA ... 148 D.10 Californium-DTPA ... 153 D.11 Einsteinium-NTA ... 169 D.12 Einsteinium-HEDTA ... 174 D.13 Einsteinium-CDTA ... 179 D.14 Einsteinium-DTPA... 184
vii LIST OF FIGURES
Figure 2.1: The Nuclear Fuel Cycle (IAEA, 2016) ... 4
Figure 2.2: Weight percent of transuranic isotopes produced in MOX fuel as a function of time in a thermal spectrum reactor.. ... 9
Figure 2.3: Photoluminescence spectra of curium dipicolinate (top) and californium dipicolinate (bottom). ... 15
Figure 2.4: Nitrilotriacetic Acid Molecular Structure... 16
Figure 2.5: 2-Hydroxyethyl Ethylenediaminetriacetic Acid Molecular Structure ... 17
Figure 2.6: Trans-1,2-cyclohexanediaminetetraacetic acid molecular structure ... 18
Figure 2.7: Diethylenetriaminepentaacetic acid molecular structure ... 19
Figure 2.8: Bis-2-ethylhexyl Phosphoric Acid Dimer Structure ... 20
Figure 4.1: Results of americium equilibrium extraction trials. ... 30
Figure 4.2: Results of berkelium equilibrium extraction trials, I = 0.5 M, pcH = 2.5. ... 31
Figure 4.3: Results of californium equilibrium extraction trials, I = 0.5 M, pcH = 2.5. ... 32
Figure 4.4: Results of einsteinium equilibrium extraction trials, I = 0.5 M, pcH = 2.5. ... 33
Figure 4.5: Van't Hoff analysis of extraction. ... 34
Figure 4.6: Am-NTA Van't Hoff plot (I = 0.5 M) ... 41
Figure 4.7: Bk-NTA Van’t Hoff analysis. 4.7a is the 1:1 species and 4.7b is the 1:2 species. .... 42
Figure 4.8: Cf-NTA Van't Hoff analysis plots.. ... 44
Figure 4.9: Es-NTA Van't Hoff Analysis, I = 0.5 M. ... 46
Figure 4.10: Am-HEDTA Van't Hoff analysis. I = 0.5 M. ... 48
Figure 4.11: Bk-HEDTA Van't Hoff Analysis, I = 0.5 M. ... 49
Figure 4.12: Cf-HEDTA Van't Hoff analysis I = 0.5 M. ... 50
Figure 4.13: Es-HEDTA Van't Hoff analysis I = 0.5 M. ... 52
viii
Figure 4.15: Cf-CDTA Van't Hoff analysis, I = 0.5 M. ... 54
Figure 4.16: Es-CDTA Van't Hoff analysis, I = 0.5 M. ... 56
Figure 5.1: Stability Constant Trends, An-NTA ... 63
Figure 5.2: Trend in enthalpy changes, An-NTA ... 64
Figure 5.3: Trends in entropy changes, An-NTA ... 64
Figure 5.4: Trends in Gibbs free energy changes, An-NTA ... 65
Figure 5.5: Comparison between (A) Am-NTA (left) and (B) Cf-NTA (right) ... 65
Figure 5.6: Trend in stability constants for An-HEDTA ... 66
Figure 5.7: Trend in enthalpy change for An-HEDTA ... 67
Figure 5.8: Trend in change in entropy for An-HEDTA ... 67
Figure 5.9: Trend in Gibbs free energy change for An-HEDTA ... 68
Figure 5.10: Stability constant trend for An-CDTA ... 69
Figure 5.11: Enthalpy change trend for An-CDTA ... 70
Figure 5.12: Trend in entropy change, An-CDTA ... 70
Figure 5.13: Trend in Gibbs free energy change, An-CDTA ... 71
Figure 5.14: Stability constant series trend, An-DTPA ... 72
Figure 5.15: Enthalpy change series trend, An-DTPA ... 72
Figure 5.16: Entropy change series trend, An-DTPA ... 73
Figure 5.17: Gibbs free energy series trend, An-DTPA ... 73
Figure 5.18: Comparison between einsteinium-DTPA (left) and californium-DTPA (right) ... 74
Figure 5.19: Comparisons between APC stability constants for actinides and lanthanides.. ... 76
Figure 5.20: Americium-neodymium linear free energy relationship. ... 77
ix
Figure 5.22: Californium-Europium linear free energy relationship ... 79
Figure 5.23: Einsteinium-gadolinium linear free energy relationship ... 80
Figure A.1: Americium extraction Van't Hoff plot ... 90
Figure A.2: Berkelium extraction Van't Hoff plot ... 90
Figure A.3: Californium extraction Van't Hoff plot ... 91
Figure A.4: Einsteinium extraction Van't Hoff plot ... 91
Figure C.1: Einsteinium-HEDTA best fit ... 96
Figure C.2: QTIplot output ... 97
Figure D.1: Fit of Am-NTA T = 15°C data ... 98
Figure D.2: Fit of Am-NTA T = 25°C data ... 99
Figure D.3: Fit of Am-NTA T = 35°C data ... 100
Figure D.4: Fit of Am-NTA T = 45°C data ... 101
Figure D.5: Fit of Am-NTA T = 55°C data ... 102
Figure D.6: Fit of Am-HEDTA T = 15°C data ... 103
Figure D.7: Fit of Am-HEDTA T = 25°C data ... 104
Figure D.8: Fit of T = 35°C data ... 105
Figure D.9: Fit of Am-HEDTA T = 45°C data ... 106
Figure D.10: Fit of Am-HEDTA T = 55°C data ... 107
Figure D.11: Fit of Bk-NTA T = 15°C data ... 108
Figure D.12: Fit of Bk-NTA T = 25°C data ... 109
Figure D.13: Fit of Bk-NTA T = 35°C data ... 110
Figure D.14: Fit of Bk-NTA T = 45°C data ... 111
x
Figure D.16: Fit of Bk-HEDTA T = 15°C data ... 113
Figure D.17: Fit of Bk-HEDTA T = 25°C data ... 114
Figure D.18: Fit of Bk-HEDTA T = 35°C data ... 115
Figure D.19: Fit of Bk-HEDTA T = 45°C data ... 116
Figure D.20: Fit of Bk-HEDTA T = 55°C data ... 117
Figure D.21: Fit of Bk-CDTA T = 25°C data ... 118
Figure D.22: Fit of Bk-CDTA T = 30°C data ... 119
Figure D.23: Fit of Bk-CDTA T = 35°C data ... 120
Figure D.24: Fit of Bk-CDTA T = 45°C data ... 121
Figure D.25: Fit of Bk-CDTA T = 55°C data ... 122
Figure D.26: Fit of Bk-DTPA T = 25°C pcH = 2.1 ... 123
Figure D.27: Fit of Bk-DTPA T = 25°C, pcH = 1.9 ... 124
Figure D.28: Fit of Bk-DTPA T = 25°C, pcH = 2.3 ... 125
Figure D.29: Fit of Bk-DTPA T = 25°C, pcH = 2.5 data ... 126
Figure D.30: Fit of Bk-DTPA T = 35°C, pcH = 2.1 data ... 127
Figure D.31: Fit of Bk-DTPA T = 35°C, pcH = 1.9 data. ... 128
Figure D.32: Fit of Bk-DTPA T = 35°C, pcH = 2.3 data. Last point omitted for fit. ... 129
Figure D.33: Fit of Bk-DTPA T = 35°C, pcH = 2.5 data. ... 130
Figure D.34: Fit of Bk-DTPA T = 45°C, pcH = 2.1 data ... 131
Figure D.35: Fit of Bk-DTPA T = 45°C, pcH = 1.9 data ... 132
Figure D.36: Fit of Bk-DTPA T = 45°C, pcH = 2.3 data. Last point omitted due to poor fit. ... 133
Figure D.37: Fit of Bk-DTPA T = 45°C, pcH = 2.5 data ... 134
xi
Figure D.39: Fit of Bk-DTPA T = 55°C, pcH = 1.9 data ... 136
Figure D.40: Fit of Bk-DTPA T = 55°C, pcH = 2.3 data ... 137
Figure D.41: Fit of Bk-DTPA T = 55°C, pcH = 2.5 data ... 138
Figure D.42: Fit of Cf-NTA, T = 15°C data ... 139
Figure D.43: Fit of Cf-NTA T = 25°C data ... 140
Figure D.44: Fit of Cf-NTA T = 35°C data ... 141
Figure D.45: Fit of Cf-NTA T = 45°C data ... 142
Figure D.46: Fit of Cf-NTA T = 55°C data ... 143
Figure D.47: Fit of Cf-HEDTA T = 15°C data ... 144
Figure D.48: Fit of Cf-HEDTA T = 25°C data ... 145
Figure D.49: Fit of Cf-HEDTA T = 35°C data ... 146
Figure D.50: Fit of Cf-HEDTA T = 45°C data ... 147
Figure D.51: Fit of Cf-HEDTA T = 55°C data ... 148
Figure D.52: Fit of Cf-CDTA T = 15°C data ... 149
Figure D.53: Fit of Cf-CDTA T = 25°C data ... 150
Figure D.54: Fit of Cf-CDTA T = 35°C data. Last point omitted for fit. ... 151
Figure D.55: Fit of Cf-CDTA T = 45°C data. Last point omitted for fit. ... 152
Figure D.56: Fit of Cf-CDTA T = 55°C data. Last point omitted for fit. ... 153
Figure D.57: Fit of Cf-DTPA T = 25°C, pcH = 2.5 data ... 154
Figure D.58: Fit of Cf-DTPA T = 25°C, pcH = 2.3 data ... 155
Figure D.59: Fit of Cf-DTPA T = 25°C, pcH = 2.1 data ... 156
Figure D.60: Fit of Cf-DTPA T = 25°C, pcH = 1.9 data ... 157
xii
Figure D.62: Fit of Cf-DTPA T = 35°C, pcH = 2.3 free ... 159
Figure D.63: Fit of Cf-DTPA T = 35°C, pcH = 2.1 data ... 160
Figure D.64: Fit of Cf-DTPA T = 35°C, pcH = 1.9 data ... 161
Figure D.65: Fit of Cf-DTPA T = 45°C, pcH = 2.5 data ... 162
Figure D.66: Fit of Cf-DTPA T = 45°C, pcH = 2.3 data ... 163
Figure D.67: Fit of Cf-DTPA T = 45°C, pcH = 2.1 data ... 164
Figure D.68: Fit of Cf-DTPA T = 45°C, pcH = 1.9 data ... 165
Figure D.69: Fit of Cf-DTPA T = 55°C, pcH = 2.5 data ... 166
Figure D.70: Fit of Cf-DTPA T = 55°C, pcH = 2.3 data ... 167
Figure D.71: Fit of Cf-DTPA T = 55°C, pcH = 2.1 data ... 168
Figure D.72: Fit of Cf-DTPA T = 55°C, pcH = 1.9 data ... 169
Figure D.73: Fit of Es-NTA T = 15°C data ... 170
Figure D.74: Fit of Es-NTA T = 25°C data ... 171
Figure D.75: Fit of Es-NTA T = 35°C data ... 172
Figure D.76: Fit of Es-NTA T = 45°C data ... 173
Figure D.77: Fit of Es-NTA T = 55°C data ... 174
Figure D.78: Fit of Es-HEDTA T = 15°C data ... 175
Figure D.79: Fit of Es-HEDTA T = 25°C data ... 176
Figure D.80: Fit of Es-HEDTA T = 35°C data ... 177
Figure D.81: Fit of Es-HEDTA T = 45°C data ... 178
Figure D.82: Fit of Es-HEDTA T = 55°C data ... 179
Figure D.83: Fit of Es-CDTA T = 15°C data.. ... 180
xiii
Figure D.85: Fit of Es-CDTA T = 35°C data. Last point omitted for fit. ... 182
Figure D.86: Fit of Es-CDTA T = 45°C data. Last point omitted for fit. ... 183
Figure D.87: Fit of Es-CDTA T = 55°C data. Last point omitted for fit. ... 184
Figure D.88: Fit of Es-DTPA T = 25°C, pcH = 2.3 data ... 185
Figure D.89: Fit of Es-DTPA T = 25°C, pcH = 2.1 data ... 186
Figure D.90: Fit of Es-DTPA T = 25°C, pcH = 1.9 data ... 187
Figure D.91: Fit of Es-STPA T = 35°C, pcH = 2.3 data ... 188
Figure D.92: Fit of Es-DTPA T = 35°C, pcH = 2.1 data ... 189
Figure D.93: Fit of Es-DTPA T = 35°C, pcH = 1.9 data ... 190
Figure D.94: Fit of Es-DTPA T = 45°C, pcH = 2.3 data ... 191
Figure D.95: Fit of Es-DTPA T = 45°C, pcH = 2.1 data ... 192
xiv LIST OF TABLES
Table 2.1: Change in Enthalpy Values for Trivalent Actinide-NTA Complex Formation ... 12
Table 2.2: Acid Dissociation Constants and Thermodynamic Information for NTA ... 17
Table 2.3: Acid Dissociation Constants and Thermodynamic Information for HEDTA ... 18
Table 2.4: Acid Dissociation Constants and Thermodynamic Information for CDTA ... 18
Table 2.5: Acid Dissociation Constants and Thermodynamic Information for DTPA ... 19
Table 3.1: HDEHP concentrations used in Kex determinations ... 23
Table 3.2: Radiotracer Kex Determination Contact Times ... 24
Table 3.3: Radiotracer Temperatures, and Contact Times ... 25
Table 3.4: APC Concentrations Used ... 26
Table 3.5: HDEHP concentrations used in APC competition studies ... 26
Table 3.6: DTPA pcH Concentration Conditions ... 27
Table 4.1: Americium HDEHP Extraction Constants I = 0.5 M.. ... 30
Table 4.2: Berkelium-HDEHP extraction constants, I = 0.5 M. ... 31
Table 4.3: Californium HDEHP extraction constants, I = 0.5 M. ... 32
Table 4.4: Einsteinium extraction constants ... 33
Table 4.5: Dr. Shafer's californium extraction constants ... 36
Table 4.6: Einsteinium extraction constants ... 36
Table 4.7: Dr. Shafer's einsteinum extraction constants. ... 36
Table 4.8: Consolidated extraction constants. ... 37
Table 4.9: Consolidated thermodynamic parameters of extraction.. ... 37
Table 4.10: Americium-NTA stability constants, evaluated for 1:1 and 1:2 species. ... 40
xv
Table 4.12: Thermodynamic parameters for Am-NTA I = 0.5 M ... 41
Table 4.13: Bk-NTA stability constants I = 0.5 M. ... 42
Table 4.14: Bk-NTA standard thermodynamic parameters, I = 0.5 M. ... 43
Table 4.15: Cf-NTA stability constants I = 0.5 M for 1:1 and 1:2 species. ... 43
Table 4.16: Cf-NTA thermodynamic parameters ... 45
Table 4.17: Es-NTA stability constants I = 0.5 M. ... 45
Table 4.18: Es-NTA thermodynamic parameters ... 46
Table 4.19: Am-HEDTA stability constants, I = 0.5 M. ... 48
Table 4.20: Am-HEDTA thermodynamic parameters. I = 0.5 M. ... 48
Table 4.21: Bk-HEDTA stability constants I = 0.5 M. ... 49
Table 4.22: Bk-HEDTA thermodynamic constants I = 0.5 M. ... 50
Table 4.23: Cf-HEDTA stability constants I = 0.5 M. ... 50
Table 4.24: Cf-HEDTA thermodynamic properties I = 0.5 M. ... 51
Table 4.25: Es-HEDTA stability constants I = 0.5 M. ... 51
Table 4.26: Es-HEDTA thermodynamic parameters, I = 0.5 M. ... 52
Table 4.27: Bk-CDTA stability constants I = 0.5 M... 53
Table 4.28: Bk-CDTA thermodynamic parameters ... 53
Table 4.29: Cf-CDTA stability constants I = 0.5 M. ... 54
Table 4.30: Cf-CDTA thermodynamic parameters, I = 0.5 M. ... 55
Table 4.31: Es-CDTA stability constants, I = 0.5 M. ... 55
Table 4.32: Es-CDTA thermodynamic parameters I = 0.5 M ... 56
Table 4.33: Bk-DTPA conditional stability constants, β1. ... 58
xvi
Table 4.35: Bk-DTPA thermodynamic parameters, I = 0.5 M. ... 59
Table 4.36: Cf-DTPA conditional stability constants, I = 0.5 M. ... 59
Table 4.37: Cf-DTPA stability constants, I = 0.5 M. ... 60
Table 4.38: Cf-DTPA thermodynamic parameters ... 60
Table 4.39: Es-DTPA conditional stability constants. ... 61
Table 4.40: Es-DTPA stability constants ... 61
Table 4.41: Es-DTPA thermodynamic parameters, I = 0.5 M. ... 61
Table 5.1: NTA thermodynamic constants obtained at T = 25°C and I = 0.5 M. ... 63
Table 5.2: HEDTA thermodynamic constants obtained at T = 25°C and I = 0.5 M. ... 66
Table 5.3: CDTA thermodynamic constants obtained at T = 25°C and I = 0.5 M. ... 69
Table 5.4: DTPA thermodynamic constants obtained at T = 25°C and I = 0.5 M. ... 71
Table 5.5: Actinide-lanthanide ionic radii comparison. ... 75
Table 5.6: Lanthanide stability constants, logarithmic form (Choppin, 1977) ... 76
Table B.1: NTA protonation constants used in calculations (Choppin, 1977) ... 92
Table B.2: NTA protonation thermodynamic constants (Choppin, 1977)... 92
Table B.3: HEDTA protonation constants used in calculations (Choppin, 1977) ... 92
Table B.4: HEDTA protonation thermodynamic constants (Choppin, 1977) ... 92
Table B.5: CDTA protonation constants used in calculations (Choppin, 1977) ... 93
Table B.6: CDTA protonation thermodynamic parameters (Choppin, 1977) ... 93
Table B.7: DTPA protonation constants (Choppin, 1977) ... 93
Table B.8: DTPA protonation thermodynamic constants (Choppin, 1977) ... 93
Table B.9: Lanthanide stability constants, I = 0.5 M (Choppin, 1977) ... 93
xvii
Table C.1: Einsteinium-HEDTA inputs, T = 25°C ... 95
Table D.1: Am-NTA T = 15°C Raw Data ... 98
Table D.2: Am-NTA T = 25°C Raw Data ... 99
Table D.3: Am-NTA T = 35°C Raw Data ... 99
Table D.4: Am-NTA T = 45°C Raw Data ... 100
Table D.5: Am-NTA T = 55°C Raw Data ... 101
Table D.6: Am-HEDTA T = 15°C Raw Data ... 102
Table D.7: Am-HEDTA T = 25°C Raw Data ... 103
Table D.8: Am-HEDTA T = 35°C Raw Data ... 104
Table D.9: Am-HEDTA T = 45°C Raw Data ... 105
Table D.10: Am-HEDTA T = 55°C Raw Data ... 106
Table D.11: Bk-NTA T = 15°C Raw Data ... 107
Table D.12: Bk-NTA T = 25°C Raw Data ... 108
Table D.13: Bk-NTA T = 35°C Raw Data ... 109
Table D.14: Bk-NTA T = 45°C Raw Data ... 110
Table D.15: Bk-NTA T = 55°C Raw Data ... 111
Table D.16: Bk-HEDTA T = 15°C Raw Data ... 112
Table D.17: Bk-HEDTA T = 25°C Raw Data ... 113
Table D.18: Bk-HEDTA T = 35°C Raw Data ... 114
Table D.19: Bk-HEDTA T = 45°C Raw Data ... 115
Table D.20: Bk-HEDTA T = 55°C Raw Data ... 116
Table D.21: Bk-CDTA T = 25°C Raw Data ... 117
xviii
Table D.23: Bk-CDTA T = 35ׄ°C Raw Data ... 119
Table D.24: Bk-CDTA T = 45°C Raw Data ... 120
Table D.25: Bk-CDTA T = 55°C Raw Data ... 121
Table D.26: Bk-DTPA T = 25°C pcH = 2.1 ... 122 Table D.27: Bk-DTPA T = 25°C pcH = 1.9 ... 123 Table D.28: Bk-DTPA T = 25°C pcH = 2.3 ... 124 Table D.29: Bk-DTPA T = 25°C pcH = 2.5 ... 125 Table D.30: Bk-DTPA T = 35°C pcH = 2.1 ... 126 Table D.31: Bk-DTPA T = 35°C pcH = 1.9 ... 127 Table D.32: Bk-DTPA T = 35°C pcH = 2.3 ... 128 Table D.33: Bk-DTPA T = 35°C pcH = 2.5 ... 129 Table D.34: Bk-DTPA T = 45°C pcH = 2.1 ... 130 Table D.35: Bk-DTPA T = 45°C pcH = 1.9 ... 131 Table D.36: Bk-DTPA T = 45°C pcH = 2.3 ... 132 Table D.37: Bk-DTPA T = 45°C pcH = 2.5 ... 133 Table D.38: Bk-DTPA T = 55°C pcH = 2.1 ... 134 Table D.39: Bk-DTPA T = 55°C pcH = 1.9 ... 135 Table D.40: Bk-DTPA T = 55°C pcH = 2.3 ... 136 Table D.41: Bk-DTPA T = 55° C pcH = 2.5 ... 137
Table D.42: Cf-NTA T = 15° C Raw Data ... 138
Table D.43: Cf-NTA T = 25° C Raw Data ... 139
Table D.44: Cf-NTA T = 35° C Raw Data ... 140
xix
Table D.46: Cf-NTA T = 55° C Raw Data ... 142
Table D.47: Cf-HEDTA T = 15° C Raw Data ... 143
Table D.48: Cf-HEDTA T = 25 ° C Raw Data ... 144
Table D.49: Cf-HEDTA T = 35° C Raw Data ... 145
Table D.50: Cf-HEDTA T = 45° C Raw Data ... 146
Table D.51: Cf-HEDTA T = 55° C Raw Data ... 147
Table D.52: Cf-CDTA T = 15° C Raw Data ... 148
Table D.53: Cf-CDTA T = 25° C Raw Data ... 149
Table D.54: T = 35° C Raw Data ... 150
Table D.55: Cf-CDTA T = 45° C Raw Data ... 151
Table D.56: Cf-CDTA T = 55° C Raw Data ... 152
Table D.57: Cf-DTPA T = 25° C pcH = 2.5 ... 153 Table D.58: Cf-DTPA T = 25° C pcH = 2.3 ... 154 Table D.59: Cf-DTPA T = 25° C pcH = 2.1 ... 155 Table D.60: Cf-DTPA T = 25° C pcH = 1.9 ... 156 Table D.61: Cf-DTPA T = 35° C pcH = 2.5 ... 157 Table D.62: Cf-DTPA T = 35° C pcH = 2.3 ... 158 Table D.63: Cf-DTPA T = 35° C pcH = 2.1 ... 159 Table D.64: Cf-DTPA T = 35° C pcH = 1.9 ... 160 Table D.65: Cf-DTPA T = 45° C pcH = 2.5 ... 161 Table D.66: Cf-DTPA T = 45° C pcH = 2.3 ... 162 Table D.67: Cf-DTPA T = 45° C pcH = 2.1 ... 163 Table D.68: Cf-DTPA T = 45° C pcH = 1.9 ... 164
xx
Table D.69: Cf-DTPA T = 55° C pcH = 2.5 ... 165
Table D.70: Cf-DTPA T = 55° C pcH = 2.3 ... 166
Table D.71: Cf-DTPA T = 55° C pcH = 2.1 ... 167
Table D.72: Cf-DTPA T = 55° C pcH = 1.9 ... 168
Table D.73: Es-NTA T = 15° C Raw Data ... 169
Table D.74: Es-NTA T = 25° C Raw Data ... 170
Table D.75: Es-NTA T = 35° C Raw Data ... 171
Table D.76: Es-NTA T = 45° C Raw Data ... 172
Table D.77: Es-NTA T = 55° C Raw Data ... 173
Table D.78: Es-HEDTA T = 15° C Raw Data ... 174
Table D.79: Es-HEDTA T = 25° C Raw Data ... 175
Table D.80: Es-HEDTA T = 35° C Raw Data ... 176
Table D.81: Es-HEDTA T = 45° C Raw Data ... 177
Table D.82: Es-HEDTA T = 55° C Raw Data ... 178
Table D.83: Es-CDTA T = 15° C Raw Data ... 179
Table D.84: Es-CDTA T = 25° C Raw Data ... 180
Table D.85: Es-CDTA T = 35° C Raw Data ... 181
Table D.86: Es-CDTA T = 45° C Raw Data ... 182
Table D.87: Es-CDTA T = 55° C Raw Data ... 183
Table D.88: Es-DTPA T = 25° C pcH = 2.3 ... 184
Table D.89: Es-DTPA T = 25° C pcH = 2.1 ... 185
Table D.90: Es-DTPA T = 25° C pcH = 1.9 ... 186
xxi Table D.92: Es-DTPA T = 35° C pcH = 2.1 ... 188 Table D.93: Es-DTPA T = 35° C pcH = 1.9 ... 189 Table D.94: Es-DTPA T = 45° C pcH = 2.3 ... 190 Table D.95: Es-DTPA T = 45° C pcH = 2.1 ... 191 Table D.96: Es-DTPA T = 45° C pcH = 1.9 ... 192
xxii LIST OF SYMBOLS
Stability constant………..β Standard deviation………σ
xxiii
ACKNOWLEDGEMENTS
I would like to thank Dr. Jenifer Shafer and the Colorado School of Mines Nuclear Science and Engineering program for accepting me into the masters of science program, the United States Army for allowing me to take the time to study and complete this thesis, and most importantly, my wife, Savanna, for supporting me throughout this research.
1 CHAPTER 1
INTRODUCTION
1.1 Executive Summary
Recent investigations into crystal structures of the trivalent actinides berkelium and californium and dipicolinic acid suggest covalent interactions between the aromatic amine and the metal ion (Albrecht-Schmitt, 2015, 2016). This result is surprising, in that the trivalent actinides were thought to only form ionic bonds. Few investigations were performed with the late trivalent actinides due to availability until now.
Solvent extractions were performed with bis-2-ethylhexyl phosphoric acid competing with several different aminopolycarboxylates (APCs) at different temperatures to find stability constants and thermodynamic parameters of the actinides-APC complexes. Stability constants and thermodynamic parameters were obtained between americium, berkelium, californium, and einsteinium and the aliphatic APCs nitrilotriacetic acid (NTA), 2-hydroxyethyl
ethylenediaminetriacetic acid (HEDTA), trans-1,2-cyclohexanediaminetetraacetic acid (CDTA), and diethylenetriaminepentaacetic acid (DTPA). No significant trends were observed, but 1:2 metal-ligand complexes were formed between NTA and californium or einsteinium, which was not observed between the other actinides. These results were compared to lanthanides with similar ionic radii as the studied actinides, and californium and einsteinium both displayed a 2% selectivity increase when compared to the baseline americium-neodymium linear free energy relationship, in absolute terms. However, all linear free energy relationships were statistically identical to the control system Am-Nd. No trends in selectivity were observed, therefore the aliphatic amines can be said to not show any significant orbital degeneracy driven covalent
2
interactions with the late actinides. Studies into the aromatic amines and the late actinides may show more covalent interactions.
1.2 Motivation
Recent work has suggested significant covalent interactions in californium compounds with borates and aromatic amino-polycarboxylates, but it is not obvious how the suggested covalency in in these systems will impact complexation thermodynamics or if covalent
interactions are available for the neighboring heavy actinides. Since differences in complexation thermodynamics between metals drive separations, understanding how bonding energetics change for actinides through the series would aid in the design of better separation schemes for californium-252 production, the advanced fuel cycle, and, potentially, decontamination and remediation of nuclear accidents involving mixed-oxide (MOX) fuel.
1.3 Thesis Organization
This thesis is divided into 7 chapters. Chapter 1 contains the executive summary and motivation of work. Chapter 2 contains the background overview, literature review, and
hypothesis of the work. Chapter 3 contains the procedures used in the work. Chapter 4 contains the results, and chapter 5 discusses those results. Chapter 6 concludes the work with a summary of findings and uses for the work conducted. Chapter 7 contains future work suggestions to further enhance our understanding of the actinide series and its rich chemistry.
Appendix A contains individual Van’t Hoff plots of the extraction and competition studies, and tables containing all stability constants of the metal-ligand reactions found during the experiments. Appendix B contains acid dissociation constants of the APCs used in this study, and comparison stability constants. Appendix C contains an example calculation used to
3
determine stability constants of actinide-APCs. Appendix D contains the raw data collected through experimental work, and fit plots of the data.
4 CHAPTER 2 BACKGROUND
2.1 The Nuclear Fuel Cycle
Nuclear power constitutes roughly 20% of the world’s 15 terrawatt electrical power production (Tsoulfanidis, 2013). The percentage of nuclear power that comprises a given countries energy portfolio varies from 1.5% in Iran to 80% in France (IAEA, 2016). All countries utilize a uranium-based fuel cycle, depicted in Figure 2.1 (Tsoulfanidis, 2013).
In this type of fuel cycle, the buildup of transuranics (neptunium, plutonium, americium, and curium) generates a potential long-term waste management issue since many of the uranium, plutonium and neptunium isotopes produced via neutron capture and beta decay during power production have half-lives between several thousand years to millions of years. An example of Figure 2.1: The Nuclear Fuel Cycle (IAEA, 2016)
5
transuranic production is provided in equation 1, where uranium-238 captures a thermal neutron and through a series of beta decays, transmutes into plutonium-239.
U + n → U→ − Nβ→ − Pu ( 1 )
Open, partially open or closed fuel cycles are possible options to manage used nuclear fuel (Tsoulfanidis, 2013). In an open fuel cycle, used nuclear fuel is recovered from a reactor and eventually buried in a geologic repository where the fuel cannot interact with the surface environment or groundwater movement for thousands to millions of years (Tsoulfanidis, 2013). In a partially open fuel cycle, plutonium present in used nuclear fuel is selectively recovered from uranium, other transuranics (neptunium, americium and curium), and fission products and fabricated into mixed-oxide (MOX) fuel (Tsoulfanidis, 2013). The composition of MOX fuel is nominally 95% depleted uranium and 5% plutonium-239 (Tsoulfanidis, 2013). Fully closing the fuel cycle includes recovering Pu, Np, Am and Cm for their transmutation to shorter lived isotopes in fast neutron spectrum reactors.
Currently, sufficient uranium geological reserves and sufficient amounts of mined uranium preclude closing or partially closing the fuel cycle in the United States. Because of these, and other political issues, the United States is operating under an open fuel cycle model. Open fuel cycles are inefficient regarding fuel utilization and engender long term waste
management issues. These long term waste management issues correspond to increased risk that radioactive material stored in permanent geological containment may leak from the intended barrier. Further, the United States does not have a working permanent repository for storing used nuclear fuel since the Yucca Mountain site was closed in 2009 (Zhang, 2016).
Consequently, used fuel currently sits in storage pools and dry casks at nuclear power plant sites, creating a risk of release from accidental or malicious actions. Since the closure of Yucca
6
Mountain, interest in a partially closed or fully closed nuclear fuel cycle has increased to manage used nuclear material from reactors.
Partially open fuel cycles provide the benefit of recycling plutonium produced during initial power production from uranium-based nuclear fuel. This is potentially attractive since only five percent of the available energy is recovered in an open fuel cycle (Tsoulfanidis, 2013). More energy can be produced by recovering plutonium generated in the reactor for production of MOX fuel. Additionally, the heavier plutonium isotopes produced (240Pu, 241Pu and 242Pu) during irradiation of MOX fuel are less attractive for weaponization since they have different half-lives than plutonium-239, potentially larger neutron capture cross sections, and spontaneous fission decays of the nuclides that complicate weapons production.
Several nations have already implemented a partially closed fuel cycle, including France and Japan (Tsoulfanidis, 2013). These nations reprocess used nuclear fuel using the Plutonium-Uranium Redox EXtraction (PUREX) process, a solvent extraction scheme developed to separate plutonium and uranium from used nuclear fuel for weapons development, illustrated generally in equation 2.
MX + βS̅̅̅ → MX S̅̅̅̅̅̅̅̅̅ ( 2 )
The metal salt MXn reacts with the solvating extractant βS̅̅̅ to pull the metal salt into the organic phase (Rousseau, 1987). In the PUREX process specifically, plutonium and uranium are
extracted from used nuclear fuel by extraction with tri-butyl phosphate dissolved in kerosene. Plutonium is selectively recovered from uranium in the organic phase by reducing plutonium to the less extractable trivalent state. Uranium is recovered from the organic phase by contacting with a dilute nitric acid aqueous phase. This is the most mature separation scheme currently in
7
use on an industrial scale. The PUREX process leaves behind fission products and minor actinide waste, with the minor actinides generating the majority of radiation after a few hundred years.
Another separation process created as an adjunct to PUREX is the Actinide-Lanthanide Separation Process, or ALSEP. This process takes trivalent lanthanide and actinide rich raffinate from the PUREX process, and attempts to separate the americium and curium from the
lanthanide fission products by solvent extraction (Brown et al., 2016). The organic phase consists of a neutral diglycolamide such as N,N,N’,N’-tetra(2-ethylhexyl)diglycolamide (T2EHDGA) and an acidic phosphorus based extractant such as 2-ethylhexylphosphonic acid (HDEHP), or mono-2-ethylhexyl ester acid (HEH[EHP]) in a hydrocarbon diluent. The aqueous phase consists of a soft donor complexant such as DTPA or HEDTA in slightly acidic media that strips the actinides out of the organic phase while leaving the lanthanides bound to the extractant in the organic phase.
Californium production requires separation of the heavy actinides from lanthanide fission products and target material. Purification schemes at Oak Ridge and Savannah River use the “Cleanex” and TRialkyl Amine Extraction (TRAMEX) processes to purify the Californium-252 isotope after irradiation (Osbourne-Lee & Alexander, 1995). TRAMEX solvent extraction separates the Americium, Curium, and Californium in the target from fission products using an HDEHP anion exchange extraction and keeping the fission products in the aqueous phase using 11 to 12 M lithium chloride. The “Cleanex” process is used to remove impurities from the target material using an HDEHP extraction, oxidation of molybdenum to the +4 state, and stripping of the transplutonium elements from the organic to the aqueous state. These two processes are batch processes, and require large amounts of lithium chloride that can corrode the structural materials of the tanks involved (King et al., 1980).
8
Scenarios exist where it may be advantageous to implement a closed fuel cycle, such as countries wishing to be self-sustaining, concerns over long term waste storage, far future colonies on outer planets, and eventual depletion of uranium mining resources. In a closed nuclear fuel cycle, used fuel is reprocessed into new fuel, waste fission products are disposed of in geologic storage or used, and elements such as neptunium, plutonium, and americium are used as fuel and transmuted in fast neutron spectrum reactors (Tsoulfanidis, 2013). While
transmutation of transuranics is a goal, an increase in heavy actinide production could exist relative to what occurs in an open or partially open fuel cycle. Depending on the design of a given reactor and fuel, modest amounts of the trivalent actinides americium, curium, berkelium, californium, and einsteinium could be generated, as seen in equations 3, 4, and 5, and Figure 2.2.
Pu→ , Pu→ − Am→ , Am→ − Cm ( 3 )
Pu→ , Pu→ − Am→ , Am→ − Cm→ , Cm→ − Bk→ − Cf ( 4 )
Cf→ , Cf→ − Es ( 5 )
The chemistry of these elements, particularly berkelium, californium, and einsteinium, are poorly understood. Since understanding the fundamental chemistry of the elements created in nuclear fuel encourages better understanding and management of the fuel cycle as a whole, interest exists in developing a more robust understanding of the heavy actinide chemistry.
9
2.2 Overview of actinide covalency
Lanthanides are almost always found in the trivalent oxidation state, with severe
conditions required to push them into different oxidation states. Early actinides can be found in many different oxidation states, but the trans-plutonium actinides (Am, Cm, Bk, Cf, Es) are almost always found in the trivalent state (again, requiring significant effort to remove them Figure 2.2: Weight percent of transuranic isotopes produced in MOX fuel as a function of time in a thermal spectrum reactor. As fuel is recycled continuously, production of these isotopes increases. These trace isotopes may cause problems in controlling a thermal reactor as many are either neutron absorbers or decay via spontaneous fission, releasing neutrons and affecting the neutron economy of the reactor (Choppin et al., 2001).
10
from the trivalent state). Lanthanides appear in used nuclear fuel as fission products, and trivalent actinides appear in the same fuel as activation and decay products. If efficient transmutation of the actinides in fast neutron spectrum reactors is sought, a selective group separation of the actinides from the lanthanide fission products is necessary due to neutron absorption by the lanthanide fission products. Separations of lanthanides and trans-plutonium actinides have proven difficult, since their oxidation states cannot be readily manipulated, ionic radii of the trivalent actinides are similar to those of the lanthanides, and their chemistry is comparable and largely ionic. Frequently, the perceived ability for the actinides to interact preferentially with soft donors (nitrogen, sulfur) is used to generate a separation between the trivalent actinides and the lanthanides. The selective interaction of actinides with soft-donor ligands is thought to stem from a limited ability for actinides to participate in covalent interactions or overlap of f-orbitals (Braley, 2013), but studies using the heavier trivalent actinides are limited.
Suggestions of covalent behavior in the trivalent Actinides stem from Glenn Seaborg’s work with americium and curium in the 1940s and 1950s, as he attempted to separate lanthanide fission products from americium and curium. He and Kenneth Street Jr. found that, after loading trivalent f-elements using 0.1 M hydrochloric acid on a DOWEX-50 resin column, americium and curium separated from the lanthanides more easily when eluting with highly concentrated hydrochloric acid than expected (Seaborg & Street, 1950). Seaborg and Street concluded the trivalent actinides formed weak covalent coordination complexes with chloride ions due to the difference in stability of the 4f and 5f orbitals, resulting in the 5f orbital electrons more easily affected by external influences (Seaborg et al., 1954). The trivalent 5f actinides are more spatially extended with respect to the 6d orbitals than the lanthanide 4f orbitals with respect to
11
the 5d orbitals. Seaborg and Street then suggested that the 5f orbitals can therefore participate in hybridized covalent bonding while the lanthanide 4f orbital, which is more deeply shielded than the 5f orbital, cannot (Seaborg & Street, 1950).
It has been proposed that actinides have a greater tendency to form covalent bonds since they bond more strongly to certain ligands than their electronic lanthanide analogues. Since the minor actinides and lanthanides have similar ionic radii (Braley, 2013), it has been proposed that the 5f orbital protrudes out further and is the reason for the increased covalent interaction of the actinides. The experimental evidence for the reason behind the covalent interactions is lacking, however, and other suggestions include the s orbitals as the cause of increased covalency in the actinides (Choppin, 2002), or the mixing of the 5f and 6d orbitals (Neidig et al, 2013).
Since this early work with the trivalent actinides and lanthanides, more experiments were completed throughout the 1950s and 1960s using soft-donor ligands in solvent extraction and ion exchange separations. Often, these researchers only assessed the stability constants for the given experiments and not the enthalpic or entropic contributions giving rise to these overriding stability constants. Further, experiments were conducted with vastly different ionic strengths, temperatures, and methods.
Throughout the latter half of the 20th century, researchers continued to study the trivalent actinides and their solution chemistry. Gregory Choppin studied the actinides and their solution chemistry most thoroughly, describing how the actinides interact in solution as hard acids and rarely interact with soft donors in the aqueous phase except for nitrogen bearing ligands, with oxygen donors such as aminopolycarboxylates (Choppin, 1982). Choppin concluded the enthalpic binding contribution potentially arising from nitrogen interactions with trivalent actinides and lanthanide were comparable (Choppin, 1982). Therefore, an enthalpic ‘covalency
12
signature’ for actinide interactions with aminopolycarboxylates was not observable (Choppin, 1982). There may be reasons to believe this study should be reassessed (vide infra).
Table 1 shows the enthalpy values previously gathered from Gregory Choppin through calorimetry and solvent extraction studies (Braley, 2013).
Table 2.1: Change in Enthalpy Values for Trivalent Actinide-NTA Complex Formation at 0.5 M Ionic Strength and 25°C [kJ/mol]. Parenthetical values indicate error amounts. (Braley, 2013)
APC Am³+ Cm³+ Cf³+ Es³+
Calorimetry Solvent Extraction Calorimetry Solvent Extraction Solvent Extraction Solvent Extraction IDA -4(1) -18(1) -14(1) NTA -13(1) -9(1) -11(2) -3(2) 0.8(2) 1.8(2) EDTA -24(1) -32(1) -29(1) -29(2) CDTA -10(1) -10(2) TMDTA -13(1) -13(1) DTPA -40(1) -16(2) -14(2)
The data in this table indicate poor agreement between enthalpic studies, due possibly to errors in interlab investigations and variance in differing techniques that propagate through the study. For certain systems, Choppin assessed the residual enthalpy of complexation, or the enthalpy arising just from nitrogen complexation from an APC with a given actinide. This was done by assuming the enthalpy arising from acetate-actinide interactions was a reasonable model for the oxygen-metal interactions that occur during metal-APC binding (Choppin & Schneider, 1970).
This assumption and data treatment have some inherent limitations. The acetate enthalpies were from data measured in 2.0 M ionic strength media, whereas the actinide-APC complexation enthalpies were completed in 6.60 M, 0.5 M, and 0.1 M acid media. It must be noted that there are serious errors associated in the 6.60 M data analysis, and therefore, no results from this study were used. Additionally, only the enthalpy for the 1:1 acetate-metal complex was
13
used to correct for multiple metal-oxygen interactions in the metal-APC complex. Presumably the metal-oxygen interactions would become less exothermic as subsequent oxygens are added to the metal complex. Finally, actinide-lanthanide comparisons were done between metal ions that had significantly different ionic radii and, consequently, charge density and reactivity. More fair comparisons could be completed by correcting these limitations.
2.3 Recent findings
More recent studies have concluded that these trivalent actinides do exhibit covalent bonding behavior, but now the degree and type of covalency is the question. Neidig, Clark, and Martin studied the types and degrees of covalency in the actinides and concluded that actinides may form covalent bonds by orbital overlap or near degeneracy (Neidig et al., 2013). The early actinides, with their rich redox chemistry and multiple valence states, show orbital overlap of the 5f and 6d orbitals, contributing to stronger covalent interactions (Neidig et al., 2013). The
trivalent actinides, however, exhibit metal-ligand bonding through “virtual 6d orbital interactions with filled ligand lone pairs” (Neidig et al., 2013). There is also a much larger than expected 5f orbital mixing into occupied metal-ligand bonding orbitals. This does not necessarily indicate a buildup of charge at the midpoint of the bond, but may indicate a near degeneracy. Also, a change from the 2p orbital of oxygen to the 3p orbital of soft donor ligands may contribute to the covalency of the bond (Neidig et al., 2013).
Borate and dipicolinic acid (DPA) systems have shown unexpected covalent interactions with trivalent californium (Albrecht-Schmitt, 2014), (Albrecht-Schmitt, 2015). The californium borate study found that californium was the only actinide borate to display substantial electronic property changes. These findings were used to suggest that a possible “break” in the actinide series may occur at californium. Since borates have a highly electron rich environment and have
14
minimal potential applications for used nuclear fuel separations, the same group then studied the californium dipicolinate system. Dipicolonic acid is an aminopolycarboxylate ligand that has acidic acid dissociation constants, an electron rich environment due to the aromatic ring attached to the amine group, and demonstrated selectivity for trivalent actinides over trivalent lanthanides. This second report confirmed a difference between the californium systems relative to the borate and dipicolinate systems containing curium. The Albrecht-Schmitt research group postulates that variation in chemical behavior starting at californium stems from the relative ease at which the californium ion can be reduced to the divalent state. Since the divalent state becomes more favorable with increasing actinide atomic number, this effect should become more pronounced with einsteinium, mendelevium, nobelium, and lawrencium. Figure 3 shows the absorption spectra of curium dipicolinate and californium dipicolinate (Albrecht-Schmitt, 2015).
While the broadened spectroscopic transitions and suppressed magnetic moments observed for californium are suggestive of actinide covalency, it is not obvious how covalency would impact the complexation thermodynamics. Examination of elements beyond curium might present differences in thermodynamic properties at californium and support Albrecht-Schmitt’s hypothesis of a break in the series. Further, Choppin’s actinide thermodynamics review
compares thermodynamic data obtained by different methods at different laboratories under different conditions, and these values obtained are in poor agreement (Choppin et al., 2006). A single lab performing these characterizations would be better able to compare thermodynamic data, since conditions would be standardized throughout the series of experiments. Since the available data is ambiguous regarding potentially different trans-actinide thermodynamic data starting at californium, we must fully examine the complexation behavior of the late actinides
15
and lanthanides to determine if there is a thermodynamic break in the behavior of the actinides at californium.
2.4 Hypothesis
If aliphatic amines are able to participate in significant covalent interactions with the heavier actinides, then significant differences should be observed in complexation
thermodynamics for the heavier actinides relative to the lanthanides and earlier trivalent actinides.
Figure 2.3: Photoluminescence spectra of curium dipicolinate (top) and californium dipicolinate (bottom). 420 nm visible light was used to excite the dipicolinate crystals, and while curium shows a slightly broadened peak relative to lanthanide dipicolinates, californium presents an unexpected broad peak, similar to d-block elements. (Albrecht-Schmitt, 2016)
16
2.5 Project Specific Reagents
This project used four different APCs to complex with the heavy actinides in the aqueous phase, and one organic extractant to complex with the heavy actinides in the organic phase. The aminopolycarboxylates nitrilotriacetic acid (NTA), 2-hydroxyethyl ethylenediaminetriacetic acid (HEDTA), trans-1,2-cyclohexanediaminetetraacetic acid (CDTA), and
diethylenetriaminepentaacetic acid (DTPA) have previously been studied as complexing agents useful in separations between actinides and lanthanides, with HEDTA and DTPA used in industrial scale processes (Fuger, 1958).
2.5.1 Nitrilotriacetic acid (NTA)
NTA is a simple tetradentate aminopolycarboxylic acid consisting of one tertiary nitrogen center with three acetic acid groups attached. It is an industrial chemical widely used in detergents to control metal ions in water, enhancing detergent effectiveness (Gousetis & Opgenorth, 2000). While NTA is an intrinsically stable molecule, NTA breaks down readily in the environment, forming environmentally friendly molecules (Gousetis & Opgenorth, 2000). The neutral form of NTA is practically insoluble in water, but may be dissolved under basic conditions, as the metal salt is soluble in water. Complexation reactions with trivalent metals, including lanthanides and
actinides, have been reported to be very favorable (Choppin et al., 2006). NTA may form up to Figure 2.4: Nitrilotriacetic Acid
17
four bonds with a trivalent metal. Table 2 lists the protonation constants, with the fully protonated constant omitted, as pH electrodes are usually limited to a pH of 2.
Table 2.2: Acid Dissociation Constants and Thermodynamic Information for NTA at Standard Conditions I = 0.5 M Ionic Strength and 25°C. (Choppin et al., 1977)
Protonated Ligand pKa ΔH° [KJ/mol]
H1NTA 9.570 -24.2
H2NTA 2.641 0
H3NTA 1.569 0
2.5.2 2-Hydroxyethyl Ethylenediaminetriacetic acid (HEDTA)
HEDTA is a pentadentate diamine with two acetic acid groups bonded to one nitrogen and one acetic acid group and one alcohol group bonded to the other nitrogen. HEDTA is similar in structure to EDTA, a common chelating agent. However, the substitution of an alcohol group allows for better solubility than EDTA. As with NTA, HEDTA complexes with both lanthanides and actinides, where the three acetate groups complex to the metal center. The actinides are thought to form stronger complexes with HEDTA due to the influence of the diamine. Protonation
constants are listed in Table 3, with the fourth constant omitted. Figure 2.5: 2-Hydroxyethyl Ethylenediaminetriacetic Acid Molecular Structure
18
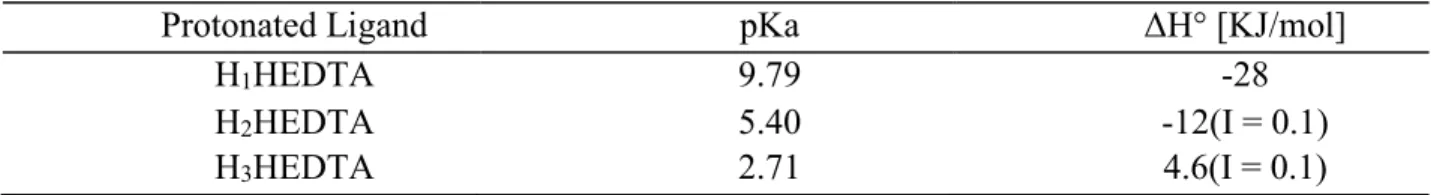
Table 2.3: Acid Dissociation Constants and Thermodynamic Information for HEDTA at Standard Conditions I = 0.5 M Ionic Strength and 25°C. (Choppin, 1977)
Protonated Ligand pKa ΔH° [KJ/mol]
H1HEDTA 9.79 -28
H2HEDTA 5.40 -12(I = 0.1)
H3HEDTA 2.71 4.6(I = 0.1)
2.5.3 Trans-1,2-cyclohexanediaminetetraacetic Acid (CDTA)
CDTA is a hexadentate APC ligand, with two amine groups attached to a cyclohexane ring and four carboxylic acid groups attached. The amine groups are attached to the cyclohexane
ring in the trans conformation. Essentially, this molecule was designed off of the backbone of EDTA, only adding a cyclohexane ring to provide a more rigid structure. Therefore, the ligand only bonds to metal ions in one conformation. Protonation constants for CDTA are listed in Table 2.4.
Table 2.4: Acid Dissociation Constants and Thermodynamic Information for CDTA at Standard Conditions I = 0.5 M Ionic Strength and 25°C (Choppin et al. 1977)
Protonated Ligand pKa ΔH° [KJ/mol]
H1CDTA 11.30 -38.8 H2CDTA 6.51 -10.7 H3CDTA 3.01 -1.4 H4CDTA 2.38 -1.7 H5CDTA 1.65 0 Figure 2.6: Trans-1,2-cyclohexanediaminetetraacetic acid molecular structure
19
2.5.4 Diethylenetriaminepentaacetic acid (DTPA)
DTPA is a potentially octadentate ligand, with three amine groups and five carboxylic acid groups. This ligand can potentially form eight bonds with a metal ion. At pHs of 2.0 to 3.0, deprotonated DTPA competes with a protonated species to form metal complexes.
DTPA was considered as a ligand to use in several reprocessing schemes to separate trivalent actinides from lanthanide fission products in used nuclear fuel. DTPA’s protonation constants are listed in Table 2.5.
Table 2.5: Acid Dissociation Constants and Thermodynamic Information for DTPA at Standard Conditions I = 0.5 M Ionic Strength and 25°C (Choppin, 1977)
Protonated Ligand pKa ΔH° [KJ/mol]
H1DTPA 9.90 -33 H2DTPA 8.32 -17 H3DTPA 4.10 -6.2 H4DTPA 2.70 -1 H5DTPA 2.10 2 H6DTPA 1.60 0
2.5.5 HDEHP Organic Cation Exchange Extractant
HDEHP is a dialkylphosphoric acid, soluble in organic media but insoluble in water and even less soluble in acidic aqueous media. It is a di-ester of phosphoric acid and 2-ethylhexanol.
Figure 2.7: Diethylenetriaminepentaacetic acid molecular structure
20
HDEHP has been investigated as a replacement for TBP in the PUREX process, and is used in laboratory scale actinide and lanthanide extractions. While TBP is a solvating extractant,
HDEHP extracts using a cation exchange mechanism, where the hydrogen ion exchanges for the desired metal on the extractant.
HDEHP is a self-associating dimer acid (Marcus & Kertes, 1969). Figure 8 shows the dimer structure. For the trivalent metals, three HDEHP dimers are required to bind to the metal to
extract it into the organic phase. HDEHP is a strong complexant that can compete with APCs, and shows consistent behavior over a wide range of temperatures, concentrations acid
concentrations, and is ideal for use in this study. Further, its extraction of trivalent metals is fast, minimizing extraction limitations.
Figure 2.8: Bis-2-ethylhexyl Phosphoric Acid Dimer Structure
21 CHAPTER 3
EXPERIMENTAL CONDITIONS OF COMPETITION STUDIES BETWEEN NTA, HEDTA, CDTA, AND DTPA AND HDEHP
For all extraction and distribution studies, common media and methods were used. A solvent extraction method consisting of HDEHP dissolved in n-dodecane contacted with aqueous 0.5 M Na/HClO4 media was selected as the separation model due to the predictability of the system and the relative ease of use.
3.1 Chemicals
HDEHP was obtained from Sigma Aldrich at 97% purity and purified using the method described by Zhenshui, Ying, Wanwu, and Xun (Zhenshui et al., 1995). Purity of the HDEHP was verified at >99% by NMR. n-Dodecane was obtained from Sigma Aldrich at >99% purity and used without further purification. NTA was obtained from TCI chemicals and dissolved without further purification after comparison of recrystallized NTA with unpurified NTA yielded no significant differences in metal distribution between the two solutions. HEDTA was obtained from Alfa Aesar, CDTA was obtained from Combi-Blocks, and DTPA was obtained from Fluka Analytical at >99% purity. All APCs were used without further purification. NaClO4 was
obtained from Sigma Aldrich at >98% purity, recrystallized thrice, and dissolved in nitrogen degassed 18 MΩ water.
Radiotracer stock solutions of americium-241 nitrate were obtained from Dr. Gregory Choppin’s laboratory through Dr. Thomas Albrecht-Schmitt and his research group. These stocks were diluted and dissolved in perchlorate media after heating and evaporation treatment to remove the nitrate ions. Radiotracer stock solutions of berkelium chloride were obtained from Oak Ridge National Laboratory. These stocks were directly dissolved in perchlorate media. A
22
radiotracer stock solution of californium-249 chloride was obtained from Thomas Albrecht-Schmitt’s laboratory and was diluted directly without any treatment to remove chloride ions1. Radiotracer stock solutions of einsteinium-253 and einsteinium-254 where obtained from the Oak Ridge National Laboratory High Flux Reactor and Chemical Separations Division.
3.2 Potentiometry
All potentiometric measurements were conducted on all APC reagents used in the study using a Thermo Scientific Orion Ross 8103BNUWP pH probe and compared using solutions of known pcH (pH corrected from hydrogen ion activities) to obtain corrected hydrogen ion concentrations. Potentiometric measurements were also conducted on final APC solutions and blank NaClO4 solutions to obtain pcHs used in data analysis. Hydrogen ion concentrations were also obtained using a Thermo Scientific Orion Ross 8103BNUWP pH probe of solutions
containing no radiotracer and radiotracer to obtain differences in pcH after adding radiotracers, and hydrogen ion concentrations were corrected for radiotracer additions.
3.3 Extraction Studies
Extractions of actinides using selected HDEHP concentrations were performed to obtain Kex values at different temperatures used throughout the distribution studies. HDEHP solutions were created in n-dodecane media either directly from purified HDEHP or diluted from a solution in n-dodecane containing high concentration HDEHP.
To pre-equilibrate these organic phases with sodium perchlorate ions, these HDEHP solutions were contacted with a blank (no radiotracer) aqueous phase of studied ionic strength
1 It is of note that significant berkelium-249 contamination of the californium-249 stock was discovered
after all experiments were conducted. It is unlikely that this contamination affected measurements, as counting statistics were gathered on a gamma counter, and Bk-249 has no appreciably gamma emission.
23
(0.5 M NaClO4) and constant pcH of 2.5 at constant temperature in a 1:1 ratio of organic to aqueous solution. These solutions were first allowed to reach the studied temperature in a water bath or a Labnet Temperature Controlled Shaker water bath for 15 °C determinations for fifteen minutes, mixed for approximately ten seconds on a VWR Standard Vortex Mixer, returned to a water bath for ten minutes for phase separation, centrifuged in a Beckton Dickinson Clay Adams Compact II centrifuge for approximately ten seconds to fully separate the phases, then returned to the water bath for another ten minutes. After this process, the pre-equilibrated organic phase was taken and placed into 2 mL sample vials, split into 800 μL phases into each sample vial. Aqueous phases were placed into waste. HDEHP concentrations used in Kex determinations are listed in Table 3.1. Note that the differences in HDEHP concentration are due to the increased extraction of the metal ions across the actinide series.
Table 3.1: HDEHP concentrations used in Kex determinations, listed in molarity for ease of use.
Radiotracer HDEHP Concentrations (mM)
Am-241 1, 2, 3, 5
Bk-249 0.5, 0.6, 0.7, 0.8, 0.9
Cf-249 0.1, 0.2, 0.3, 0.4, 0.5
Es-253/254 0.1, 0.2, 0.3, 0.4, 0.5
Radiotracer solutions consisting of a blank sodium perchlorate phase at constant pcH of 2.5 and constant ionic strength of either 0.1 M or 0.5 M were created by adding microliter amounts of prepared radiotracer. These aqueous phases were contacted with a 1:1 volume of n-dodecane and were pre-equilibrated in a similar manner to the HDEHP phases as described above. The radiotracer aqueous phase was split into three 800 μL samples and placed into the same 2 mL sample vials as the HDEHP solutions to create a 1:1 organic/aqueous experiment run in triplicate.
24
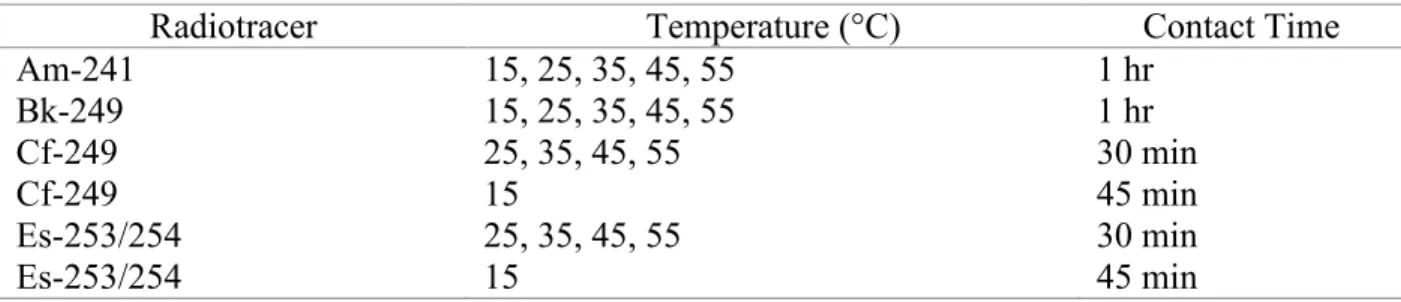
Kex determination experiments were conducted by varying the HDEHP concentration and temperature, with each experiment conducted in triplicate. Each sample vial was placed on a Labnet International Accutherm temperature controlled shaker2 for twenty minutes to allow the vials to reach the studied temperature. After twenty minutes, the shaker was started at 1500 rpm for a length of time described in Table 3.2.
Table 3.2: Radiotracer Kex Determination Contact Times
Radiotracer Temperature (°C) Contact Time
Am-241 15, 25, 35, 45, 55 1 hr Bk-249 15, 25, 35, 45, 55 1 hr Cf-249 25, 35, 45, 55 30 min Cf-249 15 45 min Es-253/254 25, 35, 45, 55 30 min Es-253/254 15 45 min
After the contact time is achieved, the vials were left at temperature for twenty minutes to allow bubbles to dissipate and phases to separate. Once separation is achieved, the vials were
centrifuged in a Beckton Dickinson Clay Adams Compact II centrifuge for approximately ten seconds to fully achieve phase separation. The vials were then returned to the Labnet shaker for ten to fifteen minutes to settle at temperature before sampling.
After this contact process, each vial was removed from the shaker, and 600 μL of the organic phase was sampled directly with a 200 μL pipette three times into either a gamma counting tube (Cf-249), or 4 mL of Ecoscint liquid scintillation cocktail (Am-241, Bk-249, and Es-253/254). This process may increase sampling error, but reduced the amount of radiotracer solution required per experiment. The remaining organic phase was then pipetted out of the
2 The Labnet temperature controlled shaker top directly from Labnet could not accommodate the 2 mL sample vials
used in the study. Therefore, a custom aluminum block was created by a drill press and bolted onto the shaker, with vial spaces in a 7x5 configuration. Each temperature used was measured using a thermocouple inserted into a 2 mL sample vial filled with DI water and allowed to equilibrate. Each space in the block was measured and variations in any temperature were determined to be only 0.1 °C.
25
reaction vial with a plastic fine tip pipette. The aqueous phase was then sampled, 600 μL bubbling through the top of the solution to the bottom and dispensing the aqueous phase into a new gamma tube or liquid scintillation vial.
All samples were then counted on either a Cobra gamma counter for Cf-249, a Canberra Liquid Scintillation Counter for Am-241 and Bk-249, or a Hidex Liquid Scintillation Counter for Es-253/254.
3.4 APC Distribution Studies
APC distribution studies were conducted in a similar manner as the extraction studies, with a few adjustments. The aqueous phase contained the appropriate APC during
pre-equilibration and extraction steps and only one HDEHP concentration was used for a given APC. An ionic strength of 0.5 M was maintained with NTA, HEDTA, CDTA, and DTPA throughout all experiments. All experiments were run in triplicate. Temperatures and contact times used are listed in Table 3.3. APC concentrations are listed in Table 3.4, and HDEHP concentrations are listed in Table 3.5.
Table 3.3: Radiotracer Temperatures, and Contact Times
Radiotracer APC Temperatures (°C) Contact Times
Am-241 NTA, HEDTA 15, 25, 35, 45, 55 2 hr
Bk-249 NTA, HEDTA CDTA, DTPA 15, 25, 35, 45, 55 25, 30, 35, 45, 55 2 hr 2 hr Cf-249 All 15, 25, 35, 45, 55 1 hr
Es-253/254 NTA, HEDTA, & CDTA DTPA
15, 25, 35, 45, 55 25, 35, 45
26 Table 3.4: APC Concentrations Used
Radiotracer NTA (mM) HEDTA (mM) CDTA (mM)
Am-241 0.05, 0.075, 0.1, 0.2, 0.3, 0.4, 0.5, 1 0.01, 0.025, 0.05, 0.075, 0.1, 0.25, 0.35, 0.5 not studied Bk-249 0.1, 0.25, 0.4, 0.5, 0.6, 0.75, 1, 1.1, 1.2, 1.5 0.05, 0.1, 0.3, 0.5, 0.7, 1, 2, 3, 4, 5 0.01, 0.03, 0.05, 0.1, 0.3, 0.5, 1 Cf-249 0.1, 0.5, 0.75, 1, 2, 3, 4, 5 0.1, 0.25, 0.5, 0.75, 1, 3, 5, 7 0.01, 0.03, 0.05, 0.07, 0.1, 0.5 Es-253/254 1, 2, 3, 4, 5 0.5, 0.75, 1, 3, 5, 7 0.03, 0.05, 0.07, 0.1, 0.2
Table 3.5: HDEHP concentrations used in APC competition studies
Radiotracer Ligand Study HDEHP Concentration (mM)
Am-241 NTA HEDTA 5.0 5.0 Bk-249 NTA HEDTA CDTA DTPA 4.25 5.0 20.0 20.0 Cf-249 NTA HEDTA CDTA DTPA 1.365 5.193 20.0 20.0 Es-253/254 NTA HEDTA CDTA DTPA 1.365 5.193 15.0 20.0
DTPA at pcHs studied is known to form two species, a protonated complex and unprotonated complex. Therefore, it was necessary to study DTPA concentrations at different pcHs to obtain thermodynamic parameters. DTPA pcH studies were conducted at 25°C, 35°C, 45°C, and 55°C to obtain thermodynamic information for Bk and Cf, and 25°C, 35°C, and 45°C for Es. Am-241 DTPA complexes were not studied. DTPA concentrations are listed in Table 3.6.
27 Table 3.6: DTPA pcH Concentration Conditions
Radiotracer pcH 1.9 (mM) pcH 2.1 (mM) pcH 2.3 (mM) pcH 2.5 (mM) Bk-249 0.01, 0.05, 0.1, 0.3, 0.5 0.1, 0.5, 1, 2, 3, 4, 5 0.01, 0.05, 0.1, 0.3, 0.5 0.01, 0.05, 0.1, 0.3, 0.5 Cf-249 0.1, 0.3, 0.5, 0.7, 1 0.1, 0.3, 0.5, 0.7, 1 0.1, 0.3, 0.5, 0.7, 1 0.1, 0.3, 0.5, 0.7, 1 Es-253/254 0.1, 0.3, 0.5, 0.7, 1 0.1, 0.3, 0.5, 0.7, 1 0.1, 0.3, 0.5, 0.7, 1
28 CHAPTER 4
RESULTS
4.1 Extraction Equilibria
The extraction of metals by the organic cation exchange molecule HDEHP is shown by the equation 6, where M is a trivalent metal ion.
M ++ HDEHP̅̅̅̅̅̅̅̅̅̅̅̅ → M ∙ HDEHP̅̅̅̅̅̅̅̅̅̅̅̅̅̅̅̅̅̅̅̅̅̅ + H+ ( 6 ) Equation 1 shows that one trivalent metal ion will complex with three HDEHP dimers. Each HDEHP dimer will exchange one hydrogen ion from the phosphoric acid into the aqueous phase. Therefore, the extraction constant of the reaction will be obtained by equation 7 (Heathman & Nash, 2012).
K x =[M ∙ HDEHP̅̅̅̅̅̅̅̅̅̅̅̅̅̅̅̅̅̅̅̅̅̅][H +] [M +] [HDEHP̅̅̅̅̅̅̅̅̅̅]
( 7 )
The concentration of trivalent metal bonded to the HDEHP in the numerator divided by the concentration of metal ion in the aqueous phase is known as the distribution of the metal, as shown in equation 8.
D =[M ∙ HDEHP̅̅̅̅̅̅̅̅̅̅̅̅̅̅̅̅̅̅̅̅̅̅][M +] ( 8 )
The distribution ratio makes solving for the extraction constant using a non-linear least squares method easier, and allows easier understanding of extraction behavior with differing conditions, such as temperature variations and the presence of aminopolycarboxylates in the aqueous phase.
Thermodynamic parameters may be deduced from a Van’t Hoff analysis. Inverse
temperature in Kelvin is plotted against the natural logarithm of the extraction constants to obtain a line. The slope of the trend line is the negative change in enthalpy divided by the universal gas
29
constant, and the intercept is the change in entropy divided by the universal gas constant, illustrated in equation 9.
ln K = −∆HRT +∆SR ( 9 )
The Gibbs free energy may be obtained from the standard enthalpy and entropy changes or the stability constant at T = 25°C via equation 10a or 10b. All Gibbs free energy changes were calculated using equation 10b due to lower error propagation unless otherwise noted.
∆G° = ∆H° − T∆S° (10a)
∆G° = −RTlnK (10b)
All error calculations are displayed as 1σ in tables and plots.
4.1.1 Extraction Equilibria Results
All extraction equilibria were expected to present exothermic behavior, or an inverse relationship between temperature and extraction constants. Plots of the log values of the HDEHP dimer concentration (x-axis) versus the log of the distribution coefficients (y-axis) should have slopes of around 3, indicating a cubic power dependence of HDEHP dimer concentration on distribution coefficient.
Americium extraction trials, depicted in Figure 4.1, yielded unusual results for the temperature trial of 25°C. The slope of T = 25°C is 2.49, while all other lines yield slopes closer to 3. It is possible that T = 25°C phases became contaminated during the sampling process, yielding incorrect distribution coefficients at certain data points. Since other temperature data sets yield predicted relationships, the T = 25°C was removed from further consideration and Kex values for this relationship were interpolated from thermodynamic results.
30
Figure 4.1: Results of americium equilibrium extraction trials, I = 0.5 M, pcH = 2.5, HDEHP in n-dodecane.
The distribution ratios, standard deviations, and HDEHP molal concentrations may be analyzed to determine the extraction coefficient for each temperature using a non-linear least-squares analysis tool like the QTIplot program. The program plots the non-linear data and uses equation 7 to determine the extraction constant based on the distribution ratios and HDEHP concentrations while assuming a constant hydrogen ion concentration. The results of this analysis are listed in Table 4.1.
Table 4.1: Americium HDEHP Extraction Constants I = 0.5 M. The T = 25°C data is extrapolated.
Temperature (°C) Kex Error
15 86 4 25 69 5 35 61 2 45 51 1 55 41 2 -1.5 -1 -0.5 0 0.5 1 -2.9 -2.8 -2.7 -2.6 -2.5 -2.4 -2.3 -2.2 log Do log[(HDEHP)2] 15 25 35 45 55
31
Berkelium extraction constants were assessed in a similar method to americium, with the extraction lines shown in Figure 10. All temperature lines had a slope of 2.5 or greater except the T = 25°C data set.
Figure 4.2: Results of berkelium equilibrium extraction trials, I = 0.5 M, pcH = 2.5.
The extraction constants for berkelium HDEHP are listed in Table 4.2. Under the same conditions as americium, berkelium extracts slightly more than americium, and has more temperature variability.
Table 4.2: Berkelium-HDEHP extraction constants, I = 0.5 M.
Temperature (°C) Kex Error
15 103 4
25 76 5
35 59 1
45 44 2
55 33.8 0.6
Californium extracts into the organic phase much stronger than either americium or berkelium. Extraction experimental results are shown in Figure 4.3. However, results from the
-0.8 -0.6 -0.4 -0.2 0 0.2 0.4 -3.2 -3.15 -3.1 -3.05 -3 -2.95 -2.9 -2.85 log Do log[(HDEHP)2] 15°C 25°C 35°C 45°C 55°C
32
non-linear least squares analysis (shown in Table 4.3) and the Van’t Hoff analysis yield overly large extraction constants results.
Figure 4.3: Results of californium equilibrium extraction trials, I = 0.5 M, pcH = 2.5.
Table 4.3: Californium HDEHP extraction constants, I = 0.5 M.
Temperature (°C) Kex Error
15 72,000 6,000
25 47,000 1,300
35 31,000 2,300
45 23,000 800
55 32,000 7,400
Based on the three previous elements, einsteinium was expected to extract better than californium. Figure 4.4 shows the results of the einsteinium extraction experiments.
-1.3 -0.8 -0.3 0.2 0.7 1.2 -4.05 -4 -3.95 -3.9 -3.85 -3.8 -3.75 -3.7 -3.65 -3.6 -3.55 log Do log[(HDEHP)2] 15 25 35 45 55