Digital Comprehensive Summaries of Uppsala Dissertations
from the Faculty of Pharmacy
270
Pharmacometric Approaches to
Improve Dose Individualization
Methods in Hemophilia A
Dissertation presented at Uppsala University to be publicly examined in B41, Biomedicinskt centrum, Husargatan 3, Wednesday, 29 May 2019 at 09:15 for the degree of Doctor of Philosophy (Faculty of Pharmacy). The examination will be conducted in English. Faculty examiner: Professor Ron Mathôt (University of Amsterdam).
Abstract
Abrantes, J. A. 2019. Pharmacometric Approaches to Improve Dose Individualization Methods in Hemophilia A. Digital Comprehensive Summaries of Uppsala Dissertations from the Faculty of Pharmacy 270. 70 pp. Uppsala: Acta Universitatis Upsaliensis.
ISBN 978-91-513-0631-5.
Hemophilia A is a bleeding disorder caused by the lack of functional coagulation factor VIII (FVIII). The overall aim of this thesis was to improve dose individualization of FVIII replacement therapy in hemophilia A using pharmacometric approaches.
A population pharmacokinetic (PK) model of FVIII activity following the administration of moroctocog alfa was developed based on data from a large heterogeneous cohort of moderate to severe hemophilia A patients. Body weight, age, neutralizing anti-FVIII inhibitors, race, and analytical assay were found to be significant predictors of FVIII activity PK. In addition, large inter-individual variability (IIV) and inter-occasion variability (IOV) was identified highlighting the need for dose individualization.
High magnitudes of IOV are known to impair model-based therapeutic drug monitoring. Using a population PK model of FVIII activity, several approaches to handle IOV in Bayesian forecasting of individual PK parameters were assessed across a wide range of features. Considering IOV in Bayesian forecasting, but ignoring IOV in dose calculation, led to the most precise individualized doses, in particular, when sparse data was used.
The dose-exposure-response relationship of FVIII replacement therapy remains unclear. A parametric repeated time-to-categorical event (RTTCE) model was developed to characterize the relationship between the dose of octocog alfa, plasma FVIII activity, bleeding frequency and severity, and covariates, using data from clinical trials. The bleeding hazard was found to decrease throughout time and to be affected by plasma FVIII activity and number of previous bleeds. Unexplained IIV in the bleeding hazard was found to be large.
Bayesian forecasting based on the RTTCE model was used to predict the future occurrence of bleeds, and to contrast the predicted outcome using individual i) PK, ii) bleeding, and iii) PK, bleeding and covariate information, from data collected in clinical trials. The results support that individual bleed information can inform the optimization of prophylactic dosing regimens in severe hemophilia A patients.
In summary, the pharmacometric approaches presented provide a valuable quantitative framework to improve dose individualization in hemophilia A. Furthermore, enhanced dosing has the potential to reduce bleeding frequency and to lower the high costs associated to treatment.
Keywords: Bayesian forecasting, coagulation factor VIII, dose adaptation, hemophilia/
haemophilia A, inter-occasion variability, NONMEM, pharmacodynamics, pharmacokinetics, pharmacometrics, therapeutic drug monitoring
João A. Abrantes, Department of Pharmaceutical Biosciences, Box 591, Uppsala University, SE-75124 Uppsala, Sweden.
© João A. Abrantes 2019 ISSN 1651-6192 ISBN 978-91-513-0631-5
Now this is not the end.
It is not even the beginning of the end.
But it is, perhaps, the end of the beginning.
Sir Winston Churchill
List of Papers
This thesis is based on the following papers, which are referred to in the text by their Roman numerals.
I Abrantes JA, Nielsen EI, Korth-Bradley J, Harnisch L, Jönsson S. (2017) Elucidation of Factor VIII Activity Pharmacokinetics: A Pooled Population Analysis in Patients With Hemophilia A Treated With Moroctocog Alfa. Clin Pharmacol Ther. 102(6):977-988.
II Abrantes JA, Jönsson S, Karlsson MO, Nielsen EI. (2018) Handling interoccasion variability in model-based dose individ-ualization using therapeutic drug monitoring data. Br J Clin Pharmacol. Epub ahead of print.
III Abrantes JA, Solms A, Garmann D, Nielsen EI, Jönsson S, Karlsson MO. Relationship between factor VIII activity, bleeds and individual characteristics in severe hemophilia A patients. Submitted.
IV Abrantes JA, Solms A, Garmann D, Nielsen EI, Jönsson S, Karlsson MO. Bayesian Forecasting Utilizing Bleeding Infor-mation to Support Dose Individualization of Factor VIII. Submit-ted.
List of Additional Papers
In addition to the appended papers, João A. Abrantes has been author of the publications listed below.
Oosten AW*, Abrantes JA*, Jönsson S, de Bruijn P, Kuip EJ, Falcão A, van der Rijt CC, Mathijssen RH. (2016) Treatment with subcutaneous and transdermal fentanyl: results from a population pharmacokinetic study in cancer patients. Eur J Clin Pharmacol., 72(4):459-67.
Oosten AW*, Abrantes JA*, Jönsson S, Matic M, van Schaik RHN, de Bruijn P, van der Rijt CCD, Mathijssen RHJ. (2017) A Prospective Pop-ulation Pharmacokinetic Study on Morphine Metabolism in Cancer Pa-tients. Clin Pharmacokinet., 56(7):733-746.
Contents
1 Introduction ... 11 1.1 Hemophilia A ... 11 1.1.1 A coagulation disorder ... 11 1.1.2 Diagnosis ... 12 1.1.3 Clinical manifestations ... 12 1.1.4 Treatment strategies ... 131.2 Factor VIII replacement therapy ... 13
1.2.1 Prevention and treatment strategies ... 13
1.2.2 Replacement products available ... 14
1.2.3 Pharmacokinetics of exogenous standard half-life FVIII ... 15
1.2.4 Quantification of plasma FVIII ... 16
1.2.5 Limitations of treatment ... 17
1.3 Pharmacometrics ... 17
1.3.1 Basic principles ... 17
1.3.2 Bayesian forecasting ... 18
1.4 Individualization of drug therapy ... 19
1.5 A posteriori dose individualization of FVIII replacement therapy . 20 1.5.1 Target FVIII activity ... 20
1.5.2 Bayesian prior models ... 20
1.5.3 Model-based TDM tools for FVIII dose individualization .... 20
2 Aims ... 21
3 Methods ... 22
3.1 Factor VIII replacement products ... 22
3.2 Clinical data ... 22
3.3 Model development and qualification ... 25
3.3.1 Population PK models ... 25
3.3.2 Repeated time-to-categorical event model ... 27
3.4 Parameter-covariate assessment ... 27
3.4.1 Missing covariate values ... 28
3.4.2 Unlikely clinical relevance ... 29
3.5 Model discrimination and evaluation ... 29
3.8 Comparison of sources of patient information to forecast bleeds ... 32
3.8.1 Bayesian forecasting of bleeds ... 32
3.8.2 Predictive performance assessment ... 34
3.9 Software ... 36
4 Results ... 37
4.1 Pharmacokinetic models for FVIII activity ... 37
4.1.1 Moroctocog alfa ... 37
4.1.2 Octocog alfa ... 41
4.2 Handling inter-occasion variability in model-based TDM ... 42
4.3 Repeated time-to-categorical event model for occurrence of bleeds and bleeding severity... 44
4.4 Comparison of sources of patient information to forecast bleeds ... 46
5 Discussion ... 49
6 Conclusions ... 54
7 Future perspectives ... 56
8 Acknowledgements... 57
Abbreviations
ABR annual bleeding rate
AUCPR area under the precision-recall curve
AUCROC area under the receiver operating characteristic curve
C concentration or FVIII activity
CI confidence interval
CL clearance
cm centimeter
COV covariate
CSA chromogenic substrate assay
CV coefficient of variation
d.f. degree of freedom
dL deciliter
DNA deoxyribonucleic acid
EBE empirical Bayes estimate
FIX coagulation factor IX
FN false negative
FP false positive
FPR false positive rate
FREM full random effects modeling
FVIII coagulation factor VIII
FX coagulation factor X
FXa activated coagulation factor X
h hour(s)
HT height
IIV inter-individual variability
IMP Monte Carlo importance sampling
IMPMAP Monte Carlo importance sampling assisted by mode a posteriori
INH inhibitor anti-coagulation factor VIII
IOV inter-occasion variability
IU international unit
J Youden’s J statistics
LEOPOLD long-term efficacy open-label program in severe hemophilia A disease
LLOQ lower limit of quantification
MAP maximum a posteriori
mL milliliter
N negative
OFV objective function value
OSA one-stage clotting assay
P positive
PD pharmacodynamics(s)
pdFVIII plasma-derived coagulation factor VIII
PE prediction error
PK pharmacokinetic(s)
PPV positive predictive value
PR precision-recall
PsN Perl-speaks-NONMEM
Q inter-compartmental clearance
r correlation coefficient
rFVIII recombinant coagulation factor VIII ROC receiver operating characteristic
RSE relative standard error
RTTCE repeated time-to-categorical event
RUV residual unexplained variability
SIR sampling importance resampling
STUD study
t time
TDM therapeutic drug monitoring
TN true negative
TNR true negative rate
TP true positive
TPR true positive rate
TVCL typical value of clearance
V1 central volume of distribution
V2 peripheral volume of distribution
VWF von Willebrand factor
WT body weight
α alpha, significance level
ε epsilon, residual
η eta, individual level random effect
θ theta, population fixed effect
1 Introduction
The treatment of hemophilia A has improved dramatically over the last 50 years. Since 1965, when the cryoprecipitate rich in coagulation factor VIII (FVIII) was found, the life expectancy of a patient with severe hemophilia A went from less than 20 years old to a practically normal life expectancy for a patient receiving prophylactic treatment. However, in 2019 this bleeding dis-order is still associated with a considerable clinical and economic burden. The foundation of the modern prophylactic treatment of severe hemophilia A, through the administration of FVIII replacement therapy, is extremely costly and involves the intravenous administration of a FVIII product 2 to 3 times a week. From an efficacy standpoint, there is considerable unexplained inter-individual variability (IIV) in the pharmacokinetics (PK) and bleeding re-sponse of these exogenous compounds, which make body weight dosing for the prevention of bleeds suboptimal. These and other constraints open the door to the optimization of dosing regimens of FVIII through individualization of therapy. This thesis focuses on the development of pharmacometric ap-proaches to improve dose individualization methods in hemophilia A.
1.1 Hemophilia A
1.1.1 A coagulation disorder
The hemostatic balance is a complex process that relies on the trade-off be-tween natural anticoagulant and procoagulant factors. Therefore, drug thera-pies that affect blood coagulation must be carefully administered since a de-viation from the delicate balance of coagulation factors can lead to thrombotic or hemorrhagic complications. The absence of a single protein among the more than 25 key proteins involved in the hemostatic network can lead to se-rious health complications such as internal bleeding, deterioration of the joints and muscle atrophy (1, 2).
One group of coagulation disorders is hemophilia. Hemophilia A is caused by a deficiency of coagulation FVIII, and hemophilia B by a deficiency of
coag-members (3). The lack of these coagulation factors results in a decreased and delayed generation of thrombin, which ultimately affects the formation of the blood clot. Hemophilia A has a global prevalence of approximately 1 in 5 000 male births and hemophilia B around 1 in 30 000 (2). The most common type of hemophilia, hemophilia A, is the focus of this thesis.
1.1.2 Diagnosis
The diagnosis of hemophilia A can be made right after birth, if the mother is a known carrier, or when bleeding symptoms occur (4). The clinical severity of patients with hemophilia A is very heterogeneous, however, in general the severity is inversely correlated with the endogenous levels of FVIII activity, i.e. the amount of functional plasma FVIII that an individual is able to produce (Table 1) (5).
Table 1. Relationship between the severity of hemophilia A and endogenous plasma FVIII activity.
Severity Endogenous plasma FVIII activity
Severe <1 IU/dL1
Moderate2 1-5 IU/dL
Mild 5-40 IU/dL
1<0.01 IU/mL or <1% of normal
2FVIII activity between 1-2 IU/dL is sometimes referred to as moderately severe.
About half of the diagnosed patients with hemophilia A have the severe form of the disease and suffer from spontaneous bleeds, which can occur into the muscles or joints (2). Patients with moderate hemophilia suffer from occa-sional spontaneous bleeds and prolonged bleeds with minor trauma or surgery. Patients with mild hemophilia A rarely suffer from spontaneous bleeds but may experience severe bleeds with major trauma or surgery.
1.1.3 Clinical manifestations
The clinical manifestations of hemophilia A involve bleeding. The bleeding risk varies substantially across patients and depends mainly on the severity of the disease, as mentioned previously. The first bleed in patients with severe hemophilia A occurs at an early age (6-8 months old) when the child becomes more active, and about 50% of these bleeds are into soft tissues (6). The oc-currence of bleeds in joints namely in the ankle, elbow and knee, increases with age and comprises about 60% of the total number of bleeds in patients aged 18-65 years (7). Repeated bleeds in the same joint causes inflammation of the synovial tissue, resulting in increasing damage of the joint. Ultimately, repeated bleeds can lead to the development of hemophilic arthropathy, a de-bilitating condition characterized by chronic pain, functional impairment and reduced quality of life (8).
1.1.4 Treatment strategies
The main prevention and treatment strategy in hemophilia A patients com-prises the administration of the lacking coagulation protein, coagulation FVIII, to reach adequate hemostasis. This strategy, known as FVIII replace-ment therapy or substitution therapy, represents the basis of the modern treat-ment of hemophilia A, and it is the focus of this thesis.
Other treatment strategies have been used, or start to be used, to treat hemo-philia A. Desmopressin is a synthetic analog of vasopressin that increases the plasma levels of FVIII and von Willebrand factor (VWF) for patients with mild and moderate hemophilia A (9). It shows high inter-patient variability and requires the administration of a test-dose to determine the individual in-crease in FVIII in plasma. Emicizumab is a humanized bispecific antibody that mimics the cofactor function of FVIII by bridging activated FIX and fac-tor X (10). It has recently been approved to prevent bleeding episodes in pa-tients of all ages, with or without the presence of inhibitors anti-FVIII, and it is administered subcutaneously every 1-4 weeks (11, 12).
Of note, treatments for hemophilia A with mechanisms action other than re-placing FVIII, such as desmopressin, emicizumab, bypassing agents, or other products in development (e.g. concizumab or fitusiran) will not be further dis-cussed in this thesis.
1.2 Factor VIII replacement therapy
1.2.1 Prevention and treatment strategies
This thesis focuses mainly on FVIII replacement therapy given in prophylaxis to prevent the occurrence of bleeding events, however, this therapy can also be administered on-demand, after the occurrence of a bleed, or periopera-tively, to prevent bleeds in the perioperative setting.
1.2.1.1 Prophylaxis
Prophylactic treatment aims at preserving the normal musculoskeletal func-tion by avoiding bleeding and joint destrucfunc-tion. It is based on the observafunc-tion that patients with moderate hemophilia A tend to have less spontaneous bleeds than patients with severe hemophilia A, and relies on increasing the levels of FVIII from a severe to a milder form of the disease (13, 14).
ap-of FVIII thrice per week (15-17). In countries with limited access to replace-ment therapy, doses as low as 10 IU/kg twice per week have been found to be effective (18).
1.2.1.2 On-demand
On-demand treatment is given to treat a bleed and the doses, frequency and duration of treatment depend on the type and severity of the bleeding event. The loading dose administered is usually calculated based on the average in vivo recovery (observed post-dose FVIII activity level corrected for baseline in IU/dL divided by dose in IU/kg), where each unit of FVIII infused per kg increases plasma FVIII activity by 2 IU/dL (19, 20).
1.2.1.3 Perioperative
In the perioperative setting, target plasma FVIII activity levels are higher than in prophylaxis, and can be achieved with continuous or intermittent infusions. To calculate the loading dose, the average in vivo recovery is used, as for on-demand treatment.
1.2.2 Replacement products available
Currently, there are two main types of FVIII replacement products, which are classified according to their elimination half-life: standard half-life and ex-tended half-life products.
Standard half-life products can be either derived from plasma (plasma-derived FVIII, pdFVIII) or recombinant (rFVIII). Plasma-derived products are manu-factured using human plasma, whereas rFVIII products are prepared by re-combinant DNA technology (21). The selection of the type of product to ad-minister depends on many factors, including efficacy, cost and safety. Nowa-days, both types of products are considered to be exceptionally safe with re-spect to the transmission of pathogens, and the major topic of debate is whether one type of FVIII replacement product exhibits a higher risk of de-veloping anti-FVIII inhibitors compared to the other (21-23). Standard half-life products are the focus of this thesis.
Extended half-life products were created to increase the half-life of FVIII, and therefore reduce the frequency of administrations while maintaining hemo-static balance. The half-life prolongation is carried out by combining a FVIII molecule with the Fc domain of human immunoglobulin G1 or with polyeth-ylene glycol (PEGylation). The half-lives of these products are about 1.5 higher compared to standard half-life products (24, 25).
1.2.3 Pharmacokinetics of exogenous standard half-life FVIII
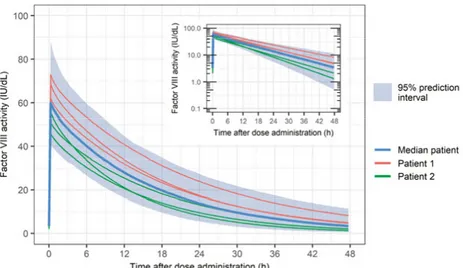
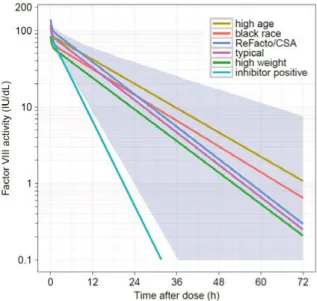
Factor VIII is a protein that contains 2332 amino acids (330 kDa) organized in three domains in the following order: A1-a1-A2-a2-B-a3-A3-C1-C2 (26). In healthy subjects, FVIII is presumably produced primarily in the liver, where it is also cleared by the low density lipoprotein receptor-related protein 1 (LRP1) and the low-density lipoprotein receptor (LDLR) (27). Factor VIII cir-culates in plasma in complex with the VWF which protects it from proteolysis and rapid clearance (CL). The FVIII-VWF complex has a high molecular weight, which results in a distribution of FVIII mainly in plasma. A reduction in VWF levels is accompanied by a reduction in FVIII levels (28). Von Wil-lebrand factor levels are high at birth, decrease over the first year of life, and thereafter gradually increase during childhood (29, 30). In adults, VWF levels have been shown to continue to increase with age, an effect that is more pro-nounced in individuals with blood type non-O (31).The PK of rFVIII and pdFVIII is usually assumed to be similar, even though small differences may exist between products (32, 33). Factor VIII activity in plasma decays bi-exponentially, with an initial half-life of about 3 hours and a terminal half-life between 11 and 16 h (32, 34). Plasma CL values are be-tween 2.4 and 3.4 mL/h/kg and volume of distribution at steady-state bebe-tween 0.043 and 0.057 L/kg (32, 34). The processes of distribution and elimination of FVIII from plasma have been described to have a large unexplained IIV (>30%CV on CL, and >10%CV on volumes) and a small to moderate varia-bility between dose administrations (inter-occasion variavaria-bility, IOV, also known as within-occasion variability; 0-15%CV on CL, and 0-10%CV on vol-umes) (35-37). Figure 1 shows the variability in the plasma FVIII activity levels in a median patient, and in two virtual patients, with similar demo-graphic characteristics following the administration of dose of a FVIII product on three occasions. In addition, the prediction interval is depicted which in-cludes 95% of the FVIII activity-time profile levels in a cohort of 500 virtual patients.
A small portion of the IIV observed in the PK of FVIII activity can be ex-plained by differences in age, body weight, plasma levels of VWF and blood group (35, 36, 38, 39).
Figure 1. Illustration of plasma FVIII activity-time profiles following an intravenous bolus administration of 2040 IU (30 IU/kg) of a FVIII product at steady-state on 3 occasions to 500 virtual patients with severe hemophilia A aged 24 years and weigh-ing 68 kg, in the linear and semi-log scale. Simulations performed usweigh-ing a model de-veloped by Björkman et al. including inter-individual variability (clearance 28%CV; central volume 17%CV) and inter-occasion variability (clearance 13%CV; central volume 10%CV) (35).
1.2.4 Quantification of plasma FVIII
Plasma concentrations of coagulation FVIII are difficult to measure and con-centrations may not directly translate into biological activity. Therefore, FVIII is commonly measured in terms of activity using bioassays, expressed as IU, where 1 IU of FVIII approximates the activity of FVIII in 1 mL of normal plasma. The most commonly used assays for FVIII activity measurement are the one-stage activated partial thromboplastin time clotting assay (OSA) and the two-stage chromogenic substrate assay (CSA) (40). In the OSA, FVIII-deficient plasma is mixed with an equal volume of the test plasma sample with addition of phospholipids and surface activator reagents (41). Thereafter, cal-cium ions are added to initiate the coagulation reaction, and the activated par-tial thromboplastin time is recorded. The CSA comprises two stages: in the first stage, the test plasma sample is incubated with activated coagulation fac-tor IX (FIXa), coagulation facfac-tor X (FX), thrombin (optional), calcium ions and phospholipids to generate activated FX (FXa); in the second stage, the FXa hydrolyzes a FXa-selective chromogenic substrate, and the resulting color intensity indicates the amount of FXa, which is directly proportional to the amount of FVIII in the test plasma sample (42). These two assays lead to discrepant results under some circumstances, for instance, in the presence of specific phenotypes or mutations in the F8 gene and when certain FVIII prod-ucts are analyzed (such as B-domain deleted rFVIII) (40). Both assays are unable to measure FVIII activity levels below 1 IU/dL accurately.
1.2.5 Limitations of treatment
The main limitations related to FVIII replacement therapy are (i) the develop-ment of inhibitors against FVIII, (ii) the high cost, and (iii) the frequent intra-venous injections.
The development of circulating neutralizing antibodies against FVIII (i.e. in-hibitors) is the most serious health complication associated with treatment. Inhibitors are formed in approximately 30% of patients with severe hemo-philia and increase the CL of FVIII and/or decrease in vivo recovery (43). Several risk factors for inhibitor development have been identified, including hemophilia severity, age at first exposure to a FVIII product and, possibly, product type (pdFVIII vs. rFVIII) (2). When the development of inhibitors is observed, bypass FVIII agents can be administered, or patients undergo im-mune tolerance induction, which has an inhibitor eradication success rate be-tween 59% (high responding inhibitors) and 86% (low responding inhibitors) (44).
Another challenge associated with FVIII replacement therapy is the cost of FVIII products. The average cost of therapy with FVIII per patient is ~200 000 EUR/year across the five most populated European Union countries (45). This represents a major economic burden and full dose-prophylaxis is often prohibitive for much of the world, which leads to adoption of low-dose prophylaxis regimens (46).
Finally, given the short half-life of standard FVIII products, patients require the administration of frequent intravenous injections in prophylaxis (3-4 times per week). This aspect is one of the main obstacles to treatment adherence (47).
1.3 Pharmacometrics
1.3.1 Basic principles
Pharmacometrics has been described as “the science of developing and apply-ing mathematical and statistical methods to characterize, understand, and pre-dict a drug’s PK, pharmacodynamic (PD), and biomarker outcomes behavior” (48, 49). Non-linear mixed effects modeling, or population modeling ap-proach, is the most used modeling approach in pharmacometrics. With this technique, the estimated model describes the features of a compound for all data at a population level by estimating, in one step, fixed effects and random
parameters, estimated as variances, and may comprise three levels: i) residual unexplained variability (RUV), which includes errors of measurement (e.g. analytical assay errors or uncertain dosing/sampling times), model misspeci-fications and intra-individual variability; ii) variability in parameter estimates between individuals (IIV); and iii) variability in parameter estimates between occasions within the same individual (IOV). With this approach it is possible to analyze rich, sparse or unbalanced data since each individual “borrows” information from the other individuals in the data, as the same structural model is applied to all data simultaneously. For instance, the PK parameters of a 2-compartment model for subjects with just peak and trough concentra-tions, collected following different dosing regimens, may be calculated based on the individual observations but they are also informed by the PK behavior in the remaining patients and observations in the dataset.
The estimation of an inappropriate stochastic model can lead to biased param-eter estimates. For instance, neglecting the estimation of IOV may result in the inflation of residual and/or IIV as well as biased typical parameter values (50, 51).
1.3.2 Bayesian forecasting
Bayesian forecasting relies on the estimation of the most likely individual PK or PK/PD parameters, known as empirical Bayes estimates (EBEs), based on the patient’s data (dosing regimen, covariate values, surrogate marker) and a prior population model, including fixed and random effects (52). Mathemati-cally, the estimation of the best set of EBEs is performed through the minimi-zation of a Maximum A Posteriori (MAP) Bayesian objective function (53):
OBJMAP = ∑ (Pj- Pj) 2 ωPj2 p j=1 + ∑ (Ci- Ci)2 σCi2 m i=1 (eq. 1)
where is the number of parameters in the model, Pj is the typical value of the th parameter in the model and P the estimate of the individual’s
parame-ter, ωP2j is the inter-individual variance in the th parameter, is the number
of observations, Ci is the th observed concentration and Ci is the respective predicted concentration using the Pj values, and σC2i is the residual error vari-ance.
1.4 Individualization of drug therapy
Dose individualization can occur a priori or a posteriori, and both approaches can take advantage of an established PK/PD relationship described in a popu-lation model.
A priori dose individualization uses relevant prior knowledge of the patient (e.g. demographic, clinical, or genetic information) to define dosing regimens without requiring the administration of the drug. An example of a priori dose individualization in hemophilia A is the individualization of treatment based on body weight (e.g. administration of 30 IU of FVIII product per kg). A pop-ulation model can be used in a priori dose individualization by calculating the dose required by a typical subject with certain covariate values to achieve a specific target.
A posteriori dose individualization involves the collection of a patient-specific endpoint marker of effect after the administration of the drug (e.g. drug plasma concentration) in order to tailor the upcoming dosing regimen. This individu-alization approach can take advantage of a population model, but does not have to. For instance, the reduction of prophylactic FVIII doses in hemophilia A after the systematic observation that a patient does not bleed, or dose tailing based on PK parameters obtained through a non-compartmental approach are a posteriori dose adaptation approaches that do not require a stablished popu-lation model.
Model-based therapeutic drug monitoring (TDM) is an a posteriori dose indi-vidualization approach that uses Bayesian forecasting to estimate the individ-ual PK/PD parameters (as introduced in section 1.3.2) and thereafter generate individualized doses to achieve a given target. Model-based TDM has demon-strated to be a valuable tool in multiple therapeutic areas (54-56), leading to an optimal balance between safety and efficacy, namely, when a drug has a narrow therapeutic margin and exhibits high IIV compared to RUV and/or IOV (57-59). However, if the magnitude of the RUV and/or IOV is moderate to high, the individual response on the next occasion is difficult to predict, and the usefulness of model-based TDM may be limited (50, 60, 61). One of the focus of this thesis is on how different magnitudes of IOV affect model-based TDM and how IOV can be handled in dose individualization.
1.5 A posteriori dose individualization of FVIII
replacement therapy
Bayesian forecasting based on individual PK observations has been suggested as a promising tool to tailor FVIII dosing regimens in clinical practice, partic-ularly in patients with severe hemophilia A under prophylactic treatment (PK-based/driven/guided/tailored prophylaxis) (38, 39, 62, 63).
1.5.1 Target FVIII activity
The choice of an individualized dosing regimen (dose and dosing interval) requires the definition of a plasma FVIII activity target above which the pa-tient’s observed trough FVIII activity should be. Traditionally, a value of 1 IU/dL is used (13, 64). However, there is increasing evidence that a one-tar-get-fits-all strategy is not appropriate and that the plasma FVIII activity to protect patients against bleeds is highly patient-specific (e.g. it may depend on patient’s response to treatment, physical activity and state of underlying joint disease) (64-71). Recently, alternative target levels have been suggested for different groups of patients, based on the individual clinical characteristics and on the patient’s lifestyle, however, these still lack clinical validation (72).
1.5.2 Bayesian prior models
Bayesian forecasting of PK parameters can only be done reliably if the patient has similar characteristics than the group of patients used to develop the prior population PK model. The population PK of FVIII activity have been exten-sively studied, and numerous models are described in the literature (for in-stance (35-37, 73, 74)). Even though these models are usually developed based on data obtained during clinical development trials, models based on other sources of data exist, such as data obtained in the perioperative setting (74). In case a model has not been developed based on a patient-specific character-istic and setting (for instance, a morbidly obese patient in the perioperative setting), an extrapolation can be considered (74, 75).
1.5.3 Model-based TDM tools for FVIII dose individualization
Bayesian forecasting of PK parameters and subsequent proposal of optimal dosing regimens has been implemented in multiple tools with the goal of fa-cilitating model-based TDM in PK-based prophylaxis. Two examples are the Web-Accessible Population Pharmacokinetic Service—Hemophilia (WAPPS-Hemo, McMaster University, Hamilton, Ontario, Canada, www.wapps-hemo.org), which support multiple FVIII products, or the medi-cal device myPKFit® (Shire Pharmaceutimedi-cal Holdings Ireland Limited, Dub-lin, Ireland, www.mypkfit.com), which support a specific product (76, 77). It should be noted that different tools may lead to different dose recommenda-tions (78).2 Aims
The overall aim of this thesis was to improve dose individualization of FVIII replacement therapy in hemophilia A using pharmacometric approaches. The specific aims were:
• To investigate the population PK of FVIII activity following the ad-ministration of a B-domain deleted rFVIII product, moroctocog alfa, in patients with moderate to severe hemophilia A, including relevant parameter-covariate relationships (Paper I);
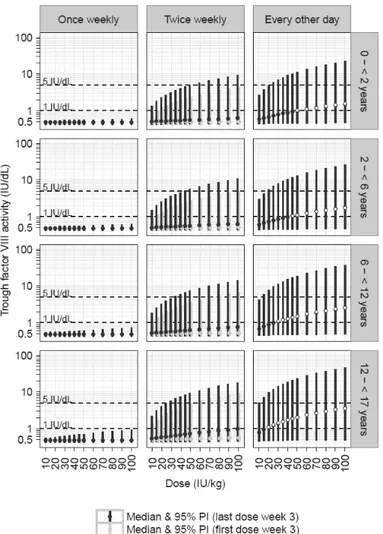
• To assess the trough FVIII activity levels following several dosing schedules for prophylaxis with moroctocog alfa in pediatric cohorts through simulations (Paper I);
• To assess proposed approaches to handle inter-occasion variability (also known as within-patient variability) in model-based TDM and how a posteriori dosing compares with conventional body weight dosing, using a population PK model of FVIII activity (Paper II); • To characterize the relation between the dose of a full-length rFVIII
product, octocog alfa, plasma FVIII activity and bleeding patterns (bleeding frequency and severity) using an integrated model based on data from patients with severe hemophilia A (Paper III);
• To find sources of inter-individual variability of PK and bleeding pat-terns through the comprehensive assessment of the relationship be-tween the integrated model parameters and patient- and study-charac-teristics (Paper III);
• To use the integrated model, developed in Paper III, to contrast dif-ferent sources of patient information in their ability to forecast the fu-ture occurrence of bleeds in severe hemophilia A patients receiving prophylactic FVIII replacement therapy (Paper IV).
3 Methods
3.1 Factor VIII replacement products
Data of two rFVIII replacement products, moroctocog alfa and octocog alfa, were used in the pharmacometric approaches developed in this thesis. Moroctog alfa is a B-domain deleted rFVIII product which is marketed under two names, ReFacto AF® (Wyeth Pharmaceuticals [Pfizer]) in the European Union and other regions, and Xyntha® (Wyeth Pharmaceuticals [Pfizer]) in the United States of America, China and other regions (79). The potency of these products was assigned to different analytical assays, with ReFacto AF assigned to the CSA, and Xyntha to the OSA. Both ReFacto AF and Xyntha belong to the third generation of rFVIII products, where all exogenous human- or animal-derived proteins were removed from the manufacturing process, and resulted from the enhancement of a second generation rFVIII product, Re-Facto® (Wyeth Pharmaceuticals [Pfizer]). The study reported in Paper I in-cluded pooled data following the administration of Refacto (five studies), Re-facto AF (five studies) and Xyntha (four studies).
Octocog alfa (BAY 81-8973) is a full-length rFVIII product marketed under the name of Kovaltry® (Bayer HealthCare) (80). It belongs to the third gen-eration of rFVIII products, and is the result of the improvement of the second-generation product Kogenate® FS (Bayer HealthCare). The studies reported in Paper III and IV included pooled data from three clinical trials during which Kovaltry was administered.
The population PK model applied in the methodological work carried out in Paper II was not developed based on PK data from a specific product, but from multiple FVIII compounds, including pdFVIII and rFVIII products.
3.2 Clinical data
Informed consent was obtained from all subjects participating in the clinical trials from which data were included in this thesis, and the study protocols were approved by each participating center’s ethics committee or institutional review boards.
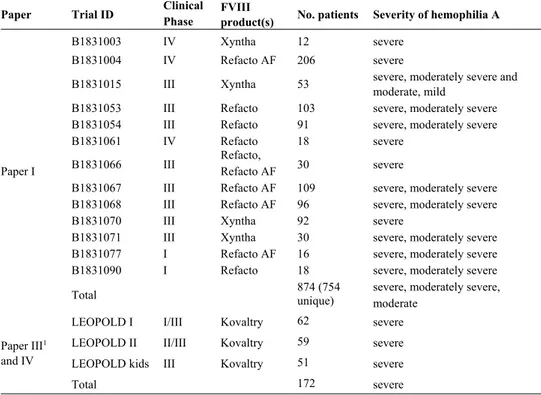
In Paper I, dosing, PK and covariate data from patients enrolled in 13 differ-ent clinical trials receiving prophylactic or on-demand treatmdiffer-ent with moroc-tocog alfa were included (Table 2) (81-89). The trials were conducted from 1993 to 2013, in 25 countries, and included pediatric and adult patients. Four studies involved a single intravenous administration followed by rich sam-pling (11-12 samples) up to 48 or 72 hours post-dose. In four other studies, rich sampling was conducted on at least one occasion and sparse sampling (1-4 samples) on one or more occasions. In the remaining five studies, only sparse sampling was applied.
In total, data from 754 patients with moderate to severe hemophilia A were included in the development of the model. Of these, 116 patients were younger than 12 years (age range 1 day-73 years old). The median patient was a 23-year-old non-Hispanic or Latino white man, weighing 69 kg. A total of 7363 plasma FVIII activity observations (pre- or post-dose) were included, of which 910 (12.4%) were below the lower limit of quantification (LLOQ) (1 or 2 IU/dL). Factor VIII activity was measured with the OSA (4 studies) or CSA (9 studies), at a central (12 studies) or local laboratory (1 study). For 312 sam-ples, two or more FVIII activity values were available which resulted from multiple FVIII activity measurements of the same sample. Covariate infor-mation available included body weight, lean body weight (LBW), total body water, age, race, ethnicity, analytical methods (CSA/OSA, central/local labor-atory), neutralizing anti-FVIII inhibitor status and titer, study, year of study start and country.
In Paper III, dosing, PK, bleeding patterns (frequency and severity) and co-variate data from patients enrolled in the three Long-Term Efficacy Open-Label Program in Severe Hemophilia A Disease (LEOPOLD) clinical trials receiving prophylactic or on-demand treatment with octocog alfa were in-cluded (Table 2) (90-92). The trials LEOPOLD I and LEOPOLD II inin-cluded patients aged >12 years and LEOPOLD kids included patients <12 years. In total, data from 183 patients with severe hemophilia A were included in model development, including 11 patients who contributed with dose, PK and covariate information, but not with bleeding information. Of these, 51 patients were younger than 12 years. The median patient was a 22-year-old 60-kg white male, with a VWF level of 104%, and 11 bleeds in the 12-month period before the start of the study. A total of 1535 plasma FVIII activity observations (pre or post-dose) were included, of which 254 (17%) were below the LLOQ (1.5 or 3 IU/dL). Factor VIII activity was measured with the CSA. In addition, 663 bleeds from 172 patients receiving prophylactic treatment were available
the 12 months pre-study period, previous therapy history, on-demand or prophylaxis, number of target joints for bleeds at study start, ratio of the num-ber of bleeds in the 12 months pre-study period to the numnum-ber of target joints for bleeds at study start and study.
In Paper IV, the LEOPOLD clinical trial data were included, as in Paper III, but only patients taking prophylactic treatment with octocog alfa participating in the bleeding observation period were considered. In total, data from 172 patients with severe hemophilia A were included and were divided into two groups: <12 years (LEOPOLD kids); and ≥12 years (LEOPOLD I and LEO-POLD II). A total of 51 patients younger than 12 years were included with a median observation period of 6.1 months (range 3.8-7.2), and 121 patients aged 12 years or older with a median observation period of 12.1 months (range 3.08-13.1).
Table 2. Characteristics of the patient cohorts included in the model develop-ment/evaluations (Paper I, III and IV).
Paper Trial ID Clinical Phase FVIII product(s) No. patients Severity of hemophilia A
Paper I
B1831003 IV Xyntha 12 severe
B1831004 IV Refacto AF 206 severe
B1831015 III Xyntha 53 severe, moderately severe and moderate, mild
B1831053 III Refacto 103 severe, moderately severe B1831054 III Refacto 91 severe, moderately severe
B1831061 IV Refacto 18 severe
B1831066 III Refacto, Refacto AF 30 severe
B1831067 III Refacto AF 109 severe, moderately severe B1831068 III Refacto AF 96 severe, moderately severe
B1831070 III Xyntha 92 severe
B1831071 III Xyntha 30 severe, moderately severe B1831077 I Refacto AF 16 severe, moderately severe
B1831090 I Refacto 18 severe, moderately severe
Total 874 (754 unique) severe, moderately severe, moderate
Paper III1 and IV
LEOPOLD I I/III Kovaltry 62 severe
LEOPOLD II II/III Kovaltry 59 severe
LEOPOLD kids III Kovaltry 51 severe
Total 172 severe
111 additional patients not mentioned in the table contributed with dose, PK and covariate in-formation for model development and covariate assessment in Paper III. FVIII: factor VIII.
3.3 Model development and qualification
3.3.1 Population PK models
Paper I and III included the development of population PK models of FVIII activity.
In Paper I, alternative disposition models to describe the PK of FVIII activity were assessed. Since different moroctocog alfa products were aligned to dif-ferent assays, the bioavailability of Xyntha (OSA calibrated) relative to Re-Facto products (CSA calibrated) was set to 1.38 (93). The PK of FVIII activity was assumed to be equivalent following administration of ReFacto and Re-Facto AF (86).
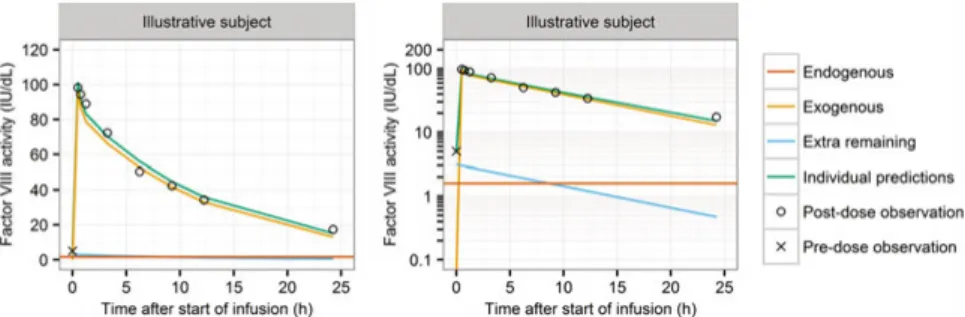
The patient population included severe, mild and moderate hemophilia A pa-tients. Therefore, the individual endogenous level of FVIII activity was esti-mated (94). The individual model predictions resulted from the sum of three components: individual endogenous FVIII activity, FVIII activity supplied by the administration of exogenous FVIII product (moroctocog alfa), and resid-ual FVIII activity coming from previous unknown doses of moroctocog alfa (Figure 2). The estimation of the latter component was included when patients had unexpected high observed FVIII activity levels before the administration of the very first dose recorded, defined as a FVIII activity observation above the criterion of acceptance of the degree of hemophilia A severity activity for each study; this portion of FVIII activity was set to decay according to the individual estimated first-order elimination (95).
Figure 2. Individual model-predicted plasma FVIII activity in an illustrative subject with an unexpected high pre-dose FVIII activity observation (96).
In Paper III, the population PK model development was based on the PK model published by Garmann et al. using the same longitudinal FVIII activity data (37). This was a two-compartment model with the influence of LBW on
3.3.1.1 Inter-individual and inter-occasion variability
In general, the structural model parameters were assumed to be log-normally distributed and IIV and IOV were modelled according to Karlsson et al. (50), as exemplified below for CL:
CLik = θ ∙
WTi
WTmed ¾
∙ ηCLi+ κCLik (eq. 2)
where CLik represents the value of clearance for the ith patient on occasion k,
θ is the estimated typical value of clearance for a patient with median body weight WTmed, WTi is the patient’s body weight, ηCL
i is a normally distributed
random effect with mean zero and estimated variance ω2 ( ~ N(0, ω2)) and
κ is a normally distributed random effect with mean zero and an estimated variance π2 ( ~ N(0, π2)). An occasion was defined as each separate dose
event with FVIII activity observations associated to it (pre- or post-dose). If a given random effect was found to follow a distribution other than a normal distribution (e.g. bimodal or skewed distributions), other distributions were explored.
3.3.1.2 Residual variability
Residual variability (RUV) was parameterized using additive, proportional, or a slope-intercept model, as exemplified below for the slope-intercept model:
Cij = Cij ∙ 1 + εpij + εaij (eq. 3)
where Cij is the jth measured FVIII activity in the ith individual and Cij is the
jth model predicted FVIII activity in the ith individual. ε
pij and εaij are random effects describing the discrepancy between the individual prediction and the observation in a proportional or additive manner, respectively. Each random effect is assumed to be independently normally distributed with a mean of zero and estimated variances of σpij2 and σ
aij 2 (e.g. ε
pij ~ N(0, σpij2 )).
In Paper I, multiple FVIII activity measurements were available from the same sample, which allowed the estimation of a replicate-specific erroras de-scribed by Karlsson et al. in addition to the RUV (97). In Paper III among the model assumptions tested was the inclusion of IIV in the RUV (98). 3.3.1.3 Data below the lower limit of quantification
In Paper I, data below the LLOQ were included in the model development when the actual measured values were available, or otherwise, were handled using the M5 method by imputing the LLOQ/2 (99). In Papers II, III and IV
data below the LLOQ were handled using the M3 method, where the observa-tions below the LLOQ were treated as censored observaobserva-tions and the likeli-hood that these observations were indeed below the LLOQ was estimated (99, 100).
3.3.2 Repeated time-to-categorical event model
In Paper III, a model was developed to describe the time to the occurrence of bleeds and respective severity, which was integrated with the population PK model of octocog alfa described in section 3.3.1.
The time to the occurrence of bleeds was modelled using repeated time-to-event modeling, which is an extension of parametric time-to-time-to-event survival analysis using non-linear mixed effects modeling (101, 102). The probability density of each bleed and the probability of having a mild, moderate or severe bleed were estimated based on the observed time of bleeding and severity score (mild, moderate, severe) using repeated time-to-categorical event (RTTCE) modeling, which is a combination of parametric survival analysis and a proportional odds model for ordered categorical data (101-105). The bleeding hazard, i.e. the instantaneous potential to have a bleed per unit of time, was estimated using exponential, Weibull and Gompertz functions. At the end of the bleeding observation period all individuals were assumed to have a right-censored observation. An IIV term was assessed in the overall bleeding hazard and in the logit transformation of the severity probability. In addition, the time-dependency between consecutive bleeds was assessed with a Markov hazard rate.
3.4 Parameter-covariate assessment
In Paper I, several steps were taken to evaluate the influence of covariates. First, the influence of body size on the disposition parameters was assessed by testing total body weight, LBW and total body water, using fixed allometric theory-based exponents (0.75 for CL and Q, and 1 for V1 and V2, respec-tively) (106), or allowing the estimation of the exponents. Second, covariates expected to affect FVIII activity disposition were tested, namely, the analyti-cal method to influence the relative bioavailability and RUV, and the individ-ual time-varying inhibitor status and titer, as well as age, to influence CL. Third, age, race and ethnicity were assessed in parameters with IIV using step-wise covariate modeling (forward selection significance level (α) =0.01,
of study start and country were explored graphically. Finally, a final back-wards deletion step was carried out (α=0.005) and clinical relevance was as-sessed.
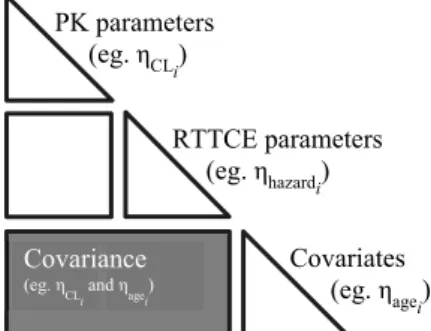
In the integrated model developed in Paper III, the relation between the time-varying individual plasma FVIII activity predicted from the population PK model and the bleeding hazard was explored using a linear, an exponential and an inhibitory maximum effect model. The PK and RTTCE models were esti-mated simultaneously, including the time-varying FVIII effect, and thereafter covariates were integrated in the model using full random effects modeling (FREM) (108, 109). This methodology allows the characterization of the re-lationship between all model parameters and all covariates in a single step. Covariates were included as observations in the model, and their distributions were modelled as random effects (Figure 3). The interaction between model parameters and covariates was carried out at a random effects level in a full covariance matrix. Impactful parameter-covariate relationships were identi-fied based on the correlation coefficient (r), precision of the effects sizes and scientific plausibility.
Figure 3. Representation of the covariance structure of the model using full random effects modeling for parameter-covariate characterization in Paper III. The shaded area represents the interaction between the random effects of model parameters and covariates. PK: pharmacokinetic; RTTCE: repeated time-to-categorical event.
3.4.1 Missing covariate values
In Paper I, missing height information was derived from the height-body weight relationship estimated from the height-body weight pairs available in the remaining cohort of patients (110):
HTi = 51.6 + 136 · WTi
2.04
22.42.04+ WTi2.04 + ηi (eq. 4)
where HTi is the height (cm) for a given subject with body weight WTi (kg) and an individual variability parameter ηi ~ N (0, 47.8) (standard deviation 6.91 cm). PK parameters (eg. ηCLi) RTTCE parameters (eg. ηhazardi) Covariates (eg. ηagei) Covariance (eg. η
In Paper III, missing covariate data were handled implicitly by the FREM approach.
3.4.2 Unlikely clinical relevance
In Paper I, the selection of covariate was assessed using statistical and un-likely clinical relevance criteria (111). Covariates included in the model were assessed in terms of unlikely clinical relevance specified a priori as follows: a dichotomous covariate was dropped if the change in the typical parameter value was <10% from the most common category; a continuous covariate was dropped if the difference from the typical parameter value at the 50th percentile
of the covariate distribution was <5% at the 5th and 95th percentiles of the
co-variate distribution.
3.5 Model discrimination and evaluation
Model selection was based on scientific plausibility, changes in objective function value (OFV; -2·log-likelihood), goodness-of-fit plots and precision of parameter estimates. In addition, the EBEs and diagnostic plots were used if these values were found reliable based on magnitude of the eta- and epsilon-shrinkage (112, 113). For competing hierarchical models, the likelihood ratio test was used where the addition of one parameter (1 degree of freedom, d.f.) was considered statistically significant with an OFV decrease of at least 6.64 points (α=0.01).
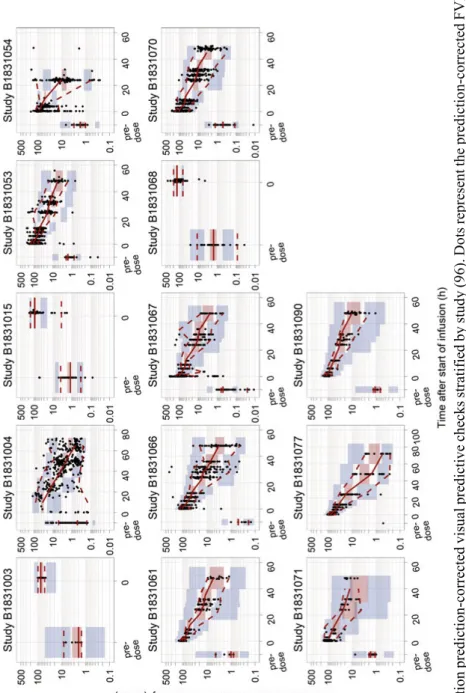
In Paper I and III key population PK models were qualified using prediction-corrected visual predictive checks (114). In Paper III, the RTTCE model was qualified with visual predictive checks of the Kaplan-Meier curves stratified by bleed number and severity, and using the kernel-based visual hazard com-parison tool (115).
The precision of the parameter estimates (standard error and confidence inter-vals (CI)) was obtained from the covariate step in NONMEM using the sand-wich matrix (Paper I), or the R matrix following an evaluation step using the Monte-Carlo importance sampling (IMP) estimation method (Paper III). In addition, the sampling importance resampling (SIR) procedure was used in Paper I (116).
years; and 12 to <17 years), based on simulations of 1000 individuals uni-formly sampled over the age range, on a month resolution level, following a fixed dose of Xyntha. For each pediatric cohort, body weight was sampled from the National Health and Nutrition Examination Survey data from years 1999–2010, available at the Centers for Disease Control and Prevention (117).
3.7 Handling inter-occasion variability in model-based
TDM
In Paper II, different approaches to handle IOV (also known as within-patient variability) in model-based TDM were assessed in a simulation-based study. Factor VIII activity data at 4, 24 and 48 h post-dose following the administra-tion of 30 IU/kg on 4 occasions and the respective individual PK parameters were simulated for 1000 virtual severe hemophilia A patients based on the model reported by Björkman et al. (35). These data were considered to be the true data, i.e. the true PK individual parameters and the FVIII activity levels as observed in a real-world TDM setting. Thereafter, EBEs were estimated using Bayesian forecasting based on the FVIII activity levels obtained from different occasions. These EBEs were then used to calculate the dose to be administered on the next occasion (doseTDM) to reach a FVIII activity target of 1 IU/dL at 48 hours post-dose. This procedure was repeated using the Bayesian forecasting and dose calculation approaches described in the follow-ing section 3.7.1. Finally, doseTDM was compared with the dose calculated based on the true parameters simulated initially for the forecasted occasion (dosetrue) through the calculation of the relative prediction error (PE) as fol-lows:
PEi % = (doseTDM – dosetrue)
dosetrue ∙ 100 (eq. 5)
where PEi is the prediction error in the ith simulated subject, doseTDM is the
TDM individualized dose for the next occasion and dosetrue is the true dose
required on the forecasted occasion. Accuracy was quantified by the 50th
per-centile of the PEi, and precision by the extreme 2.5th, 10th, 25th, 75th, 90th and 97.5th percentiles.
The procedure described above was repeated for alternative scenarios while varying: the number of occasions to produce the EBEs (1-3 occasions); the number of observations within an occasion (1-3 FVIII activity observations post-dose); and the IOV magnitude on CL and V1 (0%-50%CV).
In addition, the results of the model-based TDM approaches were compared with conventional body weight-based dosing. For the latter, the dose was re-duced by applying a factor of 0.3 (9 IU/kg) so that the generated median FVIII activity values were close to the defined target of 1 IU/dL.
3.7.1 Model-based TDM approaches assessed
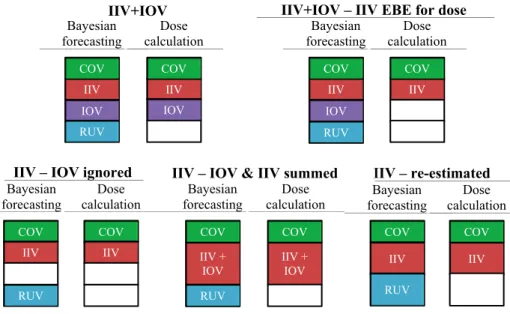
Five model-based TDM approaches were tested (118, 119), which involved two steps. Firstly, the EBEs were estimated using Bayesian forecasting. Sec-ondly, a new set of parameters was derived from the EBEs and was used to calculate the individualized dose. A description of these two steps for the five approaches tested is exemplified for CL in Table 3, and it is represented in Figure 4.
Table 3. Model-based TDM approaches used in Bayesian forecasting and dose cal-culation in Paper II. Exemplified for clearance.
Approach Model to estimate the EBEs Parameter to calculate the individualized dose IIV+IOV CLη ~ N(0, ij = TVCL ∙
ω2), κ ~ N(0, π2) CLijTDM = CLij
IIV+IOV – IIV EBE for dose
CLij = TVCL ∙
η ~ N(0, ω2), κ ~ N(0, π2)
CLijTDM = TVCL ∙ η ~ N(0, ω2)
IIV – IOV ignored CLη ~ N(0, ij = TVCL ∙
ω2), π2 set to 0 CLijTDM = CLij
IIV – IOV & IIV summed
CLij = TVCL ∙
η ~ N(0, ω2+π2), π2 set to 0 CLijTDM = CLij
IIV – re-estimated
CLij = TVCL ∙
η ~ N(0, ω2), ω2 from a model re-es-timated with π2 set to 0
CLijTDM = CLij
CLij, empirical Bayes estimate of clearance for the ith subject at the jth occasion; CLij TDM,
indi-vidual parameter used to calculate the indiindi-vidualized dose; EBE: empirical Bayes estimate; IIV: inter-individual variability; IOV: inter-occasion variability; TVCL: typical value of clearance, calculated as TVCL = 222 ∙ WT68 0.75∙ (1 - 0.00696 ∙ (age - 24)); WT: body weight; η and κ were individual IIV and IOV terms independently estimated and normally distributed with mean zero and variances ω2 and π2, respectively.
Figure 4. Graphical representation of the model-based TDM approaches assessed in
Paper II. COV: covariates, IIV: inter-individual variability, IOV: inter-occasion
var-iability, RUV: residual unexplained variability.
3.8 Comparison of sources of patient information to
forecast bleeds
In Paper IV, the PK-RTTCE model described in Paper III was used to con-trast different sources of patient information in their ability to forecast the fu-ture occurrence of bleeds. This study was based on Bayesian estimations and on a subset of the data used to develop the PK-RTTCE model, as described in section 3.2.
3.8.1 Bayesian forecasting of bleeds
The EBEs related to PK and bleeding hazard parameters were obtained using Bayesian forecasting based on the PK-RTTCE model and varying the obser-vation time and the nature of the obserobser-vations included. For each patient, a new set of EBEs was estimated from the start of the study until the end of each consecutive 24-hour period. In the end of the study, each patient had n sets of EBEs, with ni equal to the number of days that the ith patient participated in the study. IIV IOV RUV COV Bayesian forecasting Dose calculation IIV+IOV IIV IOV COV IIV IOV RUV COV Bayesian forecasting Dose calculation
IIV+IOV – IIV EBE for dose
IIV COV COV Bayesian forecasting Dose calculation IIV – re-estimated IIV COV IIV + IOV COV Bayesian forecasting Dose calculation
IIV – IOV & IIV summed
IIV + IOV COV RUV COV Bayesian forecasting Dose calculation
IIV – IOV ignored
COV
IIV IIV IIV
RUV RUV
3.8.1.1 Information scenarios
Bayesian estimation was repeated including the following three information scenarios:
• PK: only plasma FVIII activity observations were included in the estimation of the EBEs related to PK, and other EBEs were set to zero.
• Bleed: Only the times of bleeds were included in the estimation of the EBEs related to the bleeding hazard, and other EBEs were set to zero.
• All: Plasma FVIII activity observations, bleeds and all covariate data were included in the estimation of the EBEs.
All scenarios included the original dosing information and observed LBW as required by the PK component of the model. The time-varying FVIII activity effect on the hazard was predicted based on the individual PK parameters (PK and All) or typical PK parameters (Bleed).
3.8.1.2 Bleeding probabilistic forecast
Based on each individual random effect related to the bleeding hazard (ηihi(t)), the probability of having a bleed in the upcoming 24 hours was calculated as:
Pi(bleeding) = 1 – Si(t+24) = 1 - ݁- hiሺtሻ dt
t+24
t (eq. 6)
where Si(t) is the probability of not having a bleed between t and t+24
calcu-lated based on the time-varying bleeding hazard hi(t), and t is the end of the observation period for Bayesian forecasting.
Dosing information registered during the upcoming 24-hour period (forecast-ing period) were taken into account to the calculation of hi(t), however, doses taken between the occurrence of an observed bleed and the end of the respec-tive 24-hour period were considered to be on-demand doses, which were not included in the calculation of the probabilistic forecast.
The forecasted number of bleeds over the total study time was approximated by the sum of all Pi(bleeding) values calculated over the whole study period. 3.8.1.3 Varying the Bayesian forecasting period
In the default case, Bayesian forecasting was based on observations from the start of the study up to the end of each 24-hour period. However, to learn about the trade-off between longer observation periods and the most up-to-date
in-3.8.2 Predictive performance assessment
The comparison between the Pi(bleeding) obtained using the three information scenarios was carried out using separation plots, receiver operating character-istics (ROC) and precision-recall (PR) analyses.
3.8.2.1 Separation plots
A separation plot is a visual method introduced by Greenhill et al. in the field of political science that compares the ability to consistently match high-prob-ability predictions with the actual occurrence of events (120). These diagnos-tic plots have the advantage of not requiring the definition of probability thresholds to distinguish between the prediction of events and no-events. The creation of separation plots involved two steps. Firstly, the values of Pi(bleeding) generated throughout the study for all patients (i.e. ni · total num-ber of individuals) were sorted in ascending order. Secondly, these values were represented graphically and Pi(bleeding) values associated to days when bleeds occurred were highlighted in a different color ( ). More colored val-ues located on the right-hand side of the plot, i.e. events that are associated with a higher relative Pi(bleeding), denote a better predictive performance
(e.g. denotes a better predictive performance than
).
3.8.2.2 Receiver operating characteristic analyses
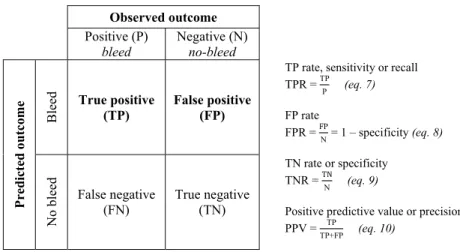
The ROC curve is a tool to visualize, compare and select classifiers based on their predictive performance (121, 122). It provides a visual summary of the trade-off between true positives (TP) and false positives (FP) as the probabil-ity threshold (in this case, Pi(bleeding)) varies. The TP rate (TPR; y-axis of the ROC curve) is given by the correctly predicted positives divided by all of the actual positives, and the FP rate (FPR; x-axis of the ROC curve) is given by the incorrectly predicted negatives divided by all of the actual negatives, as shown in the confusion matrix in Figure 5.
The area under the ROC curve (AUCROC), calculated with the trapezoidal rule,
was used to compare the different information scenarios (123). A classifier equivalent to random chance has an AUCROC of 0.5 and corresponds to a curve
that overlaps the diagonal line of the ROC plot, the random-classifier baseline. A perfect classifier has an AUCROC of 1 and corresponds to an accuracy of
100%, whereas an AUCROC lower 0.5 indicates that the FPR in greater than
Observed outcome
Positive (P)
bleed Negative (N) no-bleed
Pred ic ted ou tco m e Bleed True positive (TP) False positive (FP)
TP rate, sensitivity or recall TPR = TPP (eq. 7) FP rate FPR = FP N = 1 – specificity (eq. 8) TN rate or specificity TNR = TN N (eq. 9)
Positive predictive value or precision PPV = TP
TP+FP (eq. 10)
No bleed
False negative
(FN) True negative (TN)
Figure 5. Confusion matrix (or contingency table) and the derivation of summary in-dices.
The optimal threshold corresponds to the value of Pi(bleeding) that is optimal for discrimination between bleeds and no-bleeds (optimal trade-off between TP and FP) and was determined by the Youden’s J statistics (124). It corre-sponds to the maximum vertical distance between the ROC curve and the ran-dom-classifier baseline and is calculated as:
J = sensitivity + specificity – 1 (eq. 11)
The greater the J, the better the classification, and the threshold corresponding to the highest J was chosen as optimal. The CI of the ROC-related summary indices were calculated based on a stratified bootstrap (2000 replicates). The results of the ROC curves do not depend on the class distribution, which means that if the proportion of positive to negative outcomes changes, the ROC curves will not be affected (121, 125). This property can lead to mis-leading conclusions about the reliability of the performance of a given classi-fier if, for instance, the occurrence of positive outcomes, bleeds, is rare. 3.8.2.3 Precision-recall analyses
Precision-recall analyses are based on the same principles as ROC analyses but consider precision, the correctly predicted positives divided by all pre-dicted positives, instead of the FPR (126). In contrast to the ROC curve, PR curves are sensitive to the class distribution and were performed to comple-ment the results of the ROC analyses (125).
text is frequently called recall. A precision-recall curve above another one de-notes a better performance. The random-classifier baseline in the PR space is determined by y=P/(P+N), and in case the class distribution is balanced, the random-classifier baseline is y=0.5. The calculation of the AUC of the PR curve (AUCPR) was carried out using non-linear interpolation, as suggested by
Davis and Goadrich (126).
3.9 Software
All models were developed using non-linear mixed effects modeling in NON-MEM, version 7.3 or higher (127). The estimation methods included the first-order conditional estimation with eta-epsilon interaction (FOCE interaction) and the Monte Carlo importance sampling assisted by mode a posteriori (IMPMAP) estimation method. Bayesian forecasting was performed in NON-MEM. Perl-speaks-NONMEM (PsN, version 4.6.0 or higher) was used to as-sist model building and evaluation (128-130).
Data management and checkout, graphical and statistical analyses were car-ried out in R (version 3.2.2 or higher), including the R packages Xpose4, dplyr, ggplot2, pROC and PRROC (128, 131-135).
4 Results
4.1 Pharmacokinetic models for FVIII activity
4.1.1 Moroctocog alfa
The disposition of FVIII activity following the administration of moroctocog alfa (Paper I) was well described by a 2-compartment model with first-order elimination, parameterized in terms of clearances (CL and inter-compart-mental clearance (Q)) and volumes of distribution (V1 and V2). Covariate ef-fects related to body size, age, inhibitors, race and analytical assay were iden-tified. The model was found to describe the central trend of the data and the variability well (Figure 6). The final PK parameter estimates, including the relevant covariate effects were:
CLi (dL/h) = 2.76 · WTi
70
0.75
· age effect · 1 + 1.66 · INHi
· ( 1 – 0.347 · STUD) · ηCLi κCLik
(eq. 12)
age effect = 1.13 + 0.149 1 - 0.00678 · AGE· (AGEi - 1) ; if age ≤1 year old
i - 20 ; if age >1 year old
V1i (L) = 2.45 · WT70i 0.812 (eq. 13) Qi (dL/h) = 25.1 · WT70i 0.75 (eq. 14) V2i (L) =0.923 · WT70i 0.812
· (1 + 0.884 · RACE) · κV2ik (eq. 15)
where CLi, V1i, Qi and V2i are the ith patient CL, V1, Q and V2, respectively, WTi is the individual body weight, INH is equal to 1 for inhibitors positive (otherwise = 0), STUD is equal to 1 for study B1831090 (otherwise = 0), AGEi is the individual age (in years), RACE is equal to 1 for black race (otherwise = 0), ηCL
i is the individual random effect accounting for the individual
devia-tion from the typical value of CL with estimated IIV variability (%CV) 30.5%CV, κCLik and κV2ik are the individual occasion-specific random effects
Fi gure 6 . P opulatio n pr ed iction -co rr ected visu al pr ed ictiv e ch ecks str at if ie d by s tudy (9 6) . D ots rep resen t th e pred ictio n-corrected FVIII activity ob serv atio ns, an d th e so lid and d ash ed red lin es th e m ed ian an d t he 2 .5 th a nd 9 7. 5 th p ercen tiles of th e observ ed pr ed ictio n-co rrected data. T he sha ded areas re prese nt the 9 5% co nfi dence in te rv al f or the cor resp ond ing p ercen tiles b ased o n th e pred ictio n-co rrected sim ulat ed data.