The effects of China on the
development of African countries
A synthetic control approach for the case study of Angola
Joan Pol Mingot
International Relations
Dept. of Global Political Studies Bachelor programme – IR103L 15 credits thesis
[Spring/ 2020]
This paper explores the effects of the influence of China on the development of African countries, focusing on the case study of Angola. The term development is understood as a multidimensional concept that can be operationalised as a combination of per capita GDP, human development index (HDI) and GINI index. While HDI and GINI index have been analysed from a much more qualitative manner, this study uses the synthetic control method (SCM) to estimate the effect of China on the per capita GDP of Angola. This method compares the trajectory of per capita GDP of Angola after the engagement with China with the trajectory of per capita GDP of a synthetic counterfactual, created by a linear combination of similar countries. Results show that while Angola’s engagement with China has a substantial positive effect on per capita GDP and it has no apparent effect on HDI and GINI index.
1. Contents
2. Introduction ... 4 3. Development theory... 8 4. Literature review ... 10 5. Methodology ... 16 6. Analysis ... 25 7. Conclusion ... 37 8. Bibliography ... 394
2.
Introduction
The rise of China has become object of increasing global interest because its significance for the international system and the strengthening of South-South relations (Asongu and Aminkeng, 2013). At the same time, the expansion of the economic relations between China and Africa has been one of the most remarkable events in the developing world (He, 2013; Van Dijk, 2009). In 2008, China became a crucial player in Africa, outrunning the EU and the US as Africa major trading partner (Van Dijk, 2009). Such economic relations expand beyond trade, as China's Foreign Direct Investment (FDI) and development aid in Africa are also increasing (Asche and Schuller, 2008). Indeed, developing Asia – China in particular – is replacing the North Atlantic region as the main driving force of the global economy, and the G8 is challenged by new groupings as the BRICS (Brazil, Russia, India, China, South Africa) (Mckay, 2016:77).
The influence of China over Africa, however, is not only economic but it also reaches political arena. China's growing political engagement with the continent (Taylor, 2006: 938) resulted in a shift in the distribution of the world income in their favour, modifying the world economy from “unipolar” to “multipolar” (Wade, 2011: 347). Khong argues that the fact that China has made significant economic and political progress globally and in particular into Africa, puts China in a position with potential to replace US as the most prestigious state in the international system (Khong, 2019:120). A prestigious state in the international system, Khong argues, is the one that will govern the region, it will play a decisive role in shaping the rules of international relations and, “it will be able to translate its power into the political outcomes it desires with minimal resistance and maximum flexibility” (Khong, 2019: 120).
China’s performance in Africa is relevant to the extent that it can potentially determine the prestige that is seeking in the international community. However, in the face of the rapid evolution of China-Africa economic relations, a question emerges as to its impact on both sides, in particular to Africa. The research on this topic has mostly adopted a macroeconomic approach and has given mixed results.
5 For many African rulers, China has offered a very attractive alternative to dealing with North America and European countries (Knorringa, 2009: 183). Unlike the West, China is following an alternative development model, the Beijing consensus: non-interference policy towards state sovereignty, and does not impose governance-related conditionalities in giving aid (see section 3.1 for further explanation). In general, China offers African rulers an opportunity to escape from the Western hegemony (Konings, 2007). The narrative here is that while many Western governments and organizations may claim that the interests of Africa are a paramount matter, their paternalistic behaviour in practice might offer fewer development opportunities in comparison to a more straightforward business approach by Chinese investors (Knorringa, 2009: 183). In addition, the Chinese government states that their official policy and position toward Africa is based on a reciprocal model of “South- South cooperation”, characterised by equality, common development, and partnership of equals (Asante, 2018: 260).
However, many commentators find that China’s relations in Africa are not as transparent, nor as friendly as it can be perceived (Alves, 2013; Martuscelli, 2019; Gamso, 2019; Hodzi, 2018; Van Dijk, 2009). For example, China relations with Sudan were most criticized, specially after the International Criminal Court had announced that the Sudanese president Omar al-Bashir was indicted because of genocide and crimes against the humanity (Van Dijk, 2009b: 150). While China recognizes these abuses, on its politics of non-interference, refuses to take any initiative to prevent them. The Chinese government seems to pursue Chinese interests, no more than the Western governments, but it is selling it as a win-win situation, if not a pure development aid. Moreover, the unclear distinction between aid, trade and investments operations makes the deals not very transparent (Van Dijk, 2009b: 155).
China dealing with Robert Mugabe’s Zimbabwe portraits another example of China dealing with authoritarian governments (Van Dijk, 2009c: 164). While Western governments and international organizations promote good governance, China does not take into account whether is dealing with a fake democracy or a corrupt administration, which has been highly criticised as it reduces incentives for these governments to introduce democratic reforms (Martuscelli, 2019: 4).
6 resources, in this case, oil. China came to Angola when the International Monetary Fund (IMF) promised to lend few hundred million US dollars for the development of the economy. Immediately after, China made a counteroffer and let it be known that they would invest about one billion US dollars. Angola accepted the Chinese bid, and in return China got control of the oil sector. However, China also got involved in building infrastructure as repairing railroads or constructing roads (Van Dijk, 2009: 158).
Angola, nevertheless, is a slightly different case than the rest. First, because the fact that it was already dealing with Western donors like the IMF, is an indicator that Angola’s government fulfils a minimum set of requirements, as not being authoritarian or a completely flawed democracy. And second, because it was one of the first countries in which China became a major trading partner, overtaking the United States and the European Union (CARI, 2020).
Although, many studies give a macroscopic approach of the performance of China in Africa, not many centre in an in depth study of a country like Angola. However, the contribution of this study is the application of the synthetic control method in the measure the effect of China on the development of Angola.
The synthetic control method intends to simulate what would have been the evolution of a particular outcome (i.e. per capita GDP) of an intervened country1
if that country would not have been intervened. To simulate that, the treated country, during a defined preintervention period, is modelled as a weighted average of similar countries, the donor pool. Then that model, the synthetic control, is compared against the real outcome of the intervened country during a postintervention period.
Hence, this study asks how China has affected the development of Angola. On the basis of data from the World Bank Indicators and Comtrade data, an econometric measurement of the impact of the Chinese trade (overall manufactured exports and natural resources imports) on the development of the case study of Angola will be performed.
1 Hereafter, intervention will refer to the engagement with China. Intervened country refers to a
country that is exposed to the intervention. Preintervention period refers to period of time prior to the intervention and postintervention period a period of time after the intervention. Treated country is the country to which the synthetic control is applied, that is, Angola.
7 Several clarifications must be made. First, as mentioned before, the fact that Angola was one of the first countries in Africa to have China as a major trading partner, and has remained like this, makes it a good example to evaluate the effects of Chinese influence on Angola’s economic development. Second, it is important to note that here, trade is used as a proxy of the Chinese influence over the African country, and in this case, over Angola. Third, development is understood as a combination of three indicators: per capita GDP, human development index (HDI) and GINI index. Fourth, such econometric measurement is performed by using the synthetic control method, an influential innovation in quasi-experimental design that provides a systematic approach to building a counterfactual.
This study applies the synthetic control method to estimate the economic impact (measured in per capita GDP) of the Angola’s engagement with China in 2005. It is shown that no single country is able to closely reproduce the values of economic growth predictors for Angola before the intervention. However, a weighted average of a few African countries, namely Botswana, Chad, Co te d’Ivoire and Nigeria provides a quite close approximation of Angola from 1995 to 2005. The results inferred suggest that the engagement with China produced an increase, on average, of a 15 percent of per capita GDP, that is 476.33 USD (PPP in constant 2010 USD) per year. Parallelly, the study performs a qualitative analysis of the evolution of the HDI and the GINI index. The results conclude China does not seem to have any effect on both HDI and GINI index in Angola.
This paper consists of six sections and is structured as follows. Section 2 exposes the theoretical framework that guides this study and precisely defines how the term development will be understood and operationalised. Section 3 starts with a brief historical background of Chinese relations with Africa and ends with the review of the literature in relation to the research question. Section 4 extensively discusses the methodology of the study. It first argues why the synthetic control method has been utilised and then it explains in detail how this method works. Second, it discusses the advantages and limitations of the synthetic control method and third, it contends the case study selection, how and why Angola has been chosen to perform the study. Section 5 exposes the results of the study. It begins by constructing the synthetic version of Angola and then it first analyses, on a quantitative focus, the effects of Chinese engagement on the economic development
8 of Angola, and second offers a qualitative analysis on the development of Angola. Section 6 provides a conclusion of the study.
3. Development theory
In this section, I will set a theoretical framework from which this study will build upon. Following a positivist ontology and epistemology, I will discuss how development is understood and measured in this study.
Development remains a very contested idea, a dynamic and expanding concept. The term development has many different meanings, while many overlap, some inherently contradict each other (McGillivray, 2016: 21). In this section, I do not intend to clarify the debate on the definition of development, but to set a theoretical framework for this study, for without a definition of this term, it cannot be determined whether a country is achieving higher levels of development, or whether it should be considered developed, developing or underdeveloped.
This paper favours the understanding of development as a “good change”. That is because such meaning allows to focus on what sorts of outcomes we want to see in all countries, providing a framework to compare actual changes versus ideal ones. In addition, it also allows to determine which countries and which people within a country should be prioritized in efforts to improve human condition (McGillivray, 2016). Second, development is a multidimensional and necessarily subjective term, hence it is not about improvements according to a single criterion, but multiple criteria (Williams, 2014).
Traditional definitions of development include the Rostow-type modernization-led growth, i.e. economic growth (McGillivray, 2016: 27). Modernization is a process whereby societies gradually move through a structural transition from one condition to another. The end point is viewed as an advanced, modern society with greater reliance on the industrial sector, and a rise of the services sector including providers of health and educational services (McGillivray, 2016: 23). This was a politically liberal and economically efficient society that relied on principles of meritocracy, that is, on allowing people to achieve according to their abilities (Harriss, 2014).
9 It was observed during the 1960s and 1970s that growth via modernization strategy had achieved high rates of economic growth, however such growth was not uniform, both among and within countries (McGillivray, 2016: 27). The main critique of modernization theory was that while the rich countries were getting richer, the poor countries, while experiencing a high economic growth rate on average, were falling behind. In short, the poor countries were getting relatively poorer over time (McGillivray, 2016: 28). However, it has been demonstrated that the evolution of poverty mirrors quite closely the evolution of per capita GDP (Pinkovskiy and Sala-i-Martin, 2014: 9). That is, the driving force that explained the substantial reduction in poverty during 1990s and 2000s in Africa is economic growth, namely per capita GDP. In a similar way, within-country inequality during the same period of time also fell substantially (Pinkovskiy and Sala-i-Martin, 2014: 16). These results suggest that economic growth (i.e. per capita GDP increase) can represent a good proxy not only of economic prosperity but also of a decrease of poverty and inequality.
Nevertheless, Seers understands development in a more comprehensive way. He states that development is the realization of the potential of human personality and, operationalises such potential in three phenomena: income poverty, unemployment, and income inequality (Seers, 1972: 6). Development means a decline of all these three dimensions over time. On top of that, Seers thought that the fulfilment of human potential also required adequate education levels, freedom of speech and national political and economic sovereignty (Seers, 1972). Similarly, Sen defines development as an expansion of capability, that is, an enlargement of people choices. More precisely, he argued that development implied the removal of unfreedoms that leave people with little opportunity of exercising their agency (Sen, 1990). The UNDP relied heavily in Sen’s work in articulating and designing the Human Development Index (HDI), which is arguably the most widely used indicator of the level of development among countries (McGillivray, 2016: 34). HDI is a composition of three dimensions of development: long and healthy life, knowledge, and decent standard of living, which are measured by three indicators life expectancy index, education index and Global National Income (GNI) index respectively (UNDP, 2020).
In addition, complementing the findings of Pinkovskiy and Sala-i-Martin’s (2014) findings, this study will use GINI to assess inequality. GINI index (or
10 coefficient) is an estimation of the ratio between the cumulative measure of the percentage share of total income over the number of individuals in a region (Clarke, 2016: 201). A high GINI index shows high levels of inequality within that region, while a low value of the GINI index indicates low levels of inequality. The GINI index ranges from 0, complete equality, to 1, complete inequality.
This study will define development in a pragmatic and measurable way, therefore, building upon the different approaches described above, development will be understood as a multidimensional term. That is, a combination of economic growth, decrease of inequality and decrease of poverty which can be operationalised by per capita GDP. And increase of life expectancy, education index, and GNI which are operationalised by the HDI. Plus, the measure of the GINI index, which represents a much more direct way to measure inequality, and hence complements the values of per capita GDP.
4. Literature review
This study seeks to answer what is the impact of Chinese engagement with Africa, with a focus on the case study of Angola. In this section, I will review the existing literature in relation to the research question. Firstly, I will present a brief historical background on the Sino-African relations as well as the contrast between the Washington consensus and the Beijing consensus, two development models implemented by the West and China respectively. Secondly, I will assess the most common approaches of the effects of China’s economic involvement in Africa on the development of African countries.
4.1 Historical background
This introductory section briefly presents the historical background of China’s involvement in Africa relevant to the research question. China’s presence in Africa dates back to the end of the World War II (Asante, 2018: 261), however it was not until the beginning of the new millennium that, after two decades of fast growth, China’s domestic economy had reached a stage where it was compelled to look overseas (Alves, 2013:208). Currently the focus of China’s presence in Africa is
11 based on aid, trade, and investments. Examples are the Chinese involvement in the oil sector in Angola, Nigeria and Sudan or its activities in the mining sector, namely, copper and cobalt in Congo and platinum in Zimbabwe (Van Dijk, 2009: 10).
Such combined use of aid, trade and investment requires political coordination, and China has developed a strategy of action with respect to Africa, that includes, at least, eight different objectives. These are: (1) assure the supply of raw materials for China, including agricultural products, (2) create a market for Chinese products and services, (3) obtain land for agricultural purposes, (4) channel migration of Chinese people to Africa, (5) gain diplomatic support from African countries, (6) present an alternative to the Western development model, (7) provide an alternative to Western development cooperation and (8) emphasize China’s status as a superpower (Van Dijk, 2009: 12).
The first four objectives refer to the economic side of China’s relations with Africa, which demonstrate how China dictates the terms of the agreement, as it is seeking to secure natural resources, expanding its exporting market and lease the land to create employment opportunities to Chinese people. In contrast, the last four objectives allude to the political nature of China’s presence in Africa. The emergence of China in Africa challenges the hegemony of US and EU in the continent (Campbell, 2008: 91). China is reordering the international system through the introduction of a new development model, the Beijing Consensus (Ramo, 2004), as an alternative to the classical development model pushed by the West, the Washington Consensus (see Table 1).
The Washington Consensus has been mainly criticised because of its driving policy “one size fits all”, which it fails to understand the economic structures of developing countries, and to recognize that there are fundamental differences between individual countries (Stiglitz, 2006). Crucially, it is increasingly recognized that the Washington Consensus’ policies are counter-productive and need to be replaced by strategies that acknowledge local conditions and priorities, and national and regional governments are the ones to design such initiatives (Mckay, 2016b: 95).
In addition, the Global Financial Crisis (GFC) largely questioned the neoliberal, American-style development model, and shifted the attention to the Chinese model, i.e. the Beijing Consensus (Asante, 2018: 263).
12 Table 1 displays how two approaches differ concerning the role of the government in the economy and the view on political issues. Particularly, China defends a non-interference policy and advocates for a South-South cooperation to counter the over-dependence on the Atlantic powers (Asante, 2018: 263). However, there are some contradictions in the table. On the one hand, China shows Africa how globalization is beneficial for a developing country, but on the other hand Chinese companies invest in Africa but keep control over its technology (Van Dijk, 2009: 22). Unlike the West, Chinese government does not impose conditions on Chinese loans, but the aid is tied and needs to be spent in Chinese goods and services. On top of that, Chinese government sometimes supports regimes that are not supported by the West, like Mugabe’s authoritarian regime in Zimbabwe (Van Dijk, 2009: 154). Hence, this unconditional aid by China can potentially weaken the good governance pushed by Western donors. Indeed, the World Bank and the International Monetary
Table 1 Development model of the Washington Consensus versus the Beijing Consensus
Washington Consensus Beijing Consensus Economically
Free markets and promotion of the private sector
Loans under strict conditions Use of local companies to create
employment
Capacity building of technology, knowledge, and experience
Government plays an important role in the economy
No conditions for soft loans
Use of Chinese companies, employment, and technology No transfer of knowledge and
experience Politically
Democracy Liberalization
Limited time for political functions
No recognition of Taiwan
Political support for China in the UN and other international fora Stability is important
13 Fund (IMF) were not happy with the Beijing Consensus and have indicated that it undermines their policy (Van Dijk, 2009: 23).
However, China is a developing country itself and, undeniably opens new economic possibilities for Africa. China’s rapid rise out of poverty portraits a model for African nations in the post Bretton Woods era of globalization (Friedman, 2009:2). Moreover, China’s governing model (the Beijing consensus) is more appealing to the developing world than Western’s market-democratic model. “Given a choice between market democracy and its freedoms and market authoritarianism and its high growth, improved living standards and limits on expression, a majority in the developing world and non-Western powers prefer the authoritarian model” (Halper, 2010: x).
4.2 Common approaches
China has been present in Africa for a long time, and as the previous section exposes, its influence into the African continent has been gradually growing. This study asks how such influence has affected the development of African countries, focusing on the case study of Angola. This section discusses four different approaches in concern of the impact of China in Africa.
Hodzi (2018) criticises the narratives in the discourse on China-Africa engagement that China is developing Africa. He defends that such approach does not consider the agency of Africa’s political elite (Hodzi, 2018: 191). Hodzi performs a historical analysis showing that during decolonization a political elite seized the economy through nationalisation and indigenisation of foreign and private companies (2018: 194). Hodzi uses the Economist Intelligence Unit’s 2016 Democracy Index to classify African countries in either hybrid or authoritarian regimes.
In addition, Hodzi argues that the absence of political conditions on Chinese financing and development assistance enables Africa’s authoritarian regimes to circumvent the stringent accountability and governance set by the Western countries and financial institutions. Particularly, Angola dismissed the IMF and its political and economic reforms in favour of the China Export Import Bank which gave financing without conditions attached (Hodzi, 2018: 198). Hence, Hodzi
14 ultimately concludes that historically the political elites have had the executive power of the state, and therefore national development is not achieved through the efforts of foreign trading partners, either China or the West matters not (2018: 202). However, other authors (Alves, 2013; Martuscelli, 2019) suggest that China's relations with Africa have affected in different ways to several dimensions of development. Alves argues that Chinese influence produces mixed effects on African economy. On the one hand, the provision of infrastructure is making a strong contribution to the economy in a significant number of African countries, hence potentially improving the lives of millions of people. In addition, China’s loans offer better repayment, that is, lower interest rates and longer reimbursement time frames. And, most importantly, China provides an alternative funding source which increases African countries’ bargaining power in relation to traditional donors (Alves, 2013: 218).
On the other hand, the existing flaws in terms of labour practices, local content, governance, debt sustainability and environmental impact threaten to perpetuate the inequality indicators if not properly addressed (Alves, 2013: 221). On top of that, Chinese loans are tied to acquisitions in China, which potentially hinders the host economy. Not only is there a limited subcontracting of local services by Chinese contractors, but the local contractors choose to subcontract Chinese companies to develop the projects since it works out cheaper. The fact that materials and equipment are imported from China represents a missed opportunity for local construction industry to develop and embodies a real threat to its survival. As it reinforces unfair competition for local construction businesses (Alves, 2013: 218).
These construction projects also create only a small number of job opportunities for locals, as Chinese companies prefer to bring most of their labour force from China: because it is generally less expensive and it is easier for Chinese companies to work with, i.e. no language or cultural barriers. Hence, following the development model of the Beijing consensus, very few skills are transferred to locals (see table 1) (Alves, 2013: 218).
Alves’ study, based on primary sources (namely, observations and interviews in southern Africa and China between 2008- 2013) and complemented by secondary sources, gives a macroscopic approach of the effects of Chinese influence on the African continent, and considers different dimensions of development like economic
15 growth, governance or labour rights. Her analysis is rather qualitative and, while providing many examples of Chinese impact in Africa, does not provide quantitative data as to what extent development has been affected.
In contrast, Martuscelli offers a more pessimistic view about China's involvement in Africa. He compares China's reasons to engage with Africa with that of the Western countries and, concludes that both share the same interests of securing natural resources and seeking new markets for exports (2019: 14). However, while Western institutions tend to discriminate against countries with poor governance, low property rights and scarce rule of law, China remains indifferent to the quality of institutions of the host country (Martuscelli, 2019: 5). Indeed, African corruption increases in Chinese project sites, whereas in World Bank projects, due to its implementation of anti-corruption policies, does not seem to happen (Isaksson and Kotsdam, 2018). Moreover, China’s strategy in Africa has been severely criticized in Europe on the grounds that it neglects human rights, corporate social responsibility, and environmental and social standards (European Parliament, 2008). Critics argue that China is using its influence to weaken the international human rights regime while simultaneously empowering abusive governments in the developing world (Gamso, 2019: 722).
In sum, Martuscelli by centring on the economic literature with quantitative focus, acknowledges the positive growth effects of African countries but is sceptical about the sustainability of China's modus operandi and even suggests that the current performance could severely hinder structural transformation and future growth prospects. In particular, the already fragile manufacturing sector in Africa could be adversely affected by Chinese competition, and the increasing natural resource specialization of African countries can potentially undermine diversification.
In contrast, He (2013) defends that African countries have strongly benefited from their cooperation with China. He uses Comtrade panel data of 86 countries covering five manufactured goods over a period from 1988 to 2005 to assess the impacts of China’s exports in comparison with those from US and France, to Sub-Saharan Africa (2013: 37). He finds that Chinese imports have a positive impact on Sub-Saharan Africa countries’ in all five sectors, while imports from the US and France have none. This is explained with a South-South trade model in which
16 developing countries can benefit more from importing from a Southern partner due to the weak absorptive capability of new technologies than from a Northern and high developed partner with very advanced technology (2013: 28). Hence, China’s increasing trade with Africa is helpful to African economic development.
In conclusion, the existing literature mainly gives a macroscopic approach of the effects of China's involvement into the African continent. In particular, China’s development model (the Beijing Consensus) has raised some criticism about how it can hamper the growth of local businesses, potentially undermine Western development initiatives, and intentionally empower abusive governments and facilitate violations of human rights (Alves, 2013; Martuscelli, 2019; Hodzi, 2018, Gamso, 2019). Nevertheless, it has been argued that China represents an alternative funding source for developing countries, as well as a great catalyst for economic growth in the continent (Alves, 2013; He, 2013).
Such macroscopic approaches extensively analyse the relations between China and Africa but are lacking econometrics tests in an in-depth of case study. Hence, this paper aims at contributing to the existing literature as to providing an in-depth case study of Angola on the effects of Chinese influence on the country, by performing econometrics tests based on a quasi-experimental method, the synthetic control method.
5. Methodology
In this section I discuss the methodology of this study, which is divided in three chapters. The first chapter extensively explains the synthetic control method and how the algorithm is constructed to produce valid knowledge. The second chapter focuses on the limitations and advantages of the synthetic control method when applied to the case study of Angola. And the third one explores the case study selection, the variables used in the analysis and the data sources.
Before embarking on the formal description of the synthetic control method chosen for this study, it is important to mention why such method has been used. As a first approach, I intended to perform a multivariate analysis of 53 countries in Africa, over a period of 25 years and operating with 6 independent variables to describe development. After constructing the model, however, the results were
17 inconclusive. The model was constructed under the assumption that African economies would tend to converge in a similar way like in other regions in the world. However there is no support for conditional convergence in Africa (Baliamoune, 2009; Sajoux et al., 2015). In short, the model can only be applied when the countries in the region share similar institutions. Alternatively, I applied a quasi-experimental design, the synthetic control, focused on the case study of Angola to deal with the fact that African countries in the region have different institutions.
5. 1. The Synthetic Control Method
The synthetic control method (SCM) developed by Abadie and Gardeazabal (2003), and extended and implemented in comparative politics in Abadie, Diamond and Hainmueller (2015), can produce promising results applied to the impact of China on the economic development of Angola. Under this approach, a weighted combination of potential control countries, the synthetic control, is constructed to approximate the most relevant characteristics of the country affected by the intervention (Billmeier and Nannicini, 2013). After Angola, the treated country, is affected by the intervention, the engagement with China, the SCM is used to estimate the counterfactual situation of Angola in the absence of such intervention by looking at the outcome trend of the synthetic control (Abadie et al., 2015).
Suppose that there is a sample of N+1 units (i.e. countries), among whom, 1, is the unit of study (Angola) and the rest, N, are potential comparisons, which constitute the donor pool. Because comparison units are used to approximate the counterfactual of the case of interest without the intervention, it is important to define which units can be eligible for the donor pool. Such units must fulfil two requirements. First, the units must not be affected by the intervention during the sample period of study and, second, to avoid interpolation biases, units must be similar to the unit of interest (Abadie et al., 2015: 500). To account for this similarity2, which includes factors as cultural proximity and economic development
(see section 4.3), the countries used in the donor pool belong to the same geographic
2 Note that here similarity, as it will be further explained in section 4.3, accounts for close values of
different indicators. Those are similar per capita GDP, primary education index, unemployment rate, natural capital, trade, capital formation and industry formation. Such similarity does not refer to institutions.
18 region, that is the African continent. This study investigates the effects of Chinese influence on the economic development of Angola. Angola’s relations with China begin to become substantial in 2005 (see Table 2). Therefore, the unit of interest is Angola in 2005 and the set of potential comparisons is a sample of African countries. This study uses a balanced panel data, which means that each panel unit (country) is observed the same time periods, 𝑡 = 1,… , 𝑇. And the panel includes a positive number of preintervention periods, 𝑇0, and a positive number of postintervention periods, 𝑇1, with 𝑇 = 𝑇0 + 𝑇1. The unit of study is exposed to the intervention during periods 𝑇0+ 1, … , 𝑇, and the intervention has no effect during periods 1,… , 𝑇0. The goal of the study is to measure the effect of the intervention of interest on some postintervention outcome. Hence, in our case the preintervention period is from 1995 to 2004, and the postintervention period is from 2005 to 2010, as from 2005 onwards Angola is engaged with China. In addition, the postintervention outcome measured in this study is the GDP per capita (see section 4.3).
As explained above, SCM intends to create an approximation of the preintervention characteristics of the treated unit by interpolating similar untreated units. The synthetic control is defined as a weighted average of the units in the donor pool. Formally, let the synthetic control be represented by a (𝑁 × 1) vector of weights, 𝑊 = 𝑤2, … , 𝑤𝑁+1, with 0 ≤ 𝑤𝑗≤ 1 for 𝑗 = 2, … , 𝑁 and 𝑤2+ ⋯ + 𝑤𝑁+1 = 1. This means that each component, 𝑤𝑗, can be understood as the contribution that every untreated unit from the donor pool has on the construction of the synthetic control.
However, how do we find the optimal values that best recreate the characteristics of the treated unit? Abadie et al.’s (2015) study proposes the following. Let 𝑋1 be a (𝑘 × 1) vector containing the values of the preintervention characteristics of the treated unit that we aim to reproduce as accurate as possible, and let 𝑋0 be the 𝑘 × 𝑁 matrix containing the values these variables for all the 𝑁 countries in the donor pool. Both 𝑋1 and 𝑋0 may include preintervention values of the dependent variable as well. As mentioned above, in our case, the dependent variable is the GDP per capita and the characteristics refer to the set of predictors which are, to see some examples, primary education enrolment rate or capital formation among others (see section 4.3).
19 The vector 𝑋1− 𝑋0𝑊 gives the difference between the values of the preintervention variable of the treated unit and a synthetic control. Let 𝑊∗ be the
synthetic control vector that minimizes such difference, the one that we select for our study. To find this vector, if 𝑚 = 1, … , 𝑘 is the set of variables used, let 𝑋1𝑚 be the value of the 𝑚-th variable for the treated unit and let 𝑋0𝑚 be a 1 × 𝑁 vector collecting the values of the 𝑚-th variable for the units in the donor pool. Abadie et al.’s (2015) study finds 𝑊∗ as the value of 𝑊 that minimizes the summation,
∑ 𝑣𝑚( 𝑋1𝑚− 𝑋0𝑚𝑊)2 ,
𝑘 𝑚=1
(1)
where 𝑣𝑚 is a weight that indicates how important is the 𝑚-th variable when we measure the difference between 𝑋1 and 𝑋0𝑊. Therefore, the variables that are considered to have a large predictive power on the outcome of interest will be assigned a large 𝑣𝑚 weight. According to Abadie et al.’s (2015) study, to find the 𝑣𝑚 weights a cross-validation method is applied.
Let 𝑌𝑗𝑡 be the outcome of unit 𝑗 at time 𝑡 . And let 𝑌1 be a (𝑇1× 1) vector containing the postintervention values of the dependent variable for the treated unit – in our case the GDP per capita of Angola from 2005 to 2010. Similarly, let 𝑌0 be a (𝑇1× 𝑁) matrix, where each column contains the postintervention values of the dependent variable of each unit in the donor pool – in our case the GDP per capita from 2005 to 2010 of every country in the donor pool. The comparison of postintervention outcomes between the treated unit, which is exposed to the intervention, and the synthetic control, which is not exposed to the intervention, 𝑌1− 𝑌0𝑊∗, gives the synthetic control estimator of the effect of the treatment.
Hence, for a postintervention period 𝑡 ≥ 𝑇0, the synthetic control estimator of the effect of the treatment is,
𝑌1𝑡− ∑ 𝑤𝑗∗𝑌 𝑗𝑡. 𝑁+1
𝑗=2
In sum, the synthetic control algorithm estimates the missing counterfactual as a weighted average of the outcomes of the units in the donor pool. The weights are chosen so that the preintervention outcome and preintervention characteristics of the synthetic control, 𝑋0, are very similar to those of the treated country,
20 𝑋1 (Billmeier and Nannicini, 2013: 987). Hence, the matching variables of 𝑋0 and 𝑋1 are meant to be predictors of postintervention outcomes. These predictors are not affected by the intervention. In our case, as it will be described in the Analysis section, a weighted average of similar countries to Angola is constructed to estimate the counterfactual GDP per capita that Angola would have had if it had not been engaged with China.
To perform the calculation and computation of synthetic controls, I use Rstudio which is an integrated development environment for R, a programming language for statistical computing and data analysis. Namely, I use the freely available scripts written for R and developed by Abadie et al. (2011).
5.2 Advantages and limitations of the SCM
One of the main advantages of the SCM is that it facilitates comparative case studies when no single untreated unit provides good comparison for the unit affected by the intervention (Abadie et al.,2015). In addition, the SCM comes with strong advantages of transparency, as the weights in 𝑊∗ identify the countries that
are used to estimate the counterfactual outcome of the treated unit (Angola). SCM also provides flexibility as the set of 𝑁 potential controls (countries in the donor pool) can be appropriately restricted to sharpen the country comparisons and make them more sensible (Billmeier and Nannicini, 2013: 987).
One of the potential limitations, general to all statistical inference methods, is related to the robust association of variables. That is to what extent our variables are causally related. This requires three conditions: statistical association, appropriate time ordering and elimination of other possibilities (Halperin and Heath, 2017:418). Two or more variables are statistically associated when a change in the value of the first entails, in some way, a change in the value of the second or vice versa. However, sheer association is necessary but is not sufficient, for there must be correct time ordering. If variable X causes variable Y, X must be temporally prior to Y (Halperin and Heath, 2017: 394). And elimination of other possibilities, alludes to the fact that behind a bivariate relationship, potentially there can be other factors that could account for it (Halperin and Heath: 2017: 418).
21 In this study, to demonstrate a robust statistical association and proper time ordering between variables, I will use variables that have been defined in the literature section and have been used in previous studies, and therefore their association and causality has already been tested. In regard to the elimination of other possibilities, the synthetic control method does provide a compact solution. Indeed, one of the critiques of the SCM points out that the applicability of the method may be restricted by the presence of unmeasured factors affecting the outcome variable as well as by heterogeneity in the effects of observed and unobserved factors (Abadie et al., 2015: 498). Hence, Abadie et al.’s (2010) study argues that if the number of preintervention periods in the data is large, matches on preintervention outcomes helps control for unobserved factors and for heterogeneity of the effect of observed and unobserved factors on the outcome of interest. In other words, once it has been shown that the country representing the case of interest and the synthetic control present similar behaviour on the outcome variable over extended periods of time prior to the intervention, then any discrepancy between the trajectories of the outcome variable after the intervention is interpreted as produced by the intervention itself (Abadie et al., 2010 viewed in Abadie et al., 2015: 498).
Another limitation of SCM is that it does not allow assessing the significance of the results using tradition inferential techniques because the number of observations of the countries in the donor pool and the number of periods covered by the sample are relatively small (Billmeier and Nannicini, 2013: 987). However, Abadie et al. (2010) suggested that by systematizing the process of estimating the counterfactual of interest, SCM allows to conduct a range of falsification exercises, which they call placebo tests, that provide the tenets of an alternative mode of qualitative and quantitative inference. Essentially, this approach is based on the premise that the synthetic control estimate reflects univocally the impact of the intervention on our dependent variable during the postintervention period, therefore if we obtained similar results where the intervention did not take place or during periods when the intervention did not take place, it would severely undermine the results of the study. Hence, Abadie et al.’s (2010) study distinguishes two placebo tests, the in-time placebo and in-space placebo.
22 In-time placebo test consists of applying the synthetic control during periods when the intervention did not take place. In the case study of Angola, explained in the next section, I consider the effect of China-Angola relations on the economic development of Angola. China became a major trading partner of Angola in 2005, which is conceived as the threshold of the intervention (see section 4.3), as the data collected start from 1995, it can test whether the method produces large estimated effects when applying to a period prior to the intervention. If the findings show estimated effects that are of similar or larger magnitude than the one estimated for 2005, the confidence in the results of the study would substantially diminish. Therefore, in such case, placebo in-time test would suggest that synthetic controls do not provide significant predictions of the trajectory of the outcome variable in Angola after the engagement with China. Nevertheless, as it will be shown in the next section, there is no remarkable effect when the synthetic controls are artificially assigned to a period before the engagement with China.
In-space placebo test consists of the application of synthetic controls to the other countries in the donor pool, which have not been exposed to the intervention. Here, if similar or larger estimates are observed when the intervention is artificially reassigned to countries not directly exposed to the intervention, then the assumption that the synthetic control estimate reflects univocally the effect of the intervention would be severely undermined (Abadie et al., 2015: 500). To do so, the synthetic control algorithm will be sequentially applied to every country in the donor pool and compared with the baseline results. Hence, the aim of the test is to assess whether the synthetic control estimates for the treated country are large relative to the effects for countries chosen randomly (Billmeier and Nannicini, 2013: 987). In our case, it will be shown that the synthetic control estimate is very large relative to the distribution of placebo estimates for the countries in the donor pool. Finally, the applicability of the SCM requires a large number of preintervention periods. That is because the credibility of the synthetic control depends upon how well it tracks the trajectory of the treated unit’s characteristics and outcomes over an extended period of time prior to the intervention (Abadie et al., 2015: 500). In our case, there are 10 years of preintervention time before Angola becomes a major trading partner of China.
23
5.3. Case study selection
This study aims at assessing the impact of the Sino-African relations on the economic development of African countries, focusing on the case study of Angola. To operationalise such relations, I will focus on economic relations, namely trade. Although, as mentioned above, Chinese foreign direct investment (FDI) and development aid are also increasing in Africa, little is known about the geographical distribution of China’s FDI and, China provides no statistics on its aid (Van Dijk, 2009: 56). In addition, even when looking at these data, the weight that FDI and aid represents from the total capital exchanged between China and Angola is very little compared to trade, especially in the early stages of Chinese-Angolan relations, which
is the period that this study will analyse. Therefore, due to its lack of transparency and the small contribution given by aid and FDI, this paper will focus on trade as a proxy of economic relations.
Table 2 List of countries in Africa and the year China surpassed the 10 percent share in trade
Country Year Country Year Country Year
Algeria No Eritrea 2011 Mozambique 2011
Angola 2005 Eswatini No Namibia No
Benin 2000 Ethiopia 2012 Niger No
Botswana No Gabon 2014 Nigeria 2013
Burkina Faso No Gambia 1993 Rwanda No
Burundi No Ghana 2011 Senegal 2014
Cabo Verde No Guinea 2011 Seychelles No
Cameroon 2012
Guinea-Bissau No Sierra Leone 2011
CAR No Kenya 2012 Somalia No
Chad No Lesotho No South Africa 2011
Comoros 2015 Liberia No South Sudan No
Congo, DR 2008 Libya 2018 Sudan 2001
Congo 2004 Madagascar 2011 Tanzania 2010
Côte d'Ivoire No Malawi No Togo 2003
Djibouti No Mali No Tunisia No
Egypt 2012 Mauritania 2006 Uganda No
Equatorial
Guinea 2013 Mauritius No Zambia 2009
Morocco No Zimbabwe 2013
Notes: From the 54 countries in Africa, São Tomé and Príncipe is excluded due to lack of data.
24 For the SCM to work, the study needs to have a concrete intervention time. As mentioned above, the intervention is the engagement of China and Angola, i.e. the trade exchanged between both countries. Trade, however, is a continuous variable, which means that, usually, it does not suddenly happen, but it gradually builds up. By looking at a sample of 15 countries and looking at their major trading partner share, there appears to be a threshold at 10 percent. In other words, in average, two countries can be considered major trading partners if there is, at least, a 10 percent
share of the total trade in respect to the other trading partners. Table 2 displays all the countries in Africa and the respective year China surpassed the 10 percent share of the total trade in that country. Data shows that when an African country surpasses the 10 percent share threshold with China, the share tends to gradually increase over the years, therefore, as the SCM requires, the intervention stays active during the postintervention period. The countries which China has never surpassed the 10 percent threshold are represented as a “No” in the table.
Why take Angola as a case study? When looking at Table 2, it can seem that many other countries would have been good candidates for a case study, however that is not the case. From requirements of the SCM, it is necessary to have a large preintervention period, as well as a large amount of countries without the intervention that could serve to build the donor pool. Hence, the SCM constraints the sample from both ends. Due to data availability, the sample comprises observations from 1992 to 2017. Considering that China overtook the US and EU as major trading partner in 2008 in Africa (Van Dijk, 2009), the 10 percent share threshold should fall before that. Thus, Angola not only fulfil all stated requirements, but also portrays a good example as a country that made use of the Chinese development model rather than the Western one (Ovadia, 2018: 588).
This study uses annual country-level panel data for the period 1995-2010. China became a major trading partner of Angola in 2005, giving a preintervention period of 10 years. After 2010, China started to surpass the 10 percent share in trade in many countries, hence, to have a relatively sizeable donor pool, the sample period ends in 2010, as countries in the donor pool must not be exposed to the intervention during the 15-year analysis period. In addition, a 5-year period after the intervention is a reasonable limit on the span of a plausible prediction. The synthetic Angola is constructed as a weighted average of potential control countries in the
25 donor pool. Such donor pool consists of a sample of 21 African countries: Algeria, Botswana, Burkina Faso, Burundi, Cameroon, Chad, Côte d’Ivoire, Egypt, Eswatini, Ghana, Guinea, Malawi, Mali, Morocco, Niger, Nigeria, Rwanda, Senegal, Tunisia, Uganda and Zimbabwe. To construct this sample, I started with the 43 African countries that were not exposed to the intervention during the 15 years of the study (1995-2010). Most countries like Sudan, South Sudan, Somalia, Libya, Eritrea, Ethiopia, Liberia, Namibia, Seychelles, Equatorial Guinea, and Djibouti had to be excluded due to severe lack of data on numerous indicators. Other countries like Mauritius and South Africa were excluded as their economies are too different from Angola. Finally, the rest of the countries were excluded from the sample because of continuous dissimilarities with Angola in the other predictors. It is important to note that, when included in the sample, these last 10 countries obtain zero weights in the synthetic control for Angola.
The dependent variable (or outcome variable), 𝑌𝑗𝑡, is the real per capita GDP in country 𝑗 at time 𝑡. GDP is Purchasing Power Parity (PPP) adjusted in 2010 US dollars (USD). For the preintervention characteristics in 𝑋1and 𝑋0, the study relies on a standard set of economic growth predictors: per capita GDP, trade as a percentage of the GDP, unemployment rate (percentage of the total labour force), natural capital per capita, primary school enrolment, industry (including construction) as a percentage of the GDP and capital formation as a percentage of the GDP. Apart from these indicators, I have experimented with a wide set of additional growth predictors, however their inclusion did not provide any major change in the results.
All data is taken from World Development Indicators and Wealth Accounts databases of the World Bank, the UNDP database, and the UN Comtrade database.
6. Analysis
In this section, the synthetic control method is applied to compare the evolution of per capita GDP of Angola with its synthetic counterpart. This section is divided into three chapters. The first chapter exposes how the construction of the synthetic control for Angola has been conducted. The second one, discusses the effects of China involvement with Angola on the economic growth of Angola. The
26 third chapter concludes with the effects of China on the development of Angola, which consists of a qualitative analysis of two other dimensions of development, the human development index (HDI) and the GINI index.
6.1 Constructing a synthetic version of Angola
Implementing the techniques described in the methodology section, a synthetic Angola is constructed with weights chosen so the resulting synthetic Angola best reproduces the values of the predictors of per capita GDP in Angola during the period before the intervention, when China did not surpass the 10 percent share in trade of Angola.
Following the template of Abadie et al.’s (2015) study, a cross-validation technique is used to determine the optimal 𝑣𝑚 values in Equation (1). To do so, the weights 𝑣𝑚 are selected so the resulting synthetic control minimizes the root mean square prediction error (RMSPE) over the preintervention period. This cross-validation technique is useful because it allows to know which predictors are more relevant to construct the synthetic control for Angola, and therefore it minimizes the out-of-sample prediction errors. Hence, the most important predictors chosen by the cross-validation technique are (ordered from the highest weight to the lowest): per capita GDP (0.22), unemployment rate (percentage of the total labour force) (0.14), capital formation (0.13), natural capital per capita (0.13), trade as a percentage of the GDP (0.10), primary school enrolment (0.08), and industry (including construction) as a percentage of the GDP (0.07). The effect of the influence of China on per capita GDP in Angola is estimated as the difference in per capita GDP levels between Angola and its synthetic version during the postintervention period, i.e. after China surpassed the 10 percent share in trade in 2005.
27 Table 3 displays the weights of the synthetic control for Angola. The synthetic Angola is a weighted average of Botswana (27%), Chad (19%), Côte d’Ivoire (4%), and Nigeria (50%). All other countries in the donor pool obtain a weight of zero.
Table 4 shows the preintervention characteristics of Angola in comparison to those of synthetic Angola, and also to those of a weighted average of the 21 African countries in the donor pool, which it will be called the sample mean. Hence, the ideal scenario would be that the values scored by the synthetic Angola match exactly with those of the actual Angola. Although, that is not the case, overall, the results in Table 4 suggest that the synthetic Angola represents better the actual Angola than the sample of countries in the donor pool. The only predictor that presents a better match on the sample mean than on the synthetic Angola is unemployment rate.
It is important to note that in other studies where the synthetic control method has been applied (Abadie et al., 2015; Billmeier and Nannicini, 2013), the
Table 3 Synthetic weights for Angola
Country Synthetic Control Weights
Botswana 0.27
Chad 0.19
Côte d’Ivoire 0.04
Nigeria 0.50
Table 4 Economic growth predictor means before the intervention
Angola Synthetic Angola Sample mean
Natural Capital 38490 26277.03 9156.19 Trade 101.07 56.89 56.01 Unemployment 3.84 7.5 7.12 Industry 61.757 32.73 24.34 Primary 62.94 68.51 68.52 Capital Formation 30.74 30.96 20.09 GDP per capita 2597.5 2561.8 1436.1
Notes: All predictors are averaged from 1995 to 2004. The last column shows the average of all the countries in the donor pool.
28 values scored by the synthetic control match more accurately the values of the treated unit. That can be explained because the region where the synthetic control method is applied in this study, Africa, is particularly heterogeneous in terms of its economy (Baliamoune, 2009; Sajoux et al., 2015). This means that as countries in Africa differ substantially to each other, unlike, say, Europe, the values of the synthetic Angola do not perfectly pair the ones of the actual Angola. However, as it will be shown in the next section, a synthetic control can accurately reproduce the preintervention per capita GDP trajectory for Angola.
It is important to recall that one of the biggest advantages of the synthetic control method is that, unlike other inference methods, it provides a quantitative tool to validate comparison units (Abadie et al., 2015). Thus, in this study such transparency translates into Nigeria, Botswana, Chad, and Co te d’Ivoire coming out as the potential controls for Angola.
6.2 The effect of China on the economic growth of Angola
Figure 1 shows per capita GDP of Angola and its synthetic counterpart from 1995 to 2010. The vertical dotted line, set in 2004, indicates the threshold of the intervention, from 2004 onwards China surpassed the 10 percent share in trade in Angola. As it can be observed, the trajectory of the synthetic Angola’s per capita GDP prior to the intervention reproduces almost exactly that of the synthetic Angola. This close fit of both trajectories of per capita GDP along with the results obtained in table 4 demonstrate that there is a combination of countries that accurately clone the economic characteristics of Angola before the intervention. Therefore, as the combination of counties in the donor pool presents a very close reproduction of Angola during 10 years of preintervention period, the same combination can be trusted after the intervention, without extrapolating outside of the support of the data for the donor pool.
29 However, Figure 1 also shows that after 2004 the two series begin to diverge. Such divergence between Angola and its synthetic version indicates how the intervention affected Angola. It is important to point out that around 2008 both trajectories experience a small recession, that is due to a mixed effect of the Global Financial
3 Note that the vertical dotted line is set in 2004, and not in 2005. That is because 2005 is the
threshold of Angola’s engagement with China, hence I set the line on 2004.
Figure 1 Per Capita GDP (PPP 2010 USD) of Angola versus Synthetic Angola
Notes: The vertical dotted line indicates the year of the intervention3.
1500 2000 2500 3000 3500 4000 1995 1996 1997 1998 1999 2000 2001 2002 2003 2004 2005 2006 2007 2008 2009 2010 P er C a p it a G DP Year Angola Synthetic Angola
30 Crisis and the decrease of the percentage share in trade of China in Angola. In 2008 Angola’s percentage share in trade with China dropped from almost 32 percent to 21 percent in 2009, and to 29 percent in 2010. However, this global shock can be ignored as it affects both trends in a similar way, therefore, the difference between the two trajectories indicates the effect of China in Angola’s per capita GDP when it became a major trading partner of Angola in 2005.
Let us move on to how the impact can be quantified. The estimation of the effect of China on per capita GDP of Angola is given by the difference between the per capita GDP of Angola and its synthetic version, viewed in Figure 2. During the preintervention period, until 2004, the difference is close to zero, making apparent its substantial resemblance. However, after the intervention, the trajectory takes off, showing that the per capita GDP of Angola is notably higher than its synthetic counterpart. Table 5 exposes specifically what is the absolute and relative growth of the per capita GDP during the postintervention period 2005-2010.
In average, over the entire period, per capita GDP was increased 476.33 USD (PPP in constant 2010 USD) per year, which accounts approximately to an increase of the 16 percent of the 2005 baseline level. The highest point appears to be in 2008 where the difference is the 653 USD and a relative growth of almost 22 percent.
Figure 2 Per Capita GDP gap between Angola and Synthetic Angola
Notes: The vertical dotted line indicates the year of the intervention. -800 -600 -400 -200 0 200 400 600 800 1995 1996 1997 1998 1999 2000 2001 2002 2003 2004 2005 2006 2007 2008 2009 2010 G a p i n p er c a p it a G DP Year
31 Hence, the study finds that China becoming a major trading partner of Angola affects positively on per capita GDP.
To assess the fitting of the data, this study uses R-square and the mean absolute percentage error (MAPE). R-square describes the proportion of the variation of the dependent variable that the model is able to explain (Halperin and Heath, 2017: 403). Hence, the result obtained for the R-square in this study is 0.91. This means that 91 percent of the variance of the per capita GDP can be explained by the effect of trading with China. As R-square measures the explained part of the model, MAPE measures the unexplained part. Formally, MAPE is the average of the absolute percentage errors of forecasts, hence, the smaller the MAPE the better the prediction. The MAPE obtained in this study is 1.93 percent. This result is about ten
times smaller than per capita GDP relative growth displayed in table 5. Therefore, even when the unexplained part of the model is taken into account the results are consistent.
It is important to account for the potential spillover effects. It could be that the engagement of Angola with China had effects on per capita GDP in countries other than Angola. If that were the case, and an increase of per capita GDP of Angola in 2004 entailed an increase of per capita GDP of other countries included in the synthetic control, then the synthetic control would provide an underestimate of the counterfactual per capita GDP trajectory for Angola, and therefore an underestimate of the effects of Angola’s engagement with China. In contrast, if the effect of the
Table 5 Absolute and relative growth of per capita GDP after the intervention (PPP 2010 USD)
GDP per capita absolute growth GDP per capita relative growth
2005 244 USD +9.27% 2006 344 USD +12.48% 2007 521 USD +18.05% 2008 653 USD +21.76% 2009 612 USD +20.84% 2010 484 USD +15.60%
32 spillover is negative, then the synthetic control would overestimate the effect of the synthetic control assessment. However, the limited number of countries in the synthetic control (four) allows the evaluation of the existence and direction of potential biases created by the spillover effects (Abadie et al., 2015: 504). In addition, it is important to mention that the spillover effects in countries that are not part of the construction of the synthetic control do not affect the synthetic control estimates.
6.3 Placebo studies
Placebo studies are conducted to evaluate the credibility of our results. In this chapter, two placebo tests are going to be performed, in-time placebo and in-space placebo. In-time placebo consists in artificially reassigning the date of the intervention to a year other than 2004. Hence, the effect of the engagement with China obtained above is compared to a placebo effect obtained after artificially reassigning the intervention to period before China actually surpassed the 10 percent share in trade. A large divergence in per capita GDP between Angola and its synthetic version would undermine the credibility of the study, and consequently the confidence that the results in Figure 1 are indicative of the influence of China in Angola.
Figure 3 shows the results of this in-time placebo study. To conduct such a study, the intervention has been assigned to 2002, two years earlier than the actual intervention. After testing different years prior to the intervention like 2000, 2001 and 2003, and all providing very similar conclusions I opted for 2002. Hence, the model is run on the same premises but only changing the year of the engagement with China. The results show that the synthetic Angola closely reproduces the evolution of per capita GDP in the real Angola during 1995-2002 period. Most importantly, per capita GDP trajectories of Angola and the synthetic Angola do not diverge substantially during the 2002-2004 period, the imposed postintervention period. Therefore, in contrast to the actual China engagement in 2004, this 2002 placebo intervention does not have a noticeable effect. These results increase the credibility of this study and reinforce the interpretation that the gap estimated in Figure 1 reflects the impact of China in Angola and not a potential lack of predictive
33 power of the synthetic control.
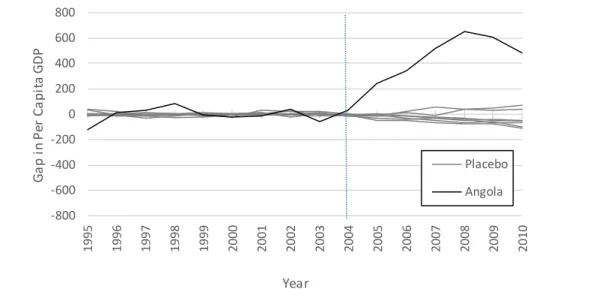
The second robustness test is the in-space placebo study. This placebo consists in reassigning the intervention to a comparison unit. In this way, synthetic control estimates can be obtained for countries that have not been exposed to the intervention. Hence, the same model will be applied to each country in the donor
pool. This technique allows to compare the estimated effect of the engagement with China to the distribution of placebo effects obtained for other countries. If the effect of the intervention on the other countries in the donor pool is significant compared to the estimated effect for Angola, then the confidence on the results of this study would be severely weakened.
Figure 4 displays the difference between per capita GDP of each country and per capita GDP of its synthetic counterpart (placebo in the legend). Particularly, Angola is also added to make apparent the different between the trajectories of the placebo units and Angola. It can be seen that the effect of the intervention on Angola increases abruptly after 2004 whereas the rest of countries remain almost unchanged.
Figure 3 In-time placebo intervention in 2002: Angola versus Synthetic Angola
Notes: The vertical dotted line in 2002 indicates the year chosen for the placebo intervention. 1500 2000 2500 3000 3500 4000 1995 1996 1997 1998 1999 2000 2001 2002 2003 2004 P er C a p it a G DP Year Angola Synthetic Angola
34 It is important to mention that only those countries with a MAPE of 1.5 times the MAPE of Angola are used as candidates for the placebo testing. That is because for the synthetic control method to work, there must be a preintervention period where a unit and its synthetic counterpart present a close fit, i.e. a small MAPE. If during the preintervention period the series do not match, then the results of the SCM might be flawed. Using the MAPE of Angola as a reference (1.93 percent), this study has applied the SCM to every country in the donor pool, but only those countries that scored a MAPE not larger than 1.5 times the MAPE of Angola (2.9 percent) have been used for the placebo test. In this case, it has been 8 countries used to run the test.
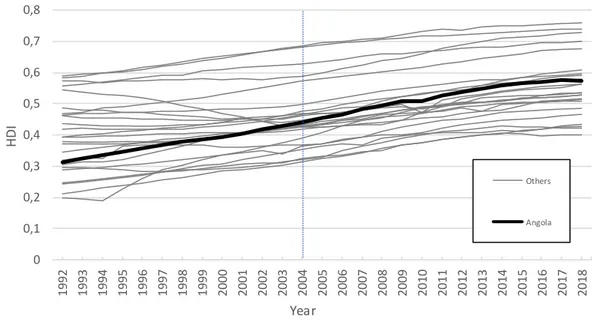
The two placebo tests used to assess the credibility and robustness of the results found in this study have come out showing very positive insights. Hence, this study is confident about the effects of China on the positive growth of per capita GDP of Angola. But although per capita GDP is the central point of this study, it is only one dimension of development. The next chapter will qualitatively analyse how human development index (HDI) and GINI index have changed after the engagement with China.
Figure 4 In-space placebo: per capita GDP gap between Angola and Synthetic Angola in comparison to placebos
Notes: The vertical dotted line indicates the year of the intervention. -800 -600 -400 -200 0 200 400 600 800 1995 1996 1997 1998 1999 2000 2001 2002 2003 2004 2005 2006 2007 2008 2009 2010 G a p i n P er C a p it a G DP Year Placebo Angola