Linköping University
Department of Culture and Communication Language and Culture in Europe Program Master’s thesis
Marjan Adibi Dahaj
Supervisor: Therese Örnberg Berglund
Examiner:Charlotta Plejert
December 2012
Analyzing learners' language awareness
in written production:
TABLE OF CONTENTS
ACKNOWLEDGEMENTS ... III LIST OF TABLES AND FIGURES ... IV
1 INTRODUCTION ... 1
1.1 AIMS AND RESEARCH QUESTIONS ... 1
1.2 OUTLINE ... 2
2 BACKGROUND ... 3
2.1 PRODUCT-‐ORIENTED APPROACHES ... 3
2.1.1 ERROR ANALYSIS ... 3
2.2 PROCESS-‐ORIENTED APPROACHES ... 4
2.2.1 FLUENCY ... 5 2.2.2 REVISION ... 6 2.2.3 PAUSE ... 9 2.2.4 KEYSTROKE LOGGING ... 10 2.3 RELATED WORKS ... 11 3 METHOD ... 14 3.1 STUDY SETUP ... 14 3.2 PARTICIPANTS ... 15 3.3 EQUIPMENT ... 15 3.4 ETHICAL CONSIDERATIONS ... 15
3.5 DATA ANALYSIS PROCEDURES ... 16
4 RESULTS ... 18
4.1 BASIC DESCRIPTION OF THE MATERIAL ... 18
4.2 PRODUCT ANALYSIS ... 18 4.3 PROCESS ANALYSIS ... 20 4.3.1 FLUENCY ... 20 4.3.2 REVISION ... 21 4.3.3 PAUSES ... 27 4.4 COMPARISON ... 29
4.4.1 COMPARISON OF FREQUENCY IN PROCESS DIMENSIONS AND PRODUCT ... 29
5 DISCUSSION AND CONCLUSION ... 33
5.1 LIMITATIONS ... 36
5.2 OUTLOOK ... 37
ACKNOWLEDGEMENTS
First and Foremost, I owe the earnest gratefulness to my supervisor Dr. Therese Örnberg Berglund for her immense inspiration, efforts, tactful guidance and patience throughout the thesis work. Without her scholarly supervision and constant support this thesis work would not have been completed.
Next, I would like to thank all of my lecturers for their valuable instructions and efforts who always encouraged and challenged me during my study at Linköping University.
Finally, my sincere gratitude goes to Sweden for facilitating a decent environment to carry out my graduate study, which I will always remember.
LISTOFTABLESANDFIGURES
Table 1. Total process time and number of words ... 18
Table 2. Number and Frequency of Errors in the Final Product ... 19
Table 3. Types of errors ... 19
Table 4. Fluency in Writing ... 20
Table 5. Number and frequency of revisions ... 22
Table 6. General revision types ... 23
Table 7. Types of form revision ... 24
Table 8. Frequency and Duration of Pauses ... 27
Table 9. Number of pauses before revisions vs. in other locations ... 29
Table 10. Frequency in process dimensions and product ... 30
Table 11. Error frequency in the final product ... 31
Figure 1. Pauses Types and Location ... 28
1 I
NTRODUCTION
Writing is one of the four skills that students learning a foreign language are supposed to acquire, and writing often has an important role in the language classroom. Furthermore, in the field of cultural and arts education, a process-oriented approach is considered essential for learning. However, even though we see an increased interest in emphasizing the writing process, in reality, what is often commented, discussed and graded is the final outcome - the product. Consequently, features of the writing process, like fluency, revisions, and pauses, are not considered. This thesis explores what information about the writing process might add to the picture. In this manner, the current study investigates the writing process of advanced Swedish EFL (English as a Foreign Language) learners through keystroke logging programme.
With the increased use of word processing tools, and not least with the development of keystroke logging tools, we now have the possibility to take also the details of the writing process into account. As Spelman Miller and Sullivan (2006:1) point out,
“[a]s an observational tool, keystroke logging offers the opportunity to capture details of the activity of writing, not only for the purposes of the linguistic, textual and cognitive study of writing, but also for the broader applications concerning the development of language learning, literacy, and language pedagogy”.
In the present study, a keystroke logging programme named Inputlog has been used, which allows researchers to get a better understanding of writing processes as well as cognitive processes during writing (Lindgren & Sullivan, 2002).
1.1 Aims and research questions
The aim of this thesis is to compare and contrast two different types of approaches for analyzing advanced Swedish EFL-learners' language awareness in written production: product-oriented approaches and process-oriented approaches.
1. What can we say about advanced Swedish EFL-learners' cognitive processes and language awareness through the two methods: product-oriented approaches and process-oriented approaches separately and combined?
2. Can we identify patterns that allow us to group participants into certain profiles with regard to their writing process and their final product, and is there a correspondence between the process and the product profiles?
1.2 Outline
The remainder of this thesis is divided into four parts. The relevant theoretical background, fundamental concepts and related works are covered in Chapter 2. The research methodology, experiment setup and participants, ethical considerations, as well as data analysis procedures are presented in Chapter 3. The results and their analysis with respect to different aspects of the writing product and the writing process are presented in Chapter 4. Finally, Chapter 5 includes discussion, conclusion, and the limitation of the study along with suggestions for future research.
3
2
B
ACKGROUND
Writing is one of the most complex elements of language learning (Lindgren & Sullivan, 2006). Accordingly, “[i]n course of constructing text, writers constantly plan, review and formulate the developing discourse; these are processes that often leave traces as pauses and revisions in the output”(Lindgren & Sullivan, 2006:31).
In this study language awareness is mostly related to cognitive process and correlated with thinking process of students' learning approaches. As we shall see in the following, it is often argued that an analysis of students' writing can give us an insight into their language awareness. Schmidt (1993:218) states that language awareness is important in language learning, and that studies on language learning should explore “the role of explicit knowledge about language in the language learning process and how such knowledge can be mediated by teachers”. Such explorations can either focus on the product or the process of writing, and some of the alternatives available will be presented in the following sections.
2.1 Product-oriented approaches
In this section, the most common approach to analyzing the final product, error analysis, will be presented.
2.1.1 Error analysis
One common approach to analyzing the written product is to focus on errors made by contributors, since these errors can be viewed as windows into students' language learning processes (Brown, 1994).
A comprehensive definition of an error according to James (1998:1) is an “unsuccessful bit of language”. Indeed, it is often said that in second language learning the study of errors is worthwhile since it will disclose what phenomena the student is struggling with and draw attention to the problem area which learners/students are dealing with.
According to Sattayatham and Ratanapinyowong (2008:22-23), there are three different reasons why investigating errors is essential. Firstly, language teachers can utilize errors as a metric in order to get an insight into what type of errors the students are struggling with. Therefore, teachers can see what part is more problematic and needs to be taught and developed. Secondly, errors can also indicate the approach of the learner towards attaining a new language, since they reveal the methods and strategies of the learner. Lastly, it is argued that the learner himself/herself would even gain advantage from making errors as it shows the learner’s problem area.
In respect to the discussion in the preceding paragraph, Erdoğan (2005) explains the benefits of error analysis. He points out that error analysis empowers teachers to determine the error cause and take instructional action accordingly (Erdoğan, 2005:262).
In connection with this, Corder (1974), one of the prominent researchers in the field of error analysis, (EA) states that the error study as a part of the language learning process not only shows us a learner's linguistic development but also might provide us some hints to the learning process (Corder, 1974: 125).
The sentiment expressed in the quotation embodies the view that error study is incorporated with the study of language learning processes through providing information about the linguistic progress of a student.
2.2 Process-oriented approaches
This section mainly deals with the investigation of different components of the writing process. Here we are primarily concerned with fluency, revisions and pause behavior during writing. But first, a brief background to process-oriented approaches is presented below. During the 1970s and 1980s a shift arose in writing research, which lead to draw researchers’ attention from the written product to the writing process activities relating to this written
product. Correspondingly, in this area new research methods have been developed for
investigating the process of writing, including think aloud protocols, stimulated recall methods, and different logging tools (Latif, 2008).
5
Similarly, much research has been conducted concerning the writing process. Research on writing began in the early 1970s, and the early pioneers of writing process research were scholars such as Emig (1971), Perl (1979) and Flower & Hayes (1981). Furthermore, since the early 1980s, several models of the writing process have been developed (Hayes & Flower, 1980; Bereiter & Scardamalia, 1987; Hayes, 1996; Kellogg, 1996; Van Wijk, 1999; Chenoweth & Hayes 2001).
It has been suggested that by analyzing writers’ writing processes, including phenomena like revision, pause and fluency, researchers and teachers can learn more about learners’ awareness and cognitive processes. Furthermore, teaching methods can be adjusted according to students’ writing needs, since the study of the writing process can give a better understanding of what kind of tactics and approaches are employed by good and weak writers, as well as distinguishing what different thinking patterns are used (Latif, 2008). Teachers might also benefit from learning about different kinds of obstacles and complications that students might face during the process of writing. Indeed, considering the writing process as a principal component of writing education is “[…] of utmost importance as it can be used for raising [the teachers’] consciousness about good writing strategies and for training students in using them” (Latif, 2008:33).
2.2.1 Fluency
One of the common ways to look into the characteristics of the writing process is fluency. Fluency relates to issues such as typing speed and pausing behavior, and can be seen as an indication of linguistic confidence and automatization (Schmidt, 1992). According to Schmidt (1992:385) fluency can be defined as “the processing of language in real time” and "automatic procedural skill".
There have been many methods for measuring fluency among researchers of written fluency. Some such methods include calculating T-units, sentences, clauses, words, number of characters and word per minute, words per error-free T-unit, average of the number of words per clause, etc. (Wolfe-Quintero et al., 1998, Chenoweth & Hayes 2001, Lindgren et al., 2008). According to Hunt (1965:20), T-unit defines as “shortest grammatically allowable sentences into which (writing can be split) or minimally terminable unit”.
Considering measuring fluency, Wolfe-Quintero et al., (1998) argue that “[w]hen we measure fluency, we are measuring the observable outcome of automaticity of access, […]” (Wolfe-Quintero et al., 1998:5). In their literature study of development in writing, their attempt is to draw a conclusion with respect to which measures are the most consistent and coherent. They deploy words per error-free T-unit, per T-unit, words per clause and words per T-unit as fluency measures. Furthermore, they carry out tests of lexical complexity and density in their study. Indeed, “T-unit length measure (W/T) is related to broad distinction between program or school levels, but not as clearly to holistic ratings or other proficiency measures” (Wolfe-Quintero et al., 1998:25).
Chenoweth and Hayes (2001), investigate the relation between fluency in writing and linguistic experience. They find out that “increased experience with language was associated with increased fluency in writing that language” (2001:93) and that “in less experienced writers, the writing process was frequently interrupted by revision” (2001: 96). Furthermore, fluent and more experienced writers revise less than the less- experienced ones (cf. Lindgren 2005).
2.2.2 Revision
Research on revision processes started in the 1980s. As Murray (1987:85) states, revision is “one of the writing skills least researched, least examined, least understood, and —usually— least taught”. Equally important, Sommers (1980) points out that particularly there have been done quite few study on the revision area. Even though we have seen an increase in studies dealing with revision in the last few decades, studies of revision are still not very frequent. In the early literature, there appears to be several definitions of revision (Emig, 1971; Nold, 1979;Lowenthal, 1980; Sommers1980; Scardamalia & Bereiter, 1983; Murray, 1987). For instance, Matsuhashi (1987) describes revision as a practice where the author stops the writing process and makes some changes to the already written text. The author can also continue to write the text or alter the text by referring back to another location of the text.
Murray (1987) considered revision as “seeing again”. When defining revision he asserts that it is “what the writer does after the draft is completed to understand and communicate what has
7
begun to appear on the page” (Murray, 1987: 87). In his study, he took two fundamental forms of revision into consideration: “internal revision” and “external revision”.
Nowadays, revision is generally considered as one of the main components of the writing process, and a considerable number of researchers have seemingly agreed on defining revision along the lines of Fitzgerald and Markham (1987):
“Revision means making any changes at any point in the writing process. It is a cognitive problem-solving process in that it involves detection of mismatches between intended and instantiated texts, decisions about how to make desired changes, and making the desired changes. Changes might or might not affect meaning of the text, and they may be major or minor” (Fitzgerald & Markham, 1987:4).
This illustrates that revising is simply about making changes during the process of writing. The purpose of the revision is highlighted in the definition of Leijten and Van Waes (2003). They define revision as a change in the text, after a review of the already written text. These changes are intended at the content and construction of the text (Leijten & Van Waes, 2003:12).
Likewise, Fitzgerald and Markham (1987) point out that revision is significant since it might improve text (Fitzgerald and Markham, 1987:4). With this in mind, one has to conclude that the purpose behind the revision is to ‘enhance the text’ in an appropriate manner.
2.2.2.1 Taxonomies of revisions
Having considered the definition of revision, it is also reasonable to look at the taxonomies of revision. In order to investigate a writer’s behavior, it is important to categorize revisions into various forms. Accordingly, writers can be classified into several revision profiles, based on these different categories.
In order to analyse revision behaviour, several taxonomies have been developed (Faigley & Witte, 1981; Van Gelderen & Oostdam, 2004; Lindgren & Sullivan, 2005). In this manner,
different scholars have tried to classify revision based on standard types. For instance, Sommers (1980) has introduced four types of categorization for revision, specifically based on the nature of the revision: “Deletion”, “Addition”, “Substitution”, and “Rearrangement”. Depending on the linguistic level, these can be further subdivided into four different levels, at which the revision takes place: the word level, the phrase level, the sentence level and the idea level.
Another way of categorizing revision is presented by Faigley & Witte (1981). Their taxonomy of revision changes is based on “whether new information is brought to the text or whether old information is removed in such a way that it cannot be recovered through drawing inferences” (Faigley & Witte, 1981: 402). In connection with this, they developed taxonomies into two main categories: ‘surface changes’ and ‘text-base changes’ where each one is divided into different subcategories. Surface changes include formal changes (spelling, tense, number, etc.) and meaning-preserving changes (addition, deletion, substitution, etc.). Correspondingly, there are two subdivisions for text-based changes as micro-structure changes (addition, deletion, substitution, etc.) and macro structure (addition, deletion, substitution, etc.) (Faigley & Witte, 1981).
Lindgren and Sullivan (2006) introduce what they called an on-line revision taxonomy. The revision taxonomy they introduced “is product- and process oriented and focuses on both the location of revisions and their effect on the online text” (Lindgren & Sullivan, 2006: 159). Based on their definition, revision is either pre-contextual or contextual.
Lindgren and Sullivan’s (2006) definition of ‘Pre-contextual revisions’ has been inspired by what Matsuhashi (1987) referred to as revisions ‘at the point of inscription’. In other words these revisions take place “as a result of on-going text production process, which is constantly on a stage of development” (Lindgren & Sullivan, 2006: 160). On the contrary, contextual revisions are described as “revisions undertaken when writers move away from the point of inscription to insert new text or delete, substituted or rearrange already written text” (Lindgren & Sullivan, 2006:171).
Lindgren and Sullivan (2006) claimed that “[i]n order not to impose subjective interpretations of the function of revision, the taxonomy defines revisions only according to the effect the revisions have on the written text”(Lindgren, 2005: 95). Accordingly, “ [i]nference to writers'
9
reasons for revising will only be made when additional information to that in the keystroke data can support the claims”(Lindgren, 2005: 95) .
Lindgren and Sullivan (2006) further divide the taxonomy of contextual revision into two categories: ‘form revision’ and ‘conceptual revision’. Form revision can be classified to typography, spelling, grammar, punctuation and format as well as meaning- preserving whereas conceptual revision is divided to Text- based, Macro structure and Balance.
Distinguishing between “Typography” and “Spelling” revision might be problematic. Lindgren and Sullivan (2006:172-173) define typography revision as “revisions undertaken as a result of a typing error”, and most likely “if a writer types a character and then immediately replaces it with another character, which is neighbouring key on the keyboard” (for example: of=>if). Spelling revision, on the contrary, are defined as revisions “that affect the orthography of a word in such a way that it cannot be categorised as a typing revision” (for example: appel => apple).
2.2.3 Pause
It has been argued that scholars can get an insight into the progress of the writing process and the cognitive process behind it also through analyzes of writer’s pause behavior (Matsuhashi, 1981; Schilperoord, 1996; Spelman Miller, 2000).
For instance, Spelman Miller (2000:141-142) points out that “[t]he specific insights about pause location and duration during writing allow us to move toward a closer understanding of the real time activity of writing”, and in a later study, he states that “[i]n the investigation of planning, the occurrence of pausing is important since it offers insights into the allocation of attentional resources in the writer during composition” (Spelman Miller, 2006:19).
There appears to be several definitions of pauses among the research community. According to Matsuhashi (1982:270) pauses can be described as “[m]oments of scribal inactivity during writing" which in turn “reflect time for the writers to engage in cognitive planning and decision-making behaviour”. We find another definition in Wengelin (2006:111) where a pause is defined as “a transition time between two keystrokes which is longer than what can be expected for the time needed to find the next key”.
In considering pause length, Wengelin (2006) proposed that eliminating short pauses, which are more common within words, might be applicable in case of research concerning planning of the sentence (Wengelin, 2006:111). Accordingly, pause longer than 2000 ms (2 seconds) are commonly used in many illustrations (Wengelin, 2006, Spelman Miller 2006, Chanquoy et al., 1996). Other scholars such as Van den Bergh, Van Waes, Jansen (1996) employed a minimum length of 3000 millisecond seconds in their studies. Furthermore, Leijten & Van Waes (2003) set the threshold at 1000 milliseconds.
Pause length has also been considered to reflect cognitive processes. For instance, Butterworth (1980:155) states that, “[t]he more the delays, the more cognitive operations are required by the output”. This affirmative connection between pauses and cognitive processes is also in line with Schilperoord (1996:9) who argues that “the production pauses have but one cause: a cognitive one”. In this manner Schilperoord (1996) claims that the longer pause duration, the larger cognitive load.
2.2.4 Keystroke logging
Since the 1970s the use of computers in learning and writing research has rapidly increased. In this time period there has also been acceleration in the growth of studies regarding the real-time writing process. As Spelman Miller (2000:127) points out,“[t]he advent of computer-based writing has enabled the development of alternative methods of observing the writing process on-line, […]” .
Using computers to study real-time writing processes might be described as “observing and analyzing the online writing process through recording computer screen activities, i.e. the keyboard presses and cursor movements, scrolling, the timing of each movement and pauses between these movements” (Latif, 2008:31). Utilizing computers as a tool for writing not only helps to enhance students' writing skills but also contributes to the writing research area, and especially to the area of cognitive writing research (Leijten & Van Waes, 2006:73).
It is also important to bear in mind that keystroke logging is applicable for both learners and teachers. As Spelman Miller et al., (2008) state:
11
“Keystroke logging offers a means for both teachers and students to gain insights into student writing. For teachers, the automatic function analysis […], offers a diagnostic instrument to help monitor students’ writing development. For learners, both within the classroom and beyond, logging can provide a means for the writers themselves to increase awareness of the cognitive processes underlying their own use of language and their own writing performance” (Spelman Miller et al., 2008: 447).
According to Van Waes et al., (2009) keystroke logging can be used for purposes other than research. For instance employing this program might be useful as an educational tool since it makes students and scholars aware of writing process features (Van Waes et al., 2009:61). Some keystroke logging programmes commonly used today include Inputlog (Van Waes & Leijten, 2006; Leijten & Van Waes, 2006), JEdit (Pestov, 1998), Translog (Jakobsen, 2006) and Scriptlog (Johnsson, Holmqvist, Strömqvist, Karlsson, & Wengelin 2006; Andersson et al., 2006). Each one of these keystroke-logging tools is available for limited operating systems. For instance, JEdit is only available for computers running the Mac operating system, and Inputlog, Scriptlog and Translog were developed for Windows.
A research group at the University of Antwerp in Belgium developed Inputlog, which was used in the current study. This program has a number of capabilities that empowers researchers to collect data from digital writing processes, generate different data files, merge data files from different programs and playback the recorded writing session (Leijten & Van Waes, 2006). More information about the Inputlog program is available on: www.inputlog.net.
2.3 Related works
Lindgren & Sullivan (2006:31) explored “the complexities of revision analysis and [problematized] the issues surrounding the development of revision taxonomies, ‘online’ revision analysis and the categorisation of online revisions”. They maintained the opinion that “although two writers’ final text composed under identical conditions may be similar in quality and structure, the process behind the creation of each texts could have included
significant differences in terms of pause and revision behavior” (Lindgren & Sullivan, 2006:31-32).
Contrarily, Van den Bergh et al., (1993) studied the relationship between cognitive activities of text revision during text production. By comparing revision behavior to the quality of final text, they found that making revisions lead to a better final written product, and more specifically, they found that “[s]tudents who wrote a good product also engaged in certain processes, whereas students who wrote less well product favoured different types of activities” (Van den Bergh et al., 1993:146).
Breetvelt et al., (1994) found that different writers (most preferably good and poor ones) not only varied in cognitive frequency of the activity they were engaged in, but also in the process of writing which they were involved with. They stated, “The frequency and nature of revisions seem to depend on the level of the writer's proficiency” (Breetvelt et al., 1994:105). Groenendijk et al., (2008) studied how secondary school students of Dutch and Flemish speakers wrote two poems. They coded pauses, text production, and different kinds of revision behavior and examined the relationship between students writing processes and the quality of their final text. Through this examination, they found revisions levels of the writing process had a positive influence on the final text.
Stevenson et al., (2006) investigated the relationship between different types of revisions and text quality by using think-aloud and keystroke-logging techniques. They pointed out that other measures rather than revision frequency might be used as an indicator of text quality. But “[w]hat may be important is the successfulness of revisions, that is, the extent to which the revisions made actually constitute an improvement to the text” and “the frequency of particular kinds of revisions” (Stevenson et al., 2006: 205).
Van Waes & Schellens (2003) investigated how the physical aspect of the task environment, and especially the use of word processor affect writing processes. In their data analysis, they focused on three aspects such as time taken and final product, Pausing behavior and Revision behavior. They developed a new typology of writing processes, introducing different writing profiles. According to them “[t]he writing profiles that emerged from this study clearly show
13
that writers organize their writing in several different ways” (Van Waes & Schellens, 2003: 849).
In this study, the different categories applied are based on classifications used in earlier research, especially those by Van Waes & Schellens (2003) and Lindgren & Sullivan (2006).
3
M
ETHOD
This study combines qualitative and quantitative methods, and the setup is semi-experimental. In this section, we will have a closer look at the methods for gathering and analyzing data.
3.1 Study setup
The writing task analyzed in this study was part of a larger study design. In the following, the complete process will be described, with a particular focus on the aspects relevant for the actual writing task.
Eight participants were invited to do a task as a complement to the regular classroom activities and they were told that it would take approximately thirty minutes. Before the data gathering started, the teacher briefly informed each participant about the different steps and instructions of the experiment. The participants were told that the aim of the task was for them to practice and possibly improve their English skills.
The whole experiment consists of three tasks: viewing a short animation video clip with no linguistic output, chatting with a teacher/researcher and retelling the story in a word document. The final writing task in the word processor is the focus of the current analysis. All sessions were video recorded.
Three researchers carried out the data collection. One of them took on the role of the teacher, and provided general instructions to the participants and moderated the chat sessions. The teacher provided them with metalinguistic feedback, recasts, and other types of corrective feedback during the chat.
After the chat, the Word document was opened through the keystroke logging software, and the participants were asked to re-tell the story once again. They were not told how long the final text should be or how much time they would have to complete it. However, since they had been told that the whole experiment would take approximately 30 minutes, they might have been under the impression that it should not be a very long text.
15
3.2 Participants
Eight high school students voluntarily participated in the current study. However, one had to be excluded from the current analysis, because the equipment did not work properly. All of the students were in the second year of upper secondary school of English, which is year 11 in the Swedish educational system. The participants were all seventeen-year-old students of English as a foreign language who attended the high school of a Swedish town.
In order to get some insight into the general proficiency level of the students, we gained access to the grades they received in their previous course in English: three students had the grade G (Pass), two students had the grade VG (Pass with merit), and three students had the grade MVG (Pass with distinction).
3.3 Equipment
The writing task was completed in Microsoft Word, and in order to get a clear view of the gaze of the students, the font size was 28. The eye tracker employed in this study was RED250 (the gaze data is omitted from the current analysis). In order to collect data concerning the writing process; a keystroke-logging programme named Inputlog (Leijten & Van Waes, 2006) with the version of 5.0.1.24 was used in the current project. A research group at the University of Antwerp in Belgium grants the required license of the programme.
3.4 Ethical considerations
As researchers should reflect on the ethical perspectives of the research, a set of standard ethical consideration (by the Swedish research council) for research concerning human beings was carefully applied in this project.
A brief summary of these considerations is presented in this section. For instance, all the participants were informed about the procedures beforehand. They were also told about the general aim of the research and what types of data were to be gathered.
In writing up the report, the author has avoided using any kind of clue that might make identification possible. Furthermore, during the analyzing of the data, the personal data of the
participants was kept anonymous. In this case each participant was given a new nickname (number) instead of his or her actual name.
Moreover, the students were asked to sign two consent forms (one before the data gathering and one after, explaining the purpose of the project in more detail) and they were informed that they have the right to withdraw their participation at any time, should they wish to do so.
3.5 Data analysis procedures
The word-processing writing task was analyzed in three steps: 1) focus on product, 2) focus on process and 3) comparison. First, the final product was analyzed, with a special focus on errors. In order to allow for a comparison with the results of the later analysis of revisions, it was decided to work with similar categories in both areas. These are taken from a taxonomy of revision, and will be further described below.
The second step in analyzing the data was to investigate different component of the writing process. Here the following areas were considered: fluency during writing, numbers and types of revisions, as well as numbers and types of pauses.
As the measure for calculating fluency here, we have taken the number of words produced in the final product per minute. This is in line with Chenoweth and Hayes' (2001) definition of fluency, whereby they defined fluency “as measured by words per minutes” (Chenoweth and Hayes, 2001:86). This means that the more words writers produce in a certain time frame, the higher the fluency (Johansson, 2009).
The revisions were counted and based on the taxonomy introduced by Lindgren & Sullivan (2006), all revisions were further classified according to where they occurred in relation to the point of inscription. As previously mentioned, Lindgren and Sullivan (2006) distinguish between pre-contextual revisions, taking place at the point of inscription, and contextual revisions, taking place in earlier, already completed, sentences. They claim that pre-contextual revisions cannot easily be categorized further, unless researchers have access to data from stimulated recall, since we do not know what each contributor has in their mind. However, in the current study, it is argued that the student does not need to return to a previously completed sentence for us to draw conclusions concerning the role of the revision, but that it
17
is enough that the student returns to a previously completed word. Therefore, we added a further category to the taxonomy, namely semi-contextual revisions, comprising revisions to a previously completed word in the current sentence.
In order to be consistent when categorizing revisions, some rules were developed. For instance, as already mentioned, if a revision is made to an already finished word in the same sentence, this counts as a semi-contextual revision, even though the revision might take place at the point of inscription. Furthermore, in order for a word to count as already finished, there does not need to be a space afterwards, and the word does not need to be a correct word (if there have been spelling mistakes, for instance). However, if it is impossible to identify the word, the revision counts as pre-contextual. Furthermore, if we have strange words, we can depend on the outcome of the revision when categorizing it. For instance, 'wad' > 'was' = semi-contextual, but 'byt' > erased = pre-contextual. Similarly ki > went = pre-contextual. In cases where the outcome of the revision is the same as before the revision took place, the revision has been coded as a revision with identical outcome.
As discussed earlier in the theoretical background, semi-contextual and contextual revisions were then categorized further according to their linguistic type based on the categorizations introduced by Lindgren and Sullivan (2006). In order to be able to compare the data concerning revision patterns with those concerning error patterns, the same categorization was used for error analysis.
As for pauses, those longer than 2 seconds (2000 ms) have been considered in this study. The pause frequency used in current data was calculated according to this formula: Total number of pauses divided by the total number of words x100. So, the figures represent number of pauses per 100 words.
The last part of the result deals with a comparison of process dimensions and final products. In order to do so, participants were grouped into profiles concerning their fluency as well as frequency of revisions and pauses in the process-based analysis, and frequency of errors in the product-based analysis. Since there are so few participants in this study, instead of doing statistical analyses, I choose to try to group them according to process and product profiles. Potential limitations of this approach are presented in the discussion.
4
R
ESULTS
4.1 Basic description of the material
In order to set the scene for further analysis, some basic figures concerning duration of typing task (total process time) and total number of words in the final written product for each of the participants are presented in Table 1.
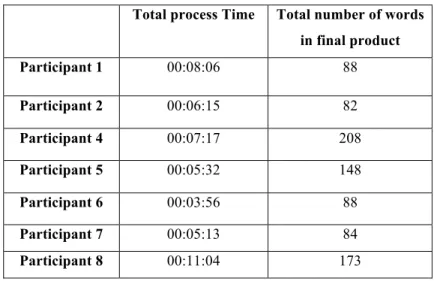
Table 1. Total process time and number of words
Total process Time Total number of words in final product Participant 1 00:08:06 88 Participant 2 00:06:15 82 Participant 4 00:07:17 208 Participant 5 00:05:32 148 Participant 6 00:03:56 88 Participant 7 00:05:13 84 Participant 8 00:11:04 173
The table above shows that the writing task process time differs considerably among the contributors. The longest process time is 11:04 minutes and the shortest is 3:56 minutes. All in all, the writing task adds up to about 47 minutes of writing process data, and the average writing process time is 6:46 minutes.
4.2 Product analysis
In this part of the results section, we will look at what conclusions can be drawn based on an analysis of the final written product, and more specifically, based on Error Analysis. As stated earlier, one common approach to analyze the written product is to focus on frequency and types of errors.
Table 2 below shows the number of errors produced by the participants in the study, in absolute numbers and their frequency in relation to total number of words in the final product.
19
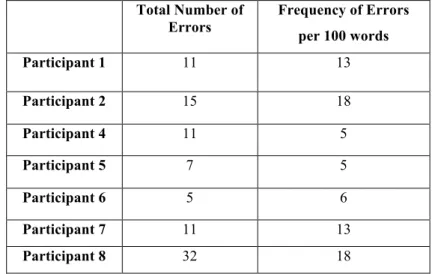
Table 2. Number and Frequency of Errors in the Final Product
Total Number of Errors Frequency of Errors per 100 words Participant 1 11 13 Participant 2 15 18 Participant 4 11 5 Participant 5 7 5 Participant 6 5 6 Participant 7 11 13 Participant 8 32 18
Here, we can see that Participant 8 produces the highest number of errors (N=32) and that Participant 6 has the lowest quantity of errors (N=5). If we look at the frequency of errors in relation to the total number of words in the final text, we see that Participants 2 and 8 had the highest frequency of errors, Participants 4, 5 and 6 had the lowest frequency, and Participants 1 and 7 have medium error frequency. We will return to these categorizations of error frequencies in Section 4.4.1.
By investigating the types of errors the students made, we might get a better insight into which areas are the most problematic for them. Table 3 below shows errors distributed over error types for each participant.
Table 3. Types of errors
Error Types
Grammar Spelling Punctuation Capitalization Other
Participant 1 4 4 1 - 2 Participant 2 4 6 1 2 2 Participant 4 5 4 1 1 - Participant 5 2 4 - - 1 Participant 6 2 1 - 1 1 Participant 7 2 4 1 4 - Participant 8 14 7 3 6 2 Total 31 31 7 14 4
Here we can see that spelling and grammatical errors were the most common type among these participants. All students made some errors in these two categories. We can also see that the participants had fairly few errors relating to punctuation and capitalization in their final written texts. To illustrate, in terms of grammatical errors, Participant 8 produces the highest
number of grammatical errors (N=14) and Participants 5,6,7 have the lowest quantity of grammatical errors (N=2). Spelling errors are the second most common error type. Participant 8 makes highest quantity of spelling errors (N=7), and Participant 6 produces the lowest number of spelling errors (N=1). For Punctuation errors all but one participant has the same amount of errors (N=1). Participant 8 is the exception who produces the highest number of punctuation errors. In the capitalization errors category, Participant 8 makes the highest number of capitalization errors (N= 6) and Participants 6 & 4 produce lowest amount of capitalization errors (N=1). In brief, by looking at the total number of errors for each category in the table above, we can see that in all categories, Participant 8 stands out for making the most number of errors. Moreover, grammatical and spelling errors are the two categories, which appear to be vulnerable to a high number of errors (N=31 in each category) compared to other ones.
4.3 Process Analysis
In this section, we will turn to an analysis of the students' writing processes. Focus here is on fluency during writing, as well as on revision and pause behavior.
4.3.1 Fluency
Fluency, as one of the common approaches to look into the characteristics of the writing process, has been taken into consideration in this section. Fluency relates to issues such as typing speed and pausing behavior. Table 4 depicts some figures relating to fluency.
Table 4. Fluency in Writing
Total process Time Total number of words Fluency (words/minute) Participant 1 00:08:06 88 10.86 Participant 2 00:06:15 82 13.12 Participant 4 00:07:17 208 28.55 Participant 5 00:05:32 148 26.74 Participant 6 00:03:56 88 22.37 Participant 7 00:05:13 84 16.10 Participant 8 00:11:04 173 15.63
21
The participant with the highest level of fluency here was Participant 4, who composed the text at a speed of on average 28.55 words per minute. The lowest fluency we find with Participant 1, who wrote an average of 10.86 words per minute. When grouping the participants here, we might call Participants 4, 5 and 6 "High fluency profiles", Participants 1 and 2 "Low fluency profiles" and Participants 7 and 8 "Medium fluency profiles".
4.3.2 Revision
In this section, we will have a look at the frequency and types of revisions made by the participants. It is argued that by investigating revisions, we can both get an insight into cognitive processes, and specific areas where students show language awareness. At the same time, whereas fluency might indicate automatization, revisions reveal areas that are less automized.
However, it is also important to remember that few revisions in a certain area not necessarily indicate little awareness in that area. For instance, a person who already masters the language will need to make fewer revisions than a person who is still learning some aspects. This means that an analysis of revisions can help us to zoom in on areas in which students show awareness and where they might need to work more, but there might well be awareness also in other areas.
4.3.2.1 Frequency of revisions
Table 5 below shows the number of revisions made by each participant, both in absolute numbers and relative to number of words in the final product.
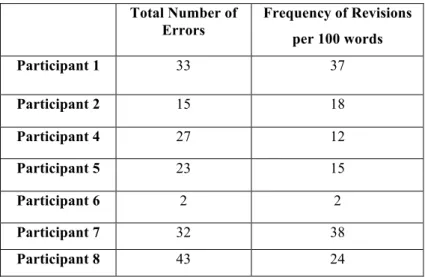
Here, we see that Participant 8 made the most revisions in total (N=43), whereas Participant 6 made, by far, the least revisions (N=2). If we group the participants according to their frequency of revisions, we see that Participant 1 and 7 have high revising frequency, Participants 2, 4, 5 and 8 have medium revising frequency and Participant 6 has low revising frequency.
Table 5. Number and frequency of revisions Total Number of Errors Frequency of Revisions per 100 words Participant 1 33 37 Participant 2 15 18 Participant 4 27 12 Participant 5 23 15 Participant 6 2 2 Participant 7 32 38 Participant 8 43 24
4.3.2.2 Types of revisions
In this section, we will have a closer look at how the revisions fall into different types of categories. First, we will look at revisions from a writing process perspective and then from a linguistic perspective.
4.3.2.2.1 Types in relation to the writing process
As discussed in the theoretical background, revisions can take place during different phases of the process. Table 6 shows the number of revisions in each of the relevant categories for each participant respectively.
Overall, 175 revisions took place during the writing tasks. 70 of these have been coded as Pre-contextual revision, 85 as Semi-Pre-contextual revision, and 2 as Pre-contextual revision. Furthermore, for 9 revisions, the outcome after the revision is identical to that before the revision, and these have been kept in a separate category.
23
Table 6. General revision types
Participant Pre-contextual Revision Semi- contextual Revision Contextual Revision Revision with identical outcome P.1 13 18 1 1 P.2 2 13 0 0 P.4 12 10 1 4 P.5 14 7 0 2 P.6 1 1 0 0 P.7 17 14 0 1 P.8 20 22 0 1 Total 79 85 2 9
These figures indicate that in this particular task, the absolute majority of the changes that the participants made were at the point of inscription (pre-contextual revisions) or in a recently completed word in the same sentence (semi-contextual revisions). Only on two instances did the participants return further back into the text to make alterations (contextual revisions).
4.3.2.2.2 Types in relation to linguistic form
To further explore what revision patterns might reveal about cognitive processes and language awareness, all revisions were analyzed in more details according to the on-line revision taxonomy (Lindgren and Sullivan, 2006). Since we cannot with certainty know the intention of a pre-contextual revision, taking place at the point of inscription, pre-contextual revisions are grouped together with other revisions which did not fit into the current categories, under the heading "Other". Focus for the categorization is rather on the semi-contextual and the contextual revisions. All revisions included were categorized according to Lindgren and Sullivan's (2006) types of revisions. The results are displayed in Table 7 below.
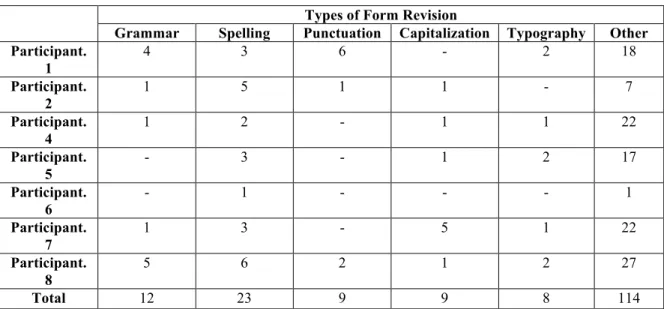
Table 7. Types of form revision
Types of Form Revision
Grammar Spelling Punctuation Capitalization Typography Other Participant. 1 4 3 6 - 2 18 Participant. 2 1 5 1 1 - 7 Participant. 4 1 2 - 1 1 22 Participant. 5 - 3 - 1 2 17 Participant. 6 - 1 - - - 1 Participant. 7 1 3 - 5 1 22 Participant. 8 5 6 2 1 2 27 Total 12 23 9 9 8 114
Here, we observe that most categorized revisions relate to spelling, and that all participants revise for spelling between one and six times. If we also add the figures for the closely related category "Typography", this area is certainly the most attended one.
However, in order for this to be of practical purpose, we also need more details concerning the specific types of revisions. The next section includes a qualitative description of some keystroke logging excerpts.
4.3.2.2.3 Qualitative description
In order to further develop the analysis presented above, some participants with very different process and product characteristics have been chosen for a qualitative description. The following examples are linear illustrations of parts of the writing process for Participants 1 and 8. The revisions are indicated as [BACK]. If there is a number included in the brackets, it indicates how many of the previous key presses are erased (no number = one key press). Pauses longer than 2000 ms are indicated as {xxxx}.
As mentioned in the method section, pre-contextual revisions have not been categorized further, even though some seem categorizable. That is because Lindgren and Sullivan (2006) argue that we cannot know for sure exactly what each participant has in his or her mind during the process of writing. As we shall see, sometimes it is possible to guess the reasoning behind these revisions, but in order to have a clear boundary between semi-contextual and
pre-25
contextual revisions, the revisions made to not yet completed words were not categorized further in the qualitative analysis.
Participant 1. Linear illustration:
girl·who·he·want· impres·[BACK]s·{4703}on.·He·mekae[BACK 2]es·thing·[BACK]s·like,·[BACK 2] ·[BACK]:·{2734}[LSHIFT]{5750}push-ups·{12531}playing·guit
ar·[BACK],[BACK]·a[CAPS LOCK]F[BACK][CAPS LOCK]nd·{14203}go[BACK 2]go[BACK 2]{4703}do{2765}es·something·in·a·boat·with·flo[BACK]oww[BACK]er·
As for Participant 1, the first revision that takes place in this particular excerpt is a semi-contextual revision and the type is spelling, since the original word “impress” is still kept even if it has spelling mistake. The Participant writes, “impres”, but then revises it to the correct form of “ Impress”. And then he pauses for (4703ms) which has been coded as a pause between words /after revision.
The next revision for the word “makes” is a pre-contextual revision, since it takes place at the point of inscription and within a word, and as explained earlier in method section, these type of revisions have not been further categorized. Right after that we have another revision, which is an example of a semi-contextual revision, and the type is grammar. In order to correct the grammar of the word “thing”, the participant adds the plural “s”. The next revision is a semi-contextual revision and the type is punctuation. The writer here changes the “,” punctuation with “: ”. In the next line, we can see another semi-contextual revision after the word “guitar”, again concerning punctuation, whereby the writer deletes the “.” punctuation mark.
After that, we can see that the writer begins by writing "a" and then writes "F", and ends up with writing "and". This is an example of a pre-contextual revision, since it takes place at the point of inscription, and not in relation to a finished word. So we cannot know for sure what he was attempting to do. Then he continues with another semi-contextual revision for the word “go”. The type here is deletion. After that, the participant tries to write the word flower, but his attempts fail several times. Since this revision takes place within a word, it has been considered as a pre-contextual revision. Once again he deletes the “,” punctuation which is another semi-contextual revision with the type of punctuation.
In brief, by qualitatively analyzing the revision process, we can see that Participant 1 is using a wide range of revisions. The quantitative analysis of revisions and errors in the previous section showed that Participant 1 made several successful punctuation revisions, some of which were included in the excerpt analyzed here. Table 3 further illustrated that in the areas of grammar and spelling, Participant 1 both made revisions and had remaining errors. Out of the revisions included in this excerpt, one was related to grammar and one was related to spelling. These revisions were successful, and from this short extract it seems as if on the occasions where this student shows language awareness through revision, he is also able to revise successfully.
Participant 8. Linear illustration:
was·tryinh.[BACK]g·to·reach·red·{4422}apple·at·the·top·a[BACK]on·a·tree[BACK]e.·{3844}he ·{2328}was·to·saml[BACK 3]mall·
to·ger·[BACK 2]t·the·{4422}appel·[BACK 3]le,·suddenly·a·{2093}pnik.[BACK 3]ink·{2656}little ·turn[BACK]tle·{2172}showed·up·and·the·green·one·{4250} did·[BACK 4]thinked·that·[BACK]she ·was·really·cute·
According to the linear illustration of Participant 8, the first revision he makes here is a semi-contextual revision. The type is “Typography” since the writer replaces the letter “h” with a neighboring key “g”.
As he continues writing, he makes a (4422ms) pause and then makes another semi-contextual revision. Here the type is grammar since he is removing the indefinite article “a”, substituting it with the preposition “on”. Right after that he makes a revision with identical outcome “tree”, which is followed by a pre-contextual revision-taking place for the word small. The revision, which comes after that for the word “get”, is categorized as a semi-contextual revision of the “Typography” type. The writer replaces the letter with “r” with the neighboring key “t”.
The revision of the word “apple” is another semi-contextual revision and the type is spelling, since the writer at first writes “appel”, but then he revises to the correct orthographic form “apple”. Similarly he makes another semi-contextual revision for the word “pink”, by revising “pnik” to the correct form “ pink”, and this revision has been categorized as a spelling revision. After making a (2656ms) pause, he continues typing and in the middle of a word (which ends up being "turtle"), he makes a pre-contextual revision. As he continues, another
27
semi- contextual revision takes place for the auxiliary verb “did”. The type here is grammar, since the writer is removing “did” and substituting it with “thinked”. Still, the writer makes another semi-contextual revision with the type of grammar. He is removing the “that” clause. On the whole, the qualitative analysis of this segment from Participant 8 shows that he uses a variety of revisions. Clearly, his success at revision is irregular. Sometimes making revisions has a successful outcome and leads to improving the sentences construction, but in other cases the result is an error. In the quantitative analysis in the previous section, we saw that Participant 8 made relatively few revisions in relation to grammar, and that he had many remaining errors. In the excerpt here, he makes three revisions relating to grammar, which are not successful, indicating that more work is needed. For instance this happens in the case of the first semi-contextual revision, which leads to an error with the preposition “on”. The successful revisions are in the areas of typography and spelling (e.g. apple, pink), and as discussed in the quantitative analysis, this was an area where he made more revisions than he had remaining errors.
4.3.3 Pauses
4.3.3.1 Frequency and Duration of Pauses
As mentioned in the method section, pauses longer than 2 seconds (2000 ms) have been considered in this study. Table 8 below displays the overall results relating to pause frequency and duration.
Table 8. Frequency and Duration of Pauses
Total number of pauses Total pause Time Mean pause Time Standard deviation Total process Time Total number of words Pause frequency Per 100 words Participant.1 24 00:03:31 8.81 19.9 00:08:06 88 27 Participant.2 23 00:01:41 4.42 2.44 00:06:15 82 28 Participant.4 23 00:01:30 3.92 2.1 00:07:17 208 11 Participant.5 12 00:00:49 4.09 2.84 00:05:32 148 8 Participant.6 11 00:00:59 5.39 6.85 00:03:56 88 12 Participant.7 21 00:01:51 5.31 6.65 00:05:13 84 25 Participant.8 57 00:03:28 3.66 1.85 00:11:04 173 32
Here, we see that Participant 8 made the most pauses, and Participant 6 the fewest. If we instead look at the number of pauses relative to the total number of words in the final product (Pause frequency), the picture gets a bit more complex. We see that Participants 1, 2, 7 and 8 have high pause frequency, whereas Participants 4, 5, and 6 have low pause frequency.
As for Pause duration, we can see that Participant 1,with the pause time of 03:31 has the longest pauses on average and Participant 6, with the average pause time of 00:49 seconds has the lowest pauses as compared to the other participants.
4.3.3.2 Types of Pauses
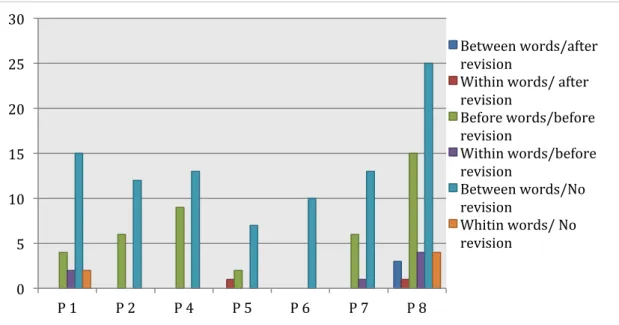
The location of pauses has also been investigated, both in relation to revisions and to linguistic surroundings. Figure 1 illustrates pauses related and unrelated to revisions for each participant. The X axis and Y axis respectively show the participants and the number of pauses.
Figure 1. Pauses Types and Location
According to figure 1, the vast majority of the pauses occur between words, which could indicate that once having started to write a word, participants most often do not have the need for pauses of 2 seconds or longer. Furthermore, for the most part, there is no revision involved in relation to the pauses.
0 5 10 15 20 25 30 P 1 P 2 P 4 P 5 P 6 P 7 P 8 Between words/after revision
Within words/ after revision Before words/before revision Within words/before revision Between words/No revision
Whitin words/ No revision
29
We can further simplify the data in order to highlight whether pauses occur before a revision, which could be interpreted as a sign that participants type before they pause to think, or after a revision/with no relation to revisions, which could be seen as a sign that they pause to think before they type. Table 9 below shows the figures divided into these two categories.
Table 9. Number of pauses before revisions vs. in other locations
P.1 P.2 P.4 P.5 P.6 P.7 P.8 Before revision 6 (27%) 6 (33%) 9 (41%) 2 (20%) 0 (0%) 7 (35%) 17 (37%) Other locations 17 (73%) 12 (67%) 13 (59%) 8 (80%) 10 (100%) 13 (65%) 33 (63%)
This table confirms that most pauses do not occur before revisions, but could rather be seen as pre-planning pauses. We can see that Participant 6 never pauses before revisions, and that Participant 4 makes the most pauses before revisions in relation to how many pauses that participant makes on other locations. It is of course important to relate these figures to the total number of revisions as well. For instance, in relation to the differences we find by comparing participants 4, 5 and 6 here, one thing to take into account is that Participant 6 only made two revisions in total.
4.4 Comparison
4.4.1 Comparison of frequency in process dimensions and
product
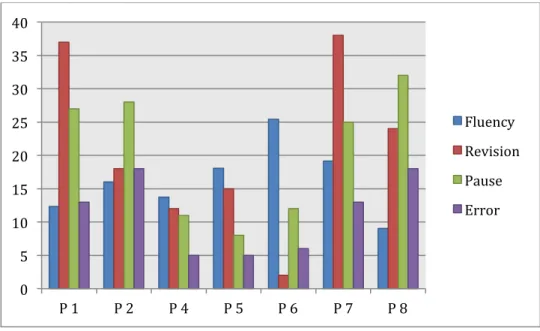
In order to allow for a comparison between different writing processes and final products, Figure 2 gives the frequencies for each of the participants (words, revisions and pauses/minute; final errors/100 words) and Table 10 summarizes the basic categorizations for each participant in relation to fluency and frequency of revisions, pauses in the process-based analysis, and frequency of errors in the product-based analysis.
Figure 2. Frequency in process dimensions and product Table 10. Frequency in process dimensions and product
Process Product
Participants Fluency type Revising frequency
Pausing frequency
Error frequency
1 Low High High Medium
2 Low Medium High High
4 High Medium Low Low
5 High Medium Low Low
6 High Low Low Low
7 Medium High High Medium
8 Medium Medium High High
If we start by comparing the different dimensions relating to the writing process, we can see that there is a correlation between fluency and frequency in revisions and pauses. This is not surprising, since we might expect that more revising will lead to more pauses, and that more revising and pausing will slow the writing process down.
The most clear-cut correlation is the one between high fluency and infrequent pausing (Participants 4, 5 & 6). Furthermore, we can see that both frequent revisers (Participants 1 & 7) are also frequent pausers, and that the infrequent reviser (Participant 6) is an infrequent pauser, whereas medium revisers (Participants 2, 4, 5 & 8) have either high or low pause frequency (there was no medium category in relation to pauses). We can also conclude that high fluency writers (Participants 4, 5 & 6), apart from being infrequent pausers, are either medium or infrequent revisers. Low fluency writers (Participants 1 & 2), on the other hand,
0 5 10 15 20 25 30 35 40 P 1 P 2 P 4 P 5 P 6 P 7 P 8 Fluency Revision Pause Error
31
pause frequently and revise with medium or high frequency. Medium fluency writers (Participants 7 & 8) are frequent pausers and frequent or medium revisers.
If we also take the error types, as shown in the final product, into account, we can see that there is a correlation between infrequent errors, (i.e. Participants 4, 5, 6) and writing fluency/number of pauses. As for revisions, these three participants are either medium or infrequent revisers.
We can also see that participants with medium frequency in errors such as participants 1 and 7 have been categorized as frequent revisers, and thus have a slightly higher revision rate than the participants with frequent number of errors, like participant 2 and 8 who have been categorized as medium revisers.
This analysis is based on the way in which participants have been grouped into profiles, and in the discussion we will consider how alternative boundaries between the different groups might influence the results.
Finally, in order to further investigate the potential links between process and product, we can also compare error frequency in the final product considering whether participants primarily seem to pause to plan ahead, or if they also pause before revising.
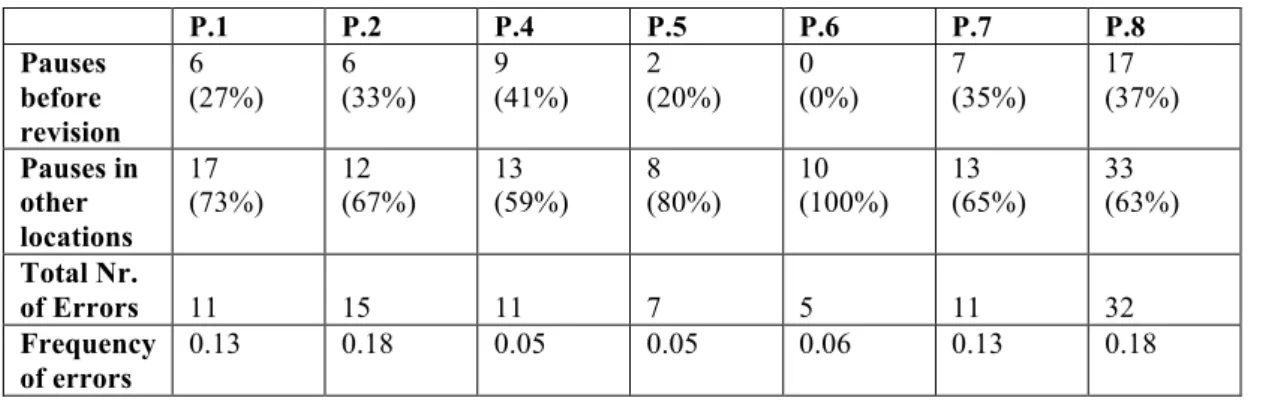
Table 11. Error frequency in the final product
P.1 P.2 P.4 P.5 P.6 P.7 P.8 Pauses before revision 6 (27%) 6 (33%) 9 (41%) 2 (20%) 0 (0%) 7 (35%) 17 (37%) Pauses in other locations 17 (73%) 12 (67%) 13 (59%) 8 (80%) 10 (100%) 13 (65%) 33 (63%) Total Nr. of Errors 11 15 11 7 5 11 32 Frequency of errors 0.13 0.18 0.05 0.05 0.06 0.13 0.18
Interestingly, here we can see that the participants with the lowest frequency of errors in the final product are placed on opposite ends of the scale when it comes to location of pauses in relation to revisions. Participants 6 and 5 make the least pauses before revisions in relation to the number of pauses they make in other locations. Participant 4, on the other hand, has the
highest percentage of pauses before revisions. This indicates that pause location does not correlate with error frequency in the final product.
33
5
D
ISCUSSION AND
C
ONCLUSION
In this section, we will return to the research questions posted in the introduction, summarize the results, and compare with findings from other previous research. 1. What can we say about advanced Swedish EFL- learners' cognitive processes and language awareness through the two methods: product-oriented approaches and process-oriented approaches separately and combined? And 2. Can we identify patterns that allow us to group participants into certain profiles with regard to their writing process and their final product, and is there a correspondence between the process and the product profiles?
First, we return to what an analysis of the final product, and more specifically, the errors, can tell us about learners' language awareness. Previous research has suggested that errors in the final product can be viewed as windows into students' language learning processes (Brown, 1994). Indeed, as mentioned in the theoretical background, it is often said that error analysis is worthwhile since it will disclose what phenomena the student is struggling with and many teachers take the opportunity to comment on these in order to raise learner’s language awareness (Corder, 1974).
The participants in this study had varying frequencies of errors. Considering error types, spelling and grammatical errors were the most common ones and in the areas of punctuation and capitalization, the students made fewer errors. In this study, errors are seen as an indication of the lack of language awareness, and since grammar and spelling errors are the most common errors, this is an indicator of the lack of language awareness in these areas. Secondly, we focus again on the different dimensions of the writing process analyzed, and what we can learn from this type of analysis. As mentioned before, in order to analyze the writing process, the following areas were considered: fluency during writing, numbers, and types of revisions, as well as numbers and types of pauses.
There are some patterns that allow us to group participants into certain profiles with regards to their writing process and their final product. The writing profiles that have arisen in this study indicate that writers conduct their writing in a number of different approaches (Van Waes & Schellens, 2003).