Mälardalen University Press Licentiate Theses No. 240
INDIGENOUS MICROALGAE-ACTIVATED SLUDGE
CULTIVATION SYSTEM FOR WASTEWATER TREATMENT
Anbarasan Anbalagan 2016
School of Business, Society and Engineering
Mälardalen University Press Licentiate Theses
No. 240
INDIGENOUS MICROALGAE-ACTIVATED SLUDGE
CULTIVATION SYSTEM FOR WASTEWATER TREATMENT
Anbarasan Anbalagan
2016
Copyright © Anbarasan Anbalagan, 2016 ISBN 978-91-7485-269-1
ISSN 1651-9256
Abstract
“Everything is everywhere, but the environment selects the best duo’’; natural selection holds the key to the relationship between the micro-algal communities in Lake Mälaren and the activated sludge organisms in the municipal wastewater of Västerås. Interest in microalgae-based activated sludge wastewater treatment has been increasing in recent decades as a way to meet the demand for sustainable wastewater treatment. Bacteria assisted microalgae cultivation is vital for reducing the emission of greenhouse gases (GHG) in the long term and for the prevention of excess biological and chemical sludge in conventional wastewater treatment sites.
This licentiate thesis focuses on process parameters such as light intensity, retention time and nutrient composition and the influence of micro-algal activated sludge (MAAS) on waste water treatment efficiency. The laboratory investigations will later be used to design a pilot scale approach.
Results from a semi-continuous MAAS process using raw wastewater showed combined removal of nitrogen (N) and phosphorous (P) at 2, 4 and 6 days of residence time. The removal of P was stable and a maximum removal efficiency from untreated wastewater of 50-65 % was achieved. The average N removal efficiencies at 6, 4 and 2 days of residence time were 82, 65 and 39 % respectively. In general, the removal of nutrients increased as expected with increased residence time. In addition, the MAAS sampled at different residence times showed a high biogas potential during batch tests. Most importantly, no lag phase was observed during the anaerobic mono-digestion.
Addition of P to the iron flocculated wastewater (treated wastewater) increased the N removal efficiency to 88 and 92 % at 4 days of residence time. Overall, the consumption of iron will be reduced in the future by using the MAAS process.The flocculation step may also be shifted to after the MAAS process. This will retain the P that increases N removal in the MAAS process and thus also helping to reduce chemical sludge.
Photosynthetic active radiation studies showed that the required light intensity increases with the concentration of biomass in a PBR operated at 14°C
(water temperature). The MAAS floc is key for efficient utilisation of light and oxygen synthesis. However, the evaluation of the process needs to be verified by comparing continuous and discontinuous (i.e. intermittent lighting hours) artificial lighting conditions. This will enable the safe discharge of wastewater with minimal power consumption.
Additionally, rapid settleability of the MAAS was observed in all the semi-continuous studies. Therefore, expensive harvesting techniques can be avoided with the help of MAAS.
The experiments described here only cover laboratory operation, and the results have to be verified in pilot scale operation in prevailing Swedish weather conditions. The primary focus will be to achieve the discharge limits set by Mälarenergi AB (Nitrogen: <15 mg L-1; Phosphorous: <0.5 mg L-1) with
Popular scientific summary
Municipal wastewater is mainly composed of water containing anthropogenic wastes that are rich in nutrients such as carbon, nitrogen and phosphorous. The cost of biological treatment of wastewater is increasing globally due to the population growth in urban areas. In general, the activated sludge (AS) process is a biological nutrient removal process used in wastewater treatment plants (WWTPs). The AS is composed of different microorganisms among which bacteria play a crucial role in wastewater treatment (WWT). During the process, air is bubbled through the medium to supply oxygen, and methanol is added to improve removal of nitrogen, which is released as a gas. Phosphorous is removed using chemical precipitation. The current process requires electrical energy, precipitation chemicals and handling of excess sludge, and it emits carbon dioxide (CO2) as a by-product. This process has been used in WWTPs
since 1914, although numerous modifications have been implemented to meet the stringent regulations in the European Union and other locations.
Microalgae are microorganisms that, like plants, also perform photosynthesis. They are green and reproduce quickly using available nutrients (nitrogen and phosphorous) and CO2 from their environment in the presence of light. As a
result of photosynthesis, oxygen is released as waste gas. The oxygen synthesised during this process can be utilised by the AS bacteria, resulting in the microalgae activated sludge (MAAS) process. The main advantage of this process is the combined removal of nutrients from the aqueous phase.
The goal of this research is to implement indigenous microalgae cultivation in the activated sludge process to consume CO2 and recover nutrients from
wastewater. This study was performed to improve the understanding of processes such as light utilisation, nutrient removal and recovery of biomass from wastewater in closed photo-bioreactors. Photo-bioreactors are vessels where cultivation is carried out in the presence of light. In this study, initial experiments investigate the influence of the light spectrum on photosynthetic growth in micro-algal cultivation. This is followed by a look at operational challenges of the microalgae cultivation during the AS process. Experiments are then performed on the process in the photo-bioreactors with different wastewater treatment times. The results show that 2-6 days of treatment can be used to reduce nutrients in wastewater if the process is optimised further. Nutrient ratio is also analysed for the availability for micro-algal growth. The recovered MAAS after the wastewater treatment subjected to anaerobic mono digestion showed biogas yields of about 60-80% within 5 to 9 days.
The experimental verification of chemically precipitated wastewater shows that phosphorus was limiting for micro-algal growth. Additionally, the optimal oxygen supply as a function of light response was verified for photo-bioreactors. The outcome of this study shows that identification of the right conditions can reduce the treatment time. In so doing, stable nutrient removal and reduction of precipitation chemicals can be achieved, as well as improved recovery of valuable nutrients like phosphorous and nitrogen.
Sammanfattning
Avloppsvatten innehåller allt det vi spolar ner i avloppet, och i det finns höga halter av viktiga näringsämnen så som fosfor, kväve och kol. Kostnaden för att rena avloppsvatten ökar i världen på grund av ökad urbanisering och ökade krav på reningen.
Reningsprocessen domineras av aktivslamprocessen, i vilken mikroorga-nismer (främst bakterier) renar vattnet från kol och kväve medan det mesta av fosforn fälls ut med kemikalier. Processen är mycket energikrävande på grund av den stora mängden luft som behöver pumpas in för att förse bakterierna med syre, och även sammantaget är det en energi- och resurskrävande process som därutöver kräver tillskott av mer kol, oftast som ren alkohol, för att kväve-reningen ska fungera.
I den här avhandlingen har ett alternativ till konventionell, bakteriell avloppsvattenrening studerats; mikroalgbaserad aktivslamprocess (MAAS). Bak-grunden är att gröna mikroalger, i likhet med växter, utnyttjar en fotosyntes i vilken algerna snabbt kan föröka sig om det finns näringsämnen, ljus och koldioxid. Eftersom avloppsvattnet innehåller alla nödvändiga näringsämnen kan det räcka med att tillsätta koldioxid under rätt ljusförhållanden för att en livskraftig algkultur ska växa till. Algerna producerar även syre i processen som i sin tur kan användas av bakterierna i MAAS- processen i en intressant symbios. Mest intressant är mikroalgbaserad vattenrening ur ett resursutvinnings-perspektiv, eftersom näringsämnena assimileras i algerna och därmed förblir i slammet och kan sedan utvinnas som en gödselprodukt.
Målet med MAAS-forskningen har varit att använda koldioxid, närings-ämnen och en algkultur från svenska förhållanden, i det här fallet Mälaren, för att bygga upp en effektiv kultur för vattenrening. Samtidigt vill vi i forskningen optimera processen utifrån hur mycket ljus som behöver tillföras, hur snabbt mikroorganismerna kan rena vattnet och vilka andra ämnen som kan störa processen.
I den här avhandlingen har olika ljuskällor undersökts, med särskilt fokus på effektiva LED-lampor. Därefter har målet varit att optimera processen så att uppehållstiden, dvs den tid det tar för en viss volym vatten att renas, skulle kunna sänkas från 6 dagar (Vilket anses vara internationell standard) till 4 eller till och med 2 dagars uppehållstid. Slutligen studerades effekterna av fällningskemikalier i mikroalgkulturen med slutsatsen att mikroalger blir begränsade av fällnings-kemikalier, men att mikroalgerna däremot har goda förutsättningar att rena vattnet från betydande mängder fosfor och därmed minska mängderna fällningskemikalier som måste tillsättas.
Preface
It would have been like searching for water in the desert if I hadn’t had their supervision: Senior Lecturer Emma Nehrenheim for considering me for this position, all encouragements, and moral support; Adjunct Professor Carl-Frederik Lindberg for his calm supervision, support and inspiration to think about everything in a practical way; Post-Doctoral Researcher Sebastian Schwede for his continuous encouragement and dedication to research, even if he ordered me to make a space shuttle in the evening he would ask me about it the next morning, “Hej Anbu, how is it going with our space shuttle?”… until it was completed.
It would have been like searching water in the desert if I hadn’t had their friendship: all my colleagues at the department and especially my office mates and neighbouring office mates, for fruitful suggestions with my licentiate. Most importantly, all the smiles and the sound discussions.
Special thanks to
our funders: KKS future energy research profile, Mälarenergi AB and ABB AB
ACWA group
Jesper Olsson for improving my knowledge and fruitful discussions in wastewater treatment
Thomas Wahl for moral support, showing me “Swedish-ness” and for enabling me to stay closer to the school.
Saywan Jamal and Joakim Jansson for all their technical support.
Last but not least special thanks to my family and friends outside Västerås for endless support in critical situations.
List of papers
This licentiate thesis is composed of the following papers which are represented by their roman numerals and are included at the end of the thesis:
I. Anbarasan Anbalagan, Sebastian Schwede, Emma Nehrenheim. Influence of light emitting diodes on indigenous microalgae cultivation in municipal wastewater. International conference on Applied Energy, Energy Procedia 2015, 7:786-792. DOI: 10.1016/j.egypro.2015.07.125
II. Anbarasan Anbalagan, Sebastian Schwede, Carl -Fredrik Lindberg, Emma Nehrenheim. Influence of hydraulic retention time on indigenous microalgae and activated sludge process. Water Research 2016, 91:277-284. DOI: http:// dx.doi.org
10.1016/j.watres.2016.01.027
III. Anbarasan Anbalagan, Sebastian Schwede, Carl-Fredrik Lindberg, Emma Nehrenheim. Influence of light intensity and phosphorous on microalgae activated sludge. Manuscript in submission 2016.
List of papers not included
I. Marisa Punzi, Anbarasan Anbalagan, Rosa Aragão Börner, Britt-Marie Svensson, Maria Jonstrup and Bo Mattiasson. Degradation of a textile azo dye using a biological treatment followed by photo-Fenton oxidation: evaluation of toxicity and microbial community structure. Chemical Engineering Journal 2015, 270; 290–299. II. Marisa Punzi, Filip Nilsson, Anbarasan Anbalagan, Britt-Marie
Svensson, Karin Jönsson, Maria Jonstrup and Mattiasson B. Combined anaerobic-ozonation process for treatment of textile wastewater: evaluation of acute toxicity and mutagenicity removal. Journal of Hazardous Materials 2015, 292:52–60.
My contributions to the papers
The research presented in this thesis was supervised by Emma Nehrenheim (EN), Sebastian Schwede (SS) and Carl-Fredrik Lindberg (CFL), except for paper I which was supervised by EN and SS.
Paper I: I performed the experiment and wrote the manuscript in coordination with the supervisors. Lights were obtained from Stig Nohlert.
Paper II: I performed the planning and experimental set up of MAAS process in coordination with EN and CFL. BMPs were planned and performed together with SS. I wrote the manuscript in coordination with the supervisors. Paper III: I performed the planning and experimental work, and wrote the manuscript in coordination with the supervisors.
Contents
1 Introduction ... 1
1.1 Background ... 1
1.2 Objectives and delimitation ... 2
1.3 Research Challenges ... 3
1.4 Thesis outline... 4
2 Theoretical Background ... 5
2.1 Activated sludge in wastewater treatment (WT)... 5
2.2 Microalgae in WT ... 7
2.3 Microalgae cultivation in activated sludge system – why? ... 7
2.3.1 Activated sludge process ... 7
2.3.2 Micro-algal process ... 8
2.4 MAAS process ...10
2.4.1 State of art...10
2.5 Biogas potential of MAAS ...14
3 Methodology ...15 3.1 Wastewater collection...15 3.2 Inoculum collection ...15 3.3 Experimental setup ...17 3.3.1 MAAS process...17 3.4 Settleability of MAAS ...20
3.5 Biogas potential of MAAS ...21
3.6 Other calculations ...22
4 Results and Discussion...23
4.1 Chl. a dynamics...23
4.1.1 Batch experiment ...24
4.1.2 Fed batch experiment...26
4.1.3 Semi-continuous ...27
4.2 Bio-nutrient and COD removal ...29
4.2.1 Nitrogen, phosphorous and organic carbon removal ...29
4.2.2 COD removal in wastewater ...32
4.3 Characteristics of the biomass ...34
4.3.1 Dry weight...34
4.4 Oxygen evolution of MAAS with different light intensities and biomass
concentration. ...39
4.5 Rate of biogas production from MAAS ...41
5 Conclusions and outlook ...43
6 Future works ...45
Glossary ...51
Appendix ...53
Papers ...57
List of figures
Figure 1.1 A step by step approach showing the PBR design criteria studied in this thesis ... 3 Figure 2.1 An overview of the microalgae-bacterial nutrient exchange
process in wastewater ...10 Figure 2.2 An overview of photosynthesis based nutrient removal ...12 Figure 3.1 A simplified overview of wastewater treatment in Kungsängen
wastewater treatment plant (KWWTP) (UWW/UW represents treated wastewater and TWW/TW represents treated wastewater) ...16 Figure 3.2 Experimental set up for LED and fluorescent light experiment. A) PWM-LED 1 and B) fluorescent light ...17 Figure 3.3 An experimental model of PBRs for pilot studies used in duplicate (Paper II) ...18 Figure 3.4 Influence of light on the evolution of oxygen. 1) Low (111 mg L
-1), 2) Intermediate (258±3.5 mg L-1) and 3) High MAAS (573± 11
mg L-1) based on the total suspended solids measurements...19
Figure 3.5 Imhoff cone sedimentation experiment in PBRs after the acclimatisation phase. A) Sedimentation at HRT of 6 days in UW. B) Sedimentation at HRT of 4 days in pre-treated
wastewater ...20 Figure 3.6 Biogas potential tests of MAAS...21 Figure 4.1 Influence of different light on chl. a. A) TW. B) UW. ...25 Figure 4.2 Chl. a dynamics during the fed-batch study of micro-algal
cultivation in treated wastewater...26 Figure 4.3 Chl. a dynamics during the semi-continuous study on MAAS
process. A) Acclimatisation phase of the MAAS in UW. B) At different HRTs in UW. C) At 4 days HRT in treated wastewater (Dash dotted lines in B and C separate each cycle during the HRT study) ...29 Figure 4.4 Removal of bio nutrients. A) Removal of TN/N and TP/P
during different light regime. B) Removal of N, P and OC at different HRTs in UW and C) Removal of N and P in iron flocculated wastewater. ...31 Figure 4.5 COD removal in PBRs. A) Influence of different HRTs in PBRs with duplicates and B) Influence of P. ...33 Figure 4.6 Influence of different lights on dry weight ...35
Figure 4.7 The characteristics of sludge during the semi-continuous PBRs. A and B represent influence of HRT on dry weight and SVI in duplicate reactors. C and D represent influence of P on dry weight and SVI. ...38 Figure 4.8 Oxygen evolution from different biomass concentrations at
different light intensities in PBRs...40 Figure 4.9 Influence of final DO to chl. a mass ratio with different biomass
concentration at different light intensities in PBRs using pre-treated wastewater...41 Figure 4.10 Rate of biogas production during mesophilic anaerobic digestion
of the MAAS obtained at different HRTs (final biogas yields after 25 days are shown in the legends with respective HRTs) ...42
List of tables
Table 1. Characteristics of influent during the MAAS cultivation ...23 Table 2. Trend of chl. a to dry weight during the semi-continuous PBR
operation...27 Table 3. Settling velocity of MAAS flocs obtained at 4 days HRT during
Nomenclature
Symbols
A665 - Absorbance of chl. a at 665 nm
A750 - Absorbance due to turbidity at 750 nm
Ci [mg L-1] Initial concentration of nutrients or COD
in the incoming wastewater
Cf [mg L-1] Final concentration of nutrients or COD
in the outgoing wastewater Ew [mg Empty weight of the crucible
f [cm mg L-1] (1 /extinction coefficient of acetone,
87.67 L g-1 cm-1)*(1000 mg 1g-1)
FS550 [mg] Fixed solids remaining in crucibles after
constant incineration at 550°C for 2 hours
H [m ] Settled MAAS height
p [m bar] Atmospheric pressure in the room pa [m bar] Ambient pressure
pm [m bar] Measured pressure
po [1013 m bar] Normalised pressure
pw [m bar] Vapour pressure of the water as a function
of temperature
SV [mL L-1] Settled sludge volume
t [hr-1]or [d-1] Time
Ta [°C] Ambient temperature
To [0°C] Normalised temperature
TS [mg g-1] Total solids
TS105 [mg] Mass of total solids in crucibles after
constant drying at 105°C for 24 hours TSS [g L-1] Total suspended solids / Dry weight
V [mL] Calculated gas volume
VS [mg g-1] Volatile solids
Vh [mL] Volume of headspace in the bottles
Vo [mL g Vs-1d-1] Normalised gas production
Vs [m hr-1] Settling velocity of MAAS in the cones
Vsl [mL] Volume of sample used
Ww [g] Wet weight
YBG [mL g VS-1] Yield of accumulated biogas
Abbreviations
BPR Biogas production rate COD Chemical oxygen demand Chl. a Chlorophyll a
DO Dissolved oxygen
GHG Greenhouse gas emission HRAPs High rate algal ponds LED Light emitting diodes MAAS Micro-algae activated sludge MAB Microalgae bacteria
PAR Photosynthetic active radiation PBRs Photo-bioreactors
PWM Pulse width modulation
r
dResidual concentration
SBR Sequential batch reactor SRT Sludge retention time SVI Sludge volume index TOC Total organic carbon
TP Total phosphorous/Phosphorous TN Total nitrogen/Nitrogen
TW Treated wastewater UW Untreated wastewater WWTP Wastewater treatment plan
1
1 Introduction
1.1 Background
Eutrophication is water pollution which is partly caused by discharge of effluent rich in major plant nutrients such as nitrogen and phosphorous. The effluent from conventional biological treatment enters lakes or coastal waters directly due to urbanisation. In Sweden, eutrophication is now a well-known problem to water resources planners due to the expansion of the population (from 7.5 million in 1960 to 9.85 million in 2015) (Statistics Sweden, 2016). These circumstances attracted a great deal of attention to upgrading the conventional process in the 1960s to maintain water quality (SEPA, 2012). Biological processes are efficient at removing carbon and nitrogen only, at the expense of energy. Developments in chemical engineering led to the introduction of chemical precipitation and a nitrogen removal process (i.e. addition of carbonaceous nutrient, methanol) (Teixeira et al., 2010). This has simplified the biological treatment of wastewater in several cities in Sweden. However, the long-term consequences of these processes have been given less importance in considerations of the sustainability of water treatment.
For instance, iron sulphate is commonly used as a chemical precipitant for concentrating solids and phosphorous in wastewater. However, commercial iron sulphate also contains impurities such as arsenic, zinc, nickel and lead, which are therefore indirectly added to the wastewater treatment process (QC Corporation, 2016). Heavy metals thus accumulate in the sludge as a result of the chemical precipitation. In addition, the accumulation of precipitated solids and sulphates may cause corrosion of concrete and sewer pipes in subsequent stages of the process. These consequences are less important in conventional wastewater treatment (Firer et al., 2007; Haaning Nielsen et al., 2005).
The present wastewater treatment plants (WWTPs) that utilise the activated sludge process use more electrical energy for aeration in comparison to other steps, such as clarifiers, sludge pump, heating and sludge dewatering. Aeration accounts for up to 75 % of the energy consumption in WWTPs (Amand et al., 2013). In future, stringent effluent discharge limits in the European Union will increase the energy cost due to the aeration, chemical steps and handling of sludge. Therefore, the removal of nitrogen and mitigation of greenhouse gas emissions (GHG) during the treatment will remain a big challenge in future (Park and Dolan, 2015). On the other hand, the cost of the WWTPs can be reduced if the energy and chemical consumption can be mitigated.
2
In recent years, photo-bioreactors (PBRs), an alternative solution containing microalgae and activated sludge bacteria, have been considered for removal of nutrients in different wastewaters (Posadas et al., 2013; Tiron et al., 2015; Weinberger et al., 2012). To date, the cultivation of microalgae in open PBRs (raceway ponds) and closed PBRs have emerged as attractive candidates for wastewater treatment (Alcántara et al., 2015; Muñoz and Guieysse, 2006). In both the open and closed reactors, the installation and harvesting steps are the main bottlenecks for wastewater treatment (Suh and Lee, 2003).
It is important to acknowledge the potential of ecological processes like naturally growing microalgae and bacteria for eco-technological applications. From this perspective, microalgae cultivation in wastewater containing bacteria is not new in Sweden. The cultivation of algae to treat wastewater at low temperature has been reported in Stockholm and Luleå (Grönlund et al., 2004; Karin Larsdotter, 2006). In addition, the cultivation has been evaluated in combination with flue gas in Umeå (Axelsson, 2012; Broberg et al., 2011; Processum, 2016). All the available investigations used open PBRs where the pH was not well controlled (Broberg et al., 2011; Grönlund, 2004; Karin Larsdotter, 2006). The previous studies were more proofs of concept than studies to evaluate ideal conditions. Therefore, they are not sufficient for designing a PBR, especially for treating municipal wastewater at WWTPs. Moreover, the open PBR design requires large land areas and light coverage which are not practically feasible for current WWTPs. Therefore, the present study addresses strategies for improving wastewater treatment in closed PBRs and the scalability of sludge harvesting. This type of PBR construction in activated sludge units is expected to be useful for minimising the risk of greenhouse gas (GHG) emissions, recovering plant nutrients and sludge reduction in the near future.
1.2 Objectives and delimitation
The overall objective of the present research is to experimentally establish favourable conditions for microalgae in the activated sludge units. The objectives are defined based on previous knowledge on microbial analysis from PBRs (Krustok, 2016). Combining these results may provide a possible solution for continuous nutrient removal and biomass production in the prevailing Swedish wastewater treatment conditions (i.e. availability of light, charac-teristics of wastewater and temperature).
This licentiate thesis aims to explore the application of indigenous microalgae originating from a freshwater lake and activated sludge bacteria originating from wastewater. Establishing optimal micro-algal cultivation in the PBR is a straightforward approach to support the naturally occurring activated sludge process for the removal of carbon. By doing so, the microalgae activated
3 sludge/microalgae-bacterial (MAAS/MAB) process can be implemented with the same infrastructure as the conventional activated sludge process.
The application of MAAS is an emerging technology and has been reported in the literature during the last few decades. However, there is no full scale industrial application so far in the activated sludge environment. The criteria for the kind of reactor designs used in this study are shown in Figure 1.1, which is based on local conditions and also from the literature.
Figure 1.1 A step by step approach showing the PBR design criteria studied in this thesis
1.3 Research Challenges
From the PBR design criteria and in order to meet the demand for sustainable wastewater treatment practice, the following research challenges are put for-ward from a WWTP perspective.
1. What kind of lighting is suitable for microalgae cultivation? Does the specific wavelength of the LEDs influence the cultivation period? How does intensity of light affect the photosynthesis process in PBRs? (Papers I and III)
2. What are the optimal conditions for the MAAS in untreated wastewater? (Paper II)
4
3. What is the effect of iron flocculated wastewater during the MAAS cultivation? (Paper III)
4. What is the biogas potential of fresh MAAS obtained at various times during the treatment period? (Paper II)
5. What are the settling properties of MAAS? (Paper II and III)
Other applications: How can we simultaneously produce biomass and upgrade exhaust gas in a continuous closed PBR using reject water as a nutrient supple-ment? (Ongoing work)
1.4 Thesis outline
This thesis is structured around the appended papers with the following chapters:
Chapter 1 Background
This chapter covers the background, research objectives, challenges and the outline of the thesis.
Chapter 2 Theoretical Background
This chapter presents a detailed literature review of background knowledge of previous work based on the research objectives.
Chapter 3 Methodology
This chapter provides an overview of the experimental methodology and important calculations used in this study.
Chapter 4 Results and discussion
This chapter presents the main results and discussion. Chapter 5 Conclusions
This chapter describes the major conclusions and the outlook from this study.
Chapter 6 Future work
This chapter elucidates the ongoing work and planned work for the coming years.
5
2 Theoretical Background
2.1 Activated sludge in wastewater treatment (WT)
Wastewater treatment in most towns or cities relies on the practice of traditional activated sludge process as biological treatment to remove nitrogen from wastewater. Figure 2.1 shows an overview of the activated sludge based wastewater treatment process, which celebrated its 100th anniversary in 2014.
Incoming municipal wastewater (high strength wastewater) has to undergo a primary treatment which includes mechanical, physical and chemical treatments. This step is referred to as the primary step. After this step, the wastewater is referred to as a medium or low strength wastewater. This step removes most of the solid particles, which contribute up to 40% of the chemical oxygen demand (COD) (Beal et al., 2012). The solids or deposited waste obtained after this step is called the primary sludge. Subsequently, the wastewater containing carbohydrates, proteins, lipids and fats undergoes biological treatment. This step is called the secondary step. The nutrients are consumed in growth of bacterial and other microbial cells. The bacterial process also plays a major role in the removal of ammonium (NH4) in the presence of
oxygen (air). In short, activated sludge bacteria oxidise nitrogen in the form of NH4 to nitrate (NO3) in the presence of oxygen (O2). This process is called the
nitrification process and it is strictly aerobic. In the presence of additional carbon sources (e.g. methanol or glycol), oxidised nitrogen is reduced to nitrogen (N2)
gas. This step is called denitrification. This process is strictly anoxic, and nitrate is used for respiration. Finally, the nitrogen and carbon depleted water is polished and released into water streams.
Removal of P is not an efficient process in the activated sludge process. Hence, 90-95 % of the P is removed during the primary step through chemical precipitation and the remaining P is removed after the secondary step (SEPA, 2012). Moreover, the bound P cannot be recovered due to complex formation.
6
7
2.2 Microalgae in WT
The use of microalgae in sewage treatment was first reported by Oswald in 1957 (Oswald and Gotaas, 1957). Simply stated, in bacterial decomposition of organic matter in wastewater, carbon dioxide (CO2) is released while O2 is consumed.
Algae utilise sunlight in consuming ammonium (NH4) and CO2 to synthesise
organic molecules using chlorophyll (green pigment), and release ammonia (NH3) and O2 (Oswald and Gotaas, 1957). In addition, there is simultaneous
phosphorous precipitation due to the alkaline pH caused by the growth of the algae. According to the earliest sources, algal bacterial consortia were part of wastewater treatment in extended lagoons (1963) in tertiary wastewater treatment (Hoffmann, 1998). Since then, micro-algal communities have been extensively evaluated in high rate algal ponds/raceway ponds (HRAPs). Therefore, microalgae based wastewater treatment is not new in sewage treatment.
However, HRAPs were not immediately installed as the primary biological wastewater treatment in centralised municipal wastewater treatment plants. This is because microalgae grow slowly and demand a large footprint and energy consumption to capture the sunlight or artificial light (Muñoz and Guieysse, 2006). In most cases, they were considered for municipal wastewater treatment for removing nitrogen and phosphorous (N and P) after the activated sludge process (Park and Craggs, 2011; Posadas et al., 2015). Gutzeit et al. (2005) and Weinburger et al. (2012) have demonstrated the importance of the microalgae and activated sludge combination in closed PBRs using a monoalgal culture (e.g. Chlorella sp.) in pulp and paper wastewater, and pre-treated municipal wastewater using discontinuous lighting (i.e. light and dark hours). Alcántara et al. (2015) demonstrated a complex modified closed PBR configuration. However, a continuous wastewater treatment needs a constant light supply for the cultivation of microalgae because growth stops during the dark hours (Edmundson and Huesemann, 2015).
2.3 Microalgae cultivation in activated sludge system –
why?
The bottlenecks of activated sludge and micro-algal process are discussed in sections 2.3.1 and 2.3.2.
2.3.1 Activated sludge process
Chemical step: the consumption of phosphorous precipitation chemicals such as ferric chloride (FeCl2) or ferrous Sulphate (FeSO4) is very high
8
widely used to concentrate the suspended biomass and to increase the removal of sludge from treated wastewater.
Oxygen supplementation: the wastewater generates biochemical oxygen demand through the chemical reactions performed by bacteria (see also section 2.4.1). Therefore a constant supply of oxygen is needed for bacterial respiration in the activated sludge tank to overcome the oxygen deficit (Amand et al., 2013).
Handling of sludge: the sludge from the WWTPs contains excess water that needs to be conditioned ahead of the thickening process. Moreover, the excess sludge production during the primary and biological steps requires a strict sludge management practice to avoid GHG emissions during storage (Liu, 2003).
Settling of sludge: a large sedimentation unit and a long time are essential to settle the final sludge. Cationic polymers are mandatory after the biological step to improve dewatering of the sludge (Wood et al., 1992).
External carbon source: addition of an external carbon source (i.e. methanol) is often required for reduction of the oxidised nitrogen (i.e. denitrification, conversion of NO3 to N2 gas). This adds operational
complexity to the process (Teixeira et al., 2010).
CO2 emissions: globally, CO2 emission is not a high priority for WWTPs.
CO2 is released as a result of bacterial oxidation of organic substrates in
wastewater (Chai et al., 2015).
2.3.2 Micro-algal process
Stability of the process: micro-algal photosynthesis is not a stable process. The volatilisation of N in the form of NH3 and the precipitation of P are
very common due to the alkaline pH during algae growth (Muñoz and Guieysse, 2006). These elevated pH conditions are very harmful to the activated sludge microorganisms.
Design of the reactors: microalgae reactors or PBRs are used for the cultivation method. In general, HRAPs have been widely reported but these require a large land area and surface lighting throughout the year. However, the depth of HRAPs varies between 0.1 and 0.3 m (Muñoz and Guieysse, 2006). The design of PBRs is moving towards tubular configurations to reduce the land requirement. The tubular constructions are expensive due to the installation cost and the settling characteristics are poor due to the rapid liquid flow inside the tubular section (Muñoz and Guieysse, 2006).
9 Harvesting of microalgae: microalgae have poor settleability (i.e. gravity sedimentation) due to their small size, which varies from 1-8 µm depending on the algal species. This is in spite of different cultivation strategies where the pH plays an important role in charge based settling during the sedimentation process (Liu et al., 2014). Several methods other than gravity sedimentation have been suggested for harvesting the biomass, such as dissolved air flotation, chemical coagulation, centrifugation and filtration (Christenson and Sims, 2011; Larsdotter, 2006). However, these processes not only increase the cost but also increase the complexity of the wastewater treatment.
It may be possible to eliminate the above bottlenecks by combining MAAS with optimal artificial lighting in the activated sludge units. The advantages of this are Reduction of precipitation chemicals and sludge: the combined biological nutrient removal and recovery of N and P opens the possibility of avoiding part of the chemical sludge production and extensive usage of the precipitation chemical (Anbalagan et al., 2016; Gutzeit et al., 2005; Medina and Neis, 2007).
pH of the process: the process can be controlled by maintaining pH values above 8 through addition of external CO2. This helps to avoid carbon
limitation during the process by increasing the mass ratios of carbon:nitrogen:phosphorous. Through this method, the treatment days can be reduced further from 3 to 2 days or even to 1 day in comparison to the HRAP (Tiron et al., 2015), which usually requires a longer treatment. Therefore, the optimisation step can be defined for fewer treatment days once a pH control is established over the process (Posadas et al., 2015). Settleability: there is a wide knowledge gap between cultivation and the
settleability in the pilot scale demonstrations (Paper III) (Muñoz and Guieysse, 2006). In contrast to these studies, MAAS can be a good alternative for self-flocculation if the operation is pH controlled in an activated sludge environment (Gutzeit et al., 2005; Medina and Neis, 2007). The cyanobacterial or fungal filaments present in the activated sludge can help the microalgae to aggregate as floc instead of remaining as suspended micro-algal communities (Gultom and Hu, 2013). Moreover, extra polymeric substances (EPS) manufactured from activated sludge organisms (i.e. on the cell surface) play a major role in interaction of the MAAS (Gultom and Hu, 2013). Microalgae are negatively charged and activated sludge bound EPS are positively charged, which can result in binding of the charged particles. The combined sludge may be hydrophobic at neutral pH, which can increase its dewatering ability (Nouha et al., 2015). Overall, settling characteristics of microalgae and activated sludge can be improved in a cost effective manner without external processes.
10
2.4 MAAS process
2.4.1 State of art
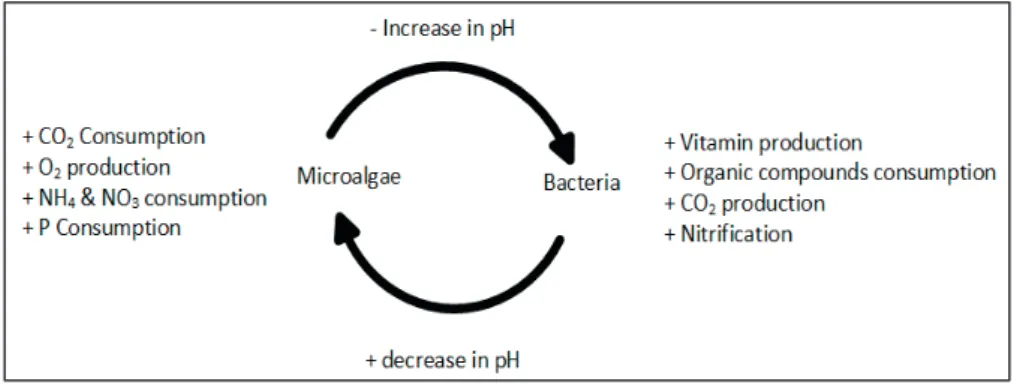
MAAS is a biological process that occurs by the interaction of two different processes, micro-algal photosynthesis and bacterial respiration. These two processes occur simultaneously in the wastewater environment with exchange of nutrients as shown in Figure 2.1. The balanced exchange of nutrients between two processes is dependent on the pH of the micro-algal process.
Figure 2.1 An overview of the microalgae-bacterial nutrient exchange process in wastewater
In micro-algal photosynthesis, the dissolved form of inorganic carbon, N and P are utilised in the presence of light for micro-algal growth (photosynthesis) to manufacture proteins, carbohydrates, lipids and photosynthetic pigments (e.g. chlorophyll, phaeophytin and carotenoids, etc.). The inorganic carbon may originate from bacterial respiration, flue gas, pure CO2 or biogas. Figure 2.2
shows a simplified sketch of the photosynthetic pathway.
The photosynthetic photosystems (PS) are classified into two types, PSI (700 nm) and PSII (680 nm) based on the excitation wavelength of the
chlorophyll-a (chl. a) molecule. The pigment excites two electrons as it receives light energy as photons. As a result, a series of electron transfers take place in different protein complexes across PSII and PSI in tandem, which powers proton movement from stroma to the thylakoid lumen. The transport of electrons is based on the movement of protons. At the same time, the released electrons in the pigment are replaced by electrons gained from the photolysis of water by water splitting protein complex (an oxygen oxidising complex with a
manganese - calcium
active centre
) in the PS II (Renger, 2012). During the photolysis, oxygen is released as by-product. The proton movement from stroma to thylakoid lumen causes a gradient during this step, which is used by the enzyme ATP (Adenosine triphosphate) synthase to synthesise ATP from ADP and inorganic phosphorus (Pi) in the medium. Nicotinamide diphosphate (NADP) gains a free proton to11 form NADPH and acts as terminal electron acceptor during the light cycle (Lodish et al., 2000).
As a result of photosynthesis, oxygen is released as by-product and the recovered NADPH and ATP are used for conversion of CO2 into carbohydrate
through a series of light-independent reactions called the Calvin cycle (Lodish et al., 2000). The process takes place in the space between the thylakoid membrane and the internal membrane of the chloroplast. Additionally, in parallel, microalgae can take up nitrogen either in the form of NH4 or NO3.
NH4 is preferred by microalgae over NO3 due to the loss of energy when
reducing NO3 to NH4 (Chen et al., 2012), which is a NADPH dependent
12
13 In the bacterial process, the activated sludge bacteria mainly perform the nitrification and respiration steps, producing carbon dioxide and oxidised nitrogen. Apart from this, ammonia oxidising archaea (i.e. single celled organisms) also perform the oxidation of ammonia. These conditions are favourable for photosynthesis (section 2.1). Excess CO2 is released as a
by-product from COD removal and acts as a carbon source for nitrifiers and algae. In this case, nitrate is used as nitrogen for the photosynthesis process. Bacteria thriving in the activated sludge also help to manufacture vitamins that are not synthesised during micro-algal photosynthesis.
In summary, the microalgae and activated sludge process involves the following simplified reaction scheme (1) to (5),
Photosynthesis
𝑪𝑪𝑶𝑶𝟐𝟐+ 𝐻𝐻2𝑂𝑂 + 𝑵𝑵𝑵𝑵𝟒𝟒+ 𝑵𝑵𝑶𝑶𝟑𝟑+ 𝑷𝑷𝑶𝑶𝟒𝟒+ 𝐿𝐿𝐿𝐿𝐿𝐿ℎ𝑡𝑡 + 𝐴𝐴𝐴𝐴𝐿𝐿𝐴𝐴𝐴𝐴 → 𝐶𝐶106𝐻𝐻263𝑂𝑂110𝑁𝑁16𝑃𝑃 +
𝐶𝐶6𝐻𝐻12𝑂𝑂6+ 𝑶𝑶𝟐𝟐
(1)
Oxidation of organic matter/exogenous respiration
𝑂𝑂𝑂𝑂𝐿𝐿𝐴𝐴𝑂𝑂𝐿𝐿𝑂𝑂 𝑚𝑚𝐴𝐴𝑡𝑡𝑡𝑡𝐴𝐴𝑂𝑂 + 𝑶𝑶𝟐𝟐+ 𝐵𝐵𝐴𝐴𝑂𝑂𝑡𝑡𝐴𝐴𝑂𝑂𝐿𝐿𝐴𝐴 → 𝑪𝑪𝑶𝑶𝟐𝟐+ 𝐻𝐻2𝑂𝑂 + 𝑵𝑵𝑵𝑵𝟒𝟒+ 𝐴𝐴𝑂𝑂𝑒𝑒𝑒𝑒𝑂𝑂𝑒𝑒𝑒𝑒𝑒𝑒𝑂𝑂𝑡𝑡𝑒𝑒 +
𝐸𝐸𝑂𝑂𝐴𝐴𝑂𝑂𝐿𝐿𝐸𝐸
(2)
Synthesis of new cells
𝑂𝑂𝑂𝑂𝐿𝐿𝐴𝐴𝑂𝑂𝐿𝐿𝑂𝑂 𝑚𝑚𝐴𝐴𝑡𝑡𝑡𝑡𝐴𝐴𝑂𝑂 + 𝑶𝑶𝟐𝟐+ 𝐵𝐵𝐴𝐴𝑂𝑂𝑡𝑡𝐴𝐴𝑂𝑂𝐿𝐿𝐴𝐴 + 𝐴𝐴𝑂𝑂𝐴𝐴𝑂𝑂𝐿𝐿𝐸𝐸 → 𝐶𝐶5𝐻𝐻7𝑂𝑂2𝑁𝑁 (𝐵𝐵𝐿𝐿𝑒𝑒𝑚𝑚𝐴𝐴𝑒𝑒𝑒𝑒 )
(3)
Oxidation of cellular matter/Endogenous respiration
𝐶𝐶5𝐻𝐻7𝑂𝑂2𝑁𝑁 + 𝟓𝟓𝑶𝑶𝟐𝟐→ 𝟓𝟓 𝑪𝑪𝑶𝑶𝟐𝟐+ 𝑵𝑵𝑵𝑵𝟒𝟒+ 𝐻𝐻2𝑂𝑂
(4)
Nitrification
𝐵𝐵𝐴𝐴𝑂𝑂𝑡𝑡𝐴𝐴𝑂𝑂𝐿𝐿𝐴𝐴 + 𝑵𝑵𝑵𝑵𝟒𝟒+ 𝟏𝟏. 𝟖𝟖𝟏𝟏𝟓𝟓 𝑶𝑶𝟐𝟐+ 𝟎𝟎. 𝟏𝟏𝟑𝟑𝟎𝟎𝟒𝟒 𝑪𝑪𝑶𝑶𝟐𝟐→
0.0261 𝐶𝐶5𝐻𝐻7𝑂𝑂2𝑁𝑁 (𝑂𝑂𝐴𝐴𝑛𝑛𝑂𝑂𝐴𝐴𝐴𝐴𝐴𝐴𝑒𝑒) + 𝟎𝟎. 𝟗𝟗𝟗𝟗𝟑𝟑 𝑵𝑵𝑶𝑶𝟑𝟑+ 0.921 𝐻𝐻2𝑂𝑂 +
1.973 𝐻𝐻 𝐿𝐿𝑒𝑒𝑂𝑂𝑒𝑒
(5)
The current state of knowledge of the micro-algal and bacterial processes clearly defines the major advantages such as nutrient removal and CO2 consumption,
with the main disadvantage being the increase in pH to alkaline (Figure 2.1). Most of the reported studies on wastewater treatment based on this concept use HRAPs (Muñoz and Guieysse, 2006; Park and Craggs, 2011; Posadas et al., 2013). In these conditions, microalgae will be the dominant communities during the wastewater treatment. The question remains how to overcome this disadvantage. The solution may involve cultivating microalgae in the activated sludge tank under controlled pH conditions. Control of the operational pH might be achieved by establishing a balance in buffering capacity between the two processes (Posadas et al., 2015). External CO2 buffering can be provided
based on the CO2 demand, which has to be verified at shorter HRT (Park and
14
2.5 Biogas potential of MAAS
Microalgae has the empirical formulae C106 H263 O110 N16 P, thus each molecule
of biomass has the potential to remove 41% of C, 7.2% of N and 1% of P by mass of nutrients in wastewater (Xin et al., 2010). Hence, the nutrients accumulated in the biomass can be used directly as a substrate for a wet anaerobic digestion process. The digested sludge can also be used as a slow fertiliser in the field if it complies with the regulations. For instance, according to Yuan et al., (2012) (6), stoichiometric conversion of 1 mole of algae alone during anaerobic digestion should theoretically produce 47.17 moles of methane. The degradability of biomass depends on the cell wall composition and the inhibitory compounds of the investigated species (Dalrymple et al., 2013). By applying the ideal gas law equation (i.e., PV = n RT), 508 Lof biogas can be produced from one kilogram of algae biomass (based on COD) from combined sludge containing algae alone.
𝑪𝑪𝟏𝟏𝟏𝟏𝟔𝟔𝑯𝑯𝟐𝟐𝟔𝟔𝟐𝟐𝑶𝑶𝟏𝟏𝟏𝟏𝟏𝟏𝑵𝑵𝟏𝟏𝟔𝟔𝑷𝑷 + 6.67 𝐻𝐻2𝑂𝑂 → 13.67 𝑁𝑁𝐻𝐻4+ 𝟐𝟐𝟐𝟐. 𝟓𝟓𝟏𝟏 𝑪𝑪𝑶𝑶𝟐𝟐+
𝟒𝟒𝟒𝟒. 𝟏𝟏𝟒𝟒𝟏𝟏 𝑪𝑪𝑯𝑯𝟒𝟒+ 2.33 𝐶𝐶2𝑂𝑂5𝐻𝐻7𝑁𝑁 + 13.67 𝐻𝐻𝐶𝐶 𝑂𝑂3−+ 𝐻𝐻𝐻𝐻𝑂𝑂4−+ 𝐻𝐻+
(6)
Additionally, the synergistic effect of microalgae and activated sludge (C5H7O2N) during co-digestion versus digestion of algae alone has been
reported in recent years for anaerobic digestion. This represents another advantage for the MAAS process (Liu, 2003; Olsson et al., 2014). In contrast to traditional treatment, MAAS provides an opportunity to close all loops in the wastewater treatment plant to treat wastewater and reject water. Therefore, the removal of CO2 and the boosting of C to N mass ratio from biogas during the
15
3 Methodology
3.1 Wastewater collection
Kungsängen wastewater treatment plant (KWWTP) is situated in a bay of lake
Mälaren, the third largest lake in Sweden. The plant receives sewage from more than 140 000 inhabitants of Västerås, Sweden. Wastewater is treated using conventional activated sludge for nitrogen and biological oxygen demand (BOD for 7 days (BOD7)) to achieve a removal efficiency of 65–75 and 97%
respectively. The plant also removes 95% of the total phosphorous using iron sulphate based precipitation. After the removal of nutrients, treated water is released into the lake. The discharge limits for total nitrogen and phosphorous in the treated wastewater are 15 and 0.3 mg L-1 (Mälarenergi AB, 2014).
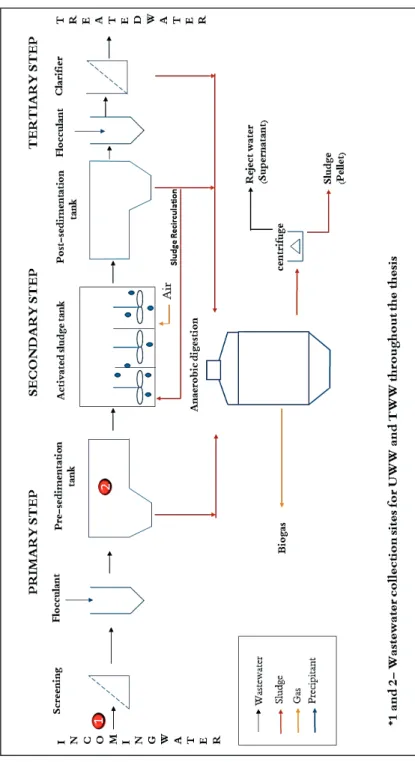
Figure 3.1 shows a simplified sketch of the KWWTP. The wastewater in our studies was collected at two different locations (1 and 2) at the KWWTP; Location 1: inflow pipe, before the screening and precipitation step (Figure 3.1); Location 2: pre-sedimentation tank after the iron sulphate based precipitation step (Figure 3.1).
3.2 Inoculum collection
The indigenous mixed micro-algal communities from Lake Mälaren were investigated for the MAAS process. Lake water used for pre-culturing and other preliminary studies was collected from the surface of the lake during the early autumn (2014) (Paper I and II). The inoculum obtained during middle and late spring (2015) from the pilot scale PBR (1 m3) was also investigated in paper III.
16
Figure 3.1 A simplified overview of wastewater treatment in Kungsängen wastewater treatment plant (KWWTP) (UWW/UW represents treated wastewater and TWW/TW represents treated wastewater)
17
3.3 Experimental setup
3.3.1 MAAS process
A) Influence of LEDs and fluorescent light
The experimental set up presented in paper I was a preliminary or indicator study designed to determine the influence of the light spectrum using mixtures of light of various wavelengths. Thus, the experiment was performed with reference to the fluorescent light in optimal growth conditions without pre-culturing of algae. The effect of pulse width modulation (PWM) of light emitting diodes (LEDs) was also analysed in this study. Figure 1 A shows the experimental setup of a simple flask study in the presence of PWM-LED 1 and fluorescent light as described in paper I. The following wavelengths were considered: red (632 nm), orange (612 nm), blue (470 and 430 nm) and white (380-670 nm). These wavelengths were considered to cover the spectral wavelength of chl. a pigment (i.e. blue and red light spectrum). The additional white light can be regarded as similar to the excitation wavelengths of PSI and PSII (see also section 2.4.1). PWM-LED 1 and PWM-LED 2 were designed with and without reduction of white light intensity respectively. Wastewater to lake water ratios of 70 to 30% were used in this study based on the previous investigation by Krustok et al. (2016). Three different test groups were investigated: PWM-LED 1 (high intensity), PWM-LED 2 (low intensity) and fluorescent light with intensity similar to PWM-LED 1. Each group contained untreated (Location 1) and treated (Location 2) wastewater in triplicates, and the flasks were shaken manually twice every day.
Figure 3.2 Experimental set up for LED and fluorescent light experiment. A) PWM-LED 1 and B) fluorescent light
18
B) Influence of HRT on photo-bioreactors
The previous section addressed the importance of light intensity, penetration and wavelengths. With this in mind, paper II reports on PBR studies to verify the favourable conditions for MAAS. As a reference, the knowledge gained on the micro-algal cultivation period (i.e. time required for increase in chl. a
content) from the previous batch study was taken into consideration. Fluorescent light with an intensity of 150 photosynthetic active radiation (PAR) units was used as the light source. The reactors in this study had a working volume of 22 L. Figure 4 shows the PBR (Reactor I (RI) and Reactor II (RII)) set up in duplicates. Instead of a 30:70 (Lake water: wastewater) ratio (in this case, the preliminary batch conditions failed the reproducibility test due to the increase in volume and depth), a 50:50 ratio was used to avoid the magnetite or pyrite formation of iron flocculated wastewater. In addition, the pH was controlled and reactors were stirred during the experiment to avoid dead or dark zones. Additionally, 50% of wastewater was replaced manually to achieve a semi-continuous operation mode, where the HRT was equivalent to the sludge retention time (SRT). This was done to determine the adaptability (acclimatisation) of the MAAS to a rapid shift in operational conditions.
Figure 3.3 An experimental model of PBRs for pilot studies used in duplicate (Paper II)
C) Availability of phosphorous in pre-treated wastewater
The precipitation of iron sulphate consumes most of the available residual phosphorous, which in turn reduces the dissolved oxygen and the uptake of the nitrogen by microalgae. Hence, the fed batch study was conducted with
19 controlled pH using CO2 to determine the impact of total phosphorous (P)
(paper III). The experimental set up presented in paper I was used in this study, with a working volume of 250 ml and fluorescent light as the light source. D) Influence of light on dissolved oxygen (DO) concentration
The experimental study presented in paper III aimed to answer the following questions:
1. What is the relationship between chl. a concentration (i.e. as an indicator for the growth dynamics) and light intensity? And how does it influence the DO evolution in wastewater?
2. How does the DO change with the biomass concentration in the PBRs? 3. Does lower concentration of microalgae require more light for the
photosynthetic DO?
Figure 3.4 shows the experimental procedure used to determine the influence of light intensity on different concentrations of MAAS using a cylindrical photo-bioreactor (1.5 L). The light intensity was expressed in PAR (µ mol. m -2 s-1). Light plays a crucial role in oxygen synthesis in microalgae, and oxygen
plays a key role in bacterial oxidation of organic matter present in the wastewater. Therefore, oxygen evolution rate was evaluated at different light intensities. Five different light intensities of 50, 75, 100, 250 and 500 µ mol. m -2 s-1 were studied against MAAS concentrations of 111, 258 ± 3.5 and 573 ± 11
mg L-1 of total suspended solids (TSS) (paper III). These MAAS concentrations
corresponded to 0.475, 1.048 and 1.91 mg L-1 of chl. a respectively.
Figure 3.4 Influence of light on the evolution of oxygen. 1) Low (111 mg L-1), 2)
Intermediate (258±3.5 mg L-1) and 3) High MAAS (573± 11 mg L-1)
20
F) MAAS in phosphate precipitated condition
Paper III aimed to investigate whether phosphorous addition had any impact on nitrogen removal during the semi-continuous MAAS process.
The MAAS process was examined for COD and nitrogen removal in the presence of effective (3 mg L-1) and higher (6 mg L-1) concentrations of P in
wastewater (See section 3.3.1 C). The initial concentration of MAAS used in this study was similar to a previous study (section 3.3.1 E) (i.e. 10% of the PBR volume, 2 L). The PBR setup discussed in paper II was used in this study without any duplication. A PBR working volume of 20 L was used. The collected periodical wastewater of 5 L from the KWWTP was replaced every day to reach a HRT of 4 days after complete settling of the wastewater (i.e. as in the sequential batch reactors (SBR)). A 0.5 L sample of uniformly mixed effluent was removed at each retention time point and used for the analysis.
3.4 Settleability of MAAS
The dewaterabilty of microalgae is one of the bottlenecks during the harvesting stage of microalgae cultivation and it varies from species to species (Uduman et al., 2010). Therefore, the settling characteristics of the MAAS were determined in the PBRs (paper II and III) using Imhoff sedimentation cones.
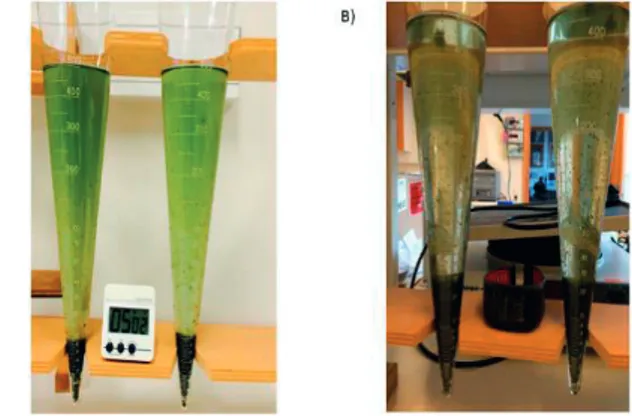
Figure 3.5 Imhoff cone sedimentation experiment in PBRs after the acclimatisation phase. A) Sedimentation at HRT of 6 days in UW. B) Sedimentation at HRT of 4 days in pre-treated wastewater
In wastewater treatment, the sludge volume index (SVI) is used as a parameter to analyse the settleability of sludge. In practice, 30 minutes of settling is widely used. Due to the rapid settleability of MAAS, 10 and 5 minutes settling times were investigated in papers II and III.
21
SVI =TSSSV (7)
TSS or dry weight of MAAS used in paper II and III was calculated from the PBR liquid sample subjected to oven drying at a constant 105°C for 24 hours.
The settling velocity of the MAAS was calculated in paper III using the
Imhoff cone experiment as follows
𝑉𝑉𝑠𝑠=𝐻𝐻 𝑡𝑡 (8)
3.5 Biogas potential of MAAS
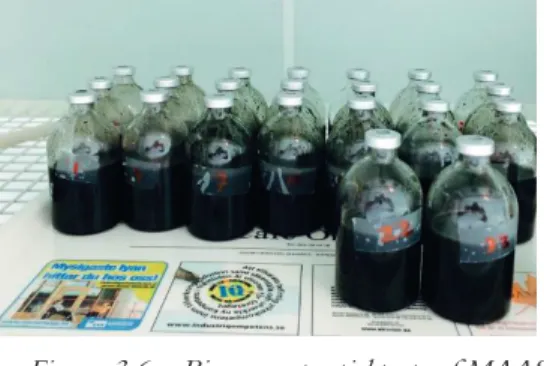
Biogas potential tests were performed in 120 ml serum bottles as described in paper II. The tests were conducted in two different groups: MAAS without pre-treatment and with pre-pre-treatment. Each group contained three sets of samples. The samples were obtained after 6, 4 and 2 days HRT. Each set was investigated in triplicate. The pre-treatment was performed at 120°C for 2 hours. The experimental setup was implemented according to Schwede et al. (2013). The bottles contained an inoculum to MAAS ratio of 2:1. This contributed to a volatile solids (VS) ratio of 7.5 g L-1 inoculum to 3.5 g L-1 MAAS in each bottle
(Olsson et al., 2014; Schwede et al., 2013).
Figure 3.6 Biogas potential tests of MAAS
VS measurement was performed using crucibles made of aluminium and china clay. VS (mg g-1) was calculated according to APHA standard methods
according to (9) and (10). TS =TS105 − Ew
Ww (9)
VS =TS− FS550
22
The gas production was determined by measuring the excess pressure exerted by biogas in the headspace of the bottles using a digital pressure gauge. The gas volume was calculated and normalised at standard temperature and pressure based on (11).
V =Vh∗(pa−pm)
pa –Vh (11)
Vo= V ∗(p−ppo∗Tw)∗Ta o (12)
3.6 Other calculations
Removal efficiencies (% RE) of the nutrients organic carbon (OC), total nitrogen (N) and P were determined according to (13). The same equation was used to determine the characteristics of wastewater by evaluating the removal efficiency of COD (13).
RE,% =Ci−Cf
Ci ∗ 100 (13)
In paper I, the total COD and total organic carbon (TOC) were used to determine the increase in the MAAS. In addition, the total inorganic carbon (TIC) was also used to determine the TIC concentration during the cultivation. The chl. a dynamics were determined in papers I, II and III based on the acetone extracted chl. a content, according to the method described in Bellinger and Sigee (2010) (14),
C = (A665− A750) ∗ (VVsl sol) ∗ (Lf) (14)
In addition, dissolved oxygen concentration was also measured as an indicator of photosynthesis during the experiment using sensors (papers II and III).
The rate of biogas production (RBP) was calculated for untreated and
treated biomass based on (15).
BPR (%) =𝑌𝑌𝐵𝐵𝐵𝐵(1,2,3….25 (𝑑𝑑𝑑𝑑𝑑𝑑𝑑𝑑)𝑌𝑌 ∗100
23
4 Results and Discussion
Two different types of wastewater were investigated for the MAAS process in this thesis. They are referred as untreated and treated wastewater (UW and TW). The UW was considered as having a rich medium N to P mass ratio in comparison to treated wastewater since P in TW was limited due to the precipitation step. The heterogenic profile of wastewater in the appended papers is shown in Table 1.
Table 1. Characteristics of influent during the MAAS cultivation
Papers Average concentration of bio-nutrients and COD in the influent (mg L-1)
Type N P COD OC I UW 37 ± 0.17 3.28 ± 1.20 421 ± 1.20 154 ± 38.80 TW 30 ± 1.40 0.91 ± 0.21 167 ± 2.32 115 ± 2.31 II UW 30 ± 7.10 4.70 ±0.73 342 ± 72.92 164 ± 28.71 III TW 33 ± 3.63 7.04 ± 0.16§ 4.44 ± 0.33¤ 238 ± 70.45 N § and ¤-6 and 3 mg L-1 of P addition; NM-Not measured.
4.1 Chl.
a
dynamics
The dynamics of chl. a were monitored as a measure of photosynthetic growth in all experiments. Chl. a development was directly related to light capturing and the carbon fixation process during the oxidation by bacteria (COD removal) (refer also to section 2.1). Therefore, the inorganic carbon forms (CO2 or
H2CO3 or HCO3) were directly converted to carbohydrates (Bellinger and
Sigee, 2010; Hosikian et al., 2010). Hence, chl. a content provides an overall measure of green microalgae and cyanobacterial proliferation during the MAAS process. In any case, a decrease in chl. a content was considered either as a decrease in the biomass or as an instability in the process due to the limitation of light and the C/N/P ratio in wastewater. However, other factors such as
24
overgrowth of bacteria or incoming organic content in the wastewater may also increase the absorption of light or decrease the chl. a content.
4.1.1 Batch experiment
A preliminary study was performed in paper I with three different light sources (PWM-LED 1, PWM-LED 2 and FL) using TW and UW. The chl. a analysis from a preliminary study is shown in Figure 4.1 A and B.
In TW, the FL showed a significant increase in chl. a content after 6 days (0.6 ± 0.2 mg L-1) of cultivation in comparison to PWM-LED 1 (0.4 mg L-1)
and PWM-LED 2 (0.3 mg L-1) (Figure 4.1 A; Orange bars). The pH increased
above 8 after day 6, and the system became unstable. This may be due to NH3
volatilisation and bio-precipitation of available P (Muñoz and Guieysse, 2006). In addition, the light spectrum of the PWM-LED 1 was augmented with an additional white light shifting it towards the wavelength of the PS (refer also to section 2.1). Therefore, the intensity of white light directly influenced the development of chl. a in PWM-LED 1 after day 6 and continued to increase until day 14 (Figure 4.1 A).
However, the PWM-LED 1 showed an increase in chl. a after day 6 and 8 (0.5 ± 0.4 and 1 ± 0.3 mg L-1) in comparison to FL (day 6 and 8: 0.3 mg L-1) and
PWM-LED 2 (day 6 and 8: 0.4 mg L-1) in the UW (Figure 4.1 B). A larger
deviation in the UW in comparison to the TW was due to the alignment of the LEDs. A shift in pH from 6.8 to 8 occurred between days 6 and 8, where most of the carbon was fixed due to bacterial oxidation in both cases (paper I). This might have supported the buffering ability of the wastewater even after day 6 of the cultivation phase. The batch study was considered as an indicator study. The uncertainties were considered in order to improve the design of the later experiments with controlled pH (papers II and III).
Altogether, a high chl. a concentration was observed in UW (1-1.3 mg L-1)
in comparison with TW (0.6-0.8 mg L-1). In both cases, red and blue
wavelength LED mixtures registered slow growth in comparison to increased white light intensity regardless of wastewater composition. Hence, white LED lights should be considered for closed PBR cultivation instead of FL and LEDs of specific wavelength.
25 Figure 4.1 Influence of different light on chl. a. A) TW. B) UW.
26
4.1.2 Fed batch experiment
Following the previous study (paper I), the dynamics of chl. a were studied in paper III as shown in Figure 4.2. The influence of different phosphorous supplements: 0.5, 1, 2, 3, 4 and 5 mg L-1 on the TW was studied using a
fed-batch approach. The pH of the system was maintained at 7.5 using CO2 to avoid
the detrimental effects of high pH on bacterial activity. 50% of the reactor volume was replaced (after settling of the biomass) daily for 3 days to mimic the retention time of the pilot PBR, i.e. 6 days HRT.
The chl. a dynamics revealed that the effective P concentrations were 3 and 4 mg L-1 (i.e. in addition to the residual P). The maximum chl. a content of 1.2
mg L-1 was achieved in both P concentrations after 3 days of cultivation. These
results were in agreement with the study conducted by Chen et al. using a culture obtained from lake Taihu, China (2010). They noticed that an increase in phosphorous concentration increased the chl. a content during the photosynthetic growth of Scenedesmus obliquus and Microcystis aeruginosa
(Chen et al., 2010).
Figure 4.2 Chl. a dynamics during the fed-batch study of micro-algal cultivation in treated wastewater
27
4.1.3 Semi-continuous
Figure 4.3 A and B shows the acclimatisation phase (6 days HRT) and the semi-continuous phase (6, 4 and 2 days HRT) of the MAAS process in the PBR treating UW from the KWWTP as described in paper II. Table 2 shows the relationship between chl. a and dry weight of the MAAS.
The chl. a content gradually decreased with the retention time in both reactors due to low SRT. Chl. a concentrations of 1.4 (RI) and 1.1 (RII) mg L -1 were obtained during the acclimatisation phase (Figure 4.3 A). The dynamics
show fluctuating chl. a concentration with reduction in the HRT from 6, 4 and 2 days (Figure 4.3 B). In RI and RII, the average chl. a of 0.9 ± 0.4 (6 days), 0.3 ± 0.1 (4 days) and 0.2 ± 0.1 (2 days HRT) was achieved due to the heterogenic profile of wastewater and light limitation.
Chl. a to dry weight ratio was stable throughout the study in RII but in the case of RI, chl. a content fluctuated and was unstable (Figure 4.3 B and Table 2). A similar study from Guzeit et al. (2005) showed a higher chl. a to dry weight content (>10 mg g-1) at 2 to 7 days HRT (based on 10: 14 and 12: 12 (light:
dark) hours) with Chlorella sp. in laboratory and pilot scale reactors with 2000 and 500 PAR using pre-treated wastewater.
Medina and Neis (2007) report a similar study to Gutzeit et al. (2005), with the same configuration using synthetic wastewater at laboratory scale, showing a lower chl. a content at 2.7 days (5.8 mg g-1, avg.) and 4 days (3.12 mg g-1,
avg.) of HRT. They also observed higher chl. a content in suspended form during the sedimentation (2.51 mg g-1). This needs to be verified in future
investigations.
Table 2. Trend of chl. a to dry weight during the semi-continuous PBR operation
Treatment
conditions UW TW
6 days HRT 4 days HRT 2 days HRT 4 days HRT
RI RII RI RII RI RII LUP P stress Chl. a to dry weight (mg g-1) 4.36 ± 0.61 3.75 ± 0.50 2.41 ± 0.60 3.71 ± 0.90 2.48 ± 0.82 3.10 ± 0.61 3.75 ± 0.10 2.36 ± 0.13 Figure 4.3 C shows the development of chl. a at 4 days HRT during the acclimatisation step, the luxury uptake of phosphorous (LUP) and the P stress condition (paper III). The acclimatisation of the high P condition contributed to an increase in chl. a content from 0.43 to 1.04 mg L-1. Average chl. a contents
of 1.4 ± 0.3 and 0.91 ± 0.04 mg L-1 were observed in the respective conditions.
28
comparison to LUP. This is in agreement with the chl. a to dry weight ratio (see also section Figure 4.7 and Table 1). The decrease in chl. a may be a result of either the limitation of light or the fungal or cyanobacterial colonies observed on fat particles during the cultivation period (Paper III; supplementary Figures).
29 Figure 4.3 Chl. a dynamics during the semi-continuous study on MAAS
process. A) Acclimatisation phase of the MAAS in UW. B) At different HRTs in UW. C) At 4 days HRT in treated wastewater (Dash dotted lines in B and C separate each cycle during the HRT study)
4.2 Bio-nutrient and COD removal
The removal of bio-nutrients such as N and P were studied in papers I, II and III as shown in Figure 4.4 A, B and C. In addition, organic carbon was studied in paper II. The average initial concentrations of N, P, COD and OC in papers I, II and III are shown in Table 1. In general, N and P were used to determine the removal efficiency of N and P in the results and discussion sections.
4.2.1 Nitrogen, phosphorous and organic carbon removal
Differences in light intensity and wavelength influenced the chl. a dynamics. Here nutrient removal is used to indicate the performance of the process. Figure 4.4 A shows the results of nutrient removal obtained from indigenous microalgae cultivation with different lighting (paper I). The removal of N after the preliminary experiment showed similar response with the FL, 68 ± 6 % and PWM-LED 1, 72 ± 3 %. The residual concentrations (rd) were 9.60 ± 1.70 and
8.60 ±0.84 mg L-1 in UW, as presented in paper I (Figure 4.4 A). On the other
30
to FL (52 ± 2 %) in TW. The remaining N concentrations after the treatment period were 6.64 ± 0.50 and 17.65 ± 0.64 mg L-1 in PWM LED 1 and FL
respectively.
In both cases, the PWM-LED 2 with lack of white light (46 ± 6 %, TW and 58 ± 10 %, UW) showed a lower removal of N regardless of wastewater. The corresponding rd values were 21.77 ± 3.76 and 11.43 ± 2.94 mg L-1. Overall, it
can be reasoned that bacterial oxidation of organic compounds and nitrification favoured an increase in micro-algal concentration as observed in the previous section (see section 4.1.1). The nitrate based micro-algal growth may increase the pH due to the consumption of H2CO3 in the flasks as discussed in paper I
(Krustok et al., 2016). Also, the intensity of white light in the PWM-LEDs played a vital role in the assimilation of nutrients. Therefore, an intense white LED could be a good candidate for microalgae cultivation in the UW. Kim et al. (2013) reported a similar study where white light increased the micro-algal growth in wastewater with the addition of blue and red light.
Further, the shift in pH showed 80-93% (rd of 0.26–0.4 mg L-1) removal of
P with UW (paper I), whereas in the case of TW similar removal was observed with PWM-LED 1 (73.66 ± 7.92 %, rd = 0.21 ± 0.10 mg L-1) and FL (70.35 ±
5.76 %, rd = 0. 29 mg L-1). The removal was lower with PWM-LED 2 (45.77 ±
1.31 %, rd = 0.53 mg L-1), although the initial concentrations were very low
(Table 1). This was due to the slow growth as observed from chl. a dynamics (Figure 4.1 A and B). 0 10 20 30 40 50 60 70 80 90 100
UWW TWW UWW TWW UWW TWW
FL PWM-LED 1 PWM-LED 2
%
RE
TN TP
31 Figure 4.4 Removal of bio nutrients. A) Removal of TN/N and TP/P during
different light regime. B) Removal of N, P and OC at different HRTs in UW and C) Removal of N and P in iron flocculated wastewater. 0 10 20 30 40 50 60 70 80 90 100
RI RII RI RII RI RII
HRT- 6 HRT- 4 HRT- 2 % RE TN TP OC