2019; 5(2): 81-100
Published by the Scandinavian Society for Person-Oriented Research Freely available at https://www.person-research.org
https://doi.org/10.17505/jpor.2019.08
Therapeutic Chaos
Guido Strunk
a,b,cand Anna Lichtwarck-Aschoff
da Complexity-Research, Schönbrunner Str. 32 / 20, A-1050 Vienna, Austria
b Department of Entrepreneurship and Economic Education, Faculty of Business and Economics, Technical University Dortmund, Germany c Department of Integrated Safety and Security, FH Campus Vienna, Austria
d Behavioural Science Institute, Radboud University, Montessorilaan 3, 6525 HR Nijmegen, The Netherlands
Email address to authors:
guido.strunk@complexity-research.com a.lichtwarck-aschoff@bsi.ru.nl
To cite this article:
Strunk, G., & Lichtwarck-Aschoff, A. (2019). Therapeutic chaos. Journal for Person-Oriented Research, 5(2), 81-100. https://doi.org/10.17505/jpor.2019.08
Abstract:
The conventional view on interventions as mechanistically causing interchangeable clients to get better hascome under attack. Group-based and linear approaches fall short in adequately describing the idiosyncratic and dynamic nature of treatment processes. Non-linear dynamic system theories in contrast hold great potential to better conceptualize and understand the generalities and idiosyncrasies of psychotherapeutic change processes. The aim of this study was to examine whether we can detect markers of complex dynamical systems behavior in two single-case therapies. All sessions from both therapies were coded with sequential plan analysis using a 10s sampling frequency. The coding system incorporates verbal and non-verbal behaviors and allows for the representation of contextualized interactive behaviors. The high sampling fre-quency results in long time series, which allowed us to apply non-linear analysis techniques. We found strong support for complex behavior and the existence of a butterfly effect, i.e., a relatively short prediction horizon in which reliable predic-tions about the system’s future behavior could be made. Further, critical fluctuapredic-tions as a marker for phase-transipredic-tions were detected that were accompanied with different interactional patterns in both therapies. Finally, there was strong support for self-organized pattern formation, with a few interactional patterns dominating the interaction. Considering that we are in-tervening on complex dynamical systems means that we have to (1) acknowledge the principal individuality of change processes, (2) accept the fundamental limitations of the mechanistic input-output model of treatment effects and (3) appre-ciate the impossibility of long-term predictions of treatment responses.
Keywords:
non-linear dynamic system theories, process research, client-therapist interaction, complexity,self-organization, critical fluctuations.
Introduction
Since 1995 empirically supported therapies (ESTs) has become the buzzword for evidence-based practice (Task Force on Psychological Intervention Guidelines, 1995). It is hard to argue against the fact that finding out what may work or not work for any given client at any given time is of crucial importance for clinical practice. The question of what counts as good evidence, however, is the source of ongoing and heated debate ever since the inception of the term empirically supported therapies (Carey & Stiles, 2016; Chambless & Ollendick, 2001; Duncan & Reese, 2012;
Shedler, 2018; Westen, Novotny, & Thompson-Brenner, 2004). Influenced by evidence-based medicine and rooted in a medical view on mental disorders and interventions, the dominating approach of evaluating ESTs has been group-based and symptom-reduction focused (van Os et al., 2019). From this perspective treatment is understood as one uniform process, as if it were a type of prescribed pill that works the same for everyone (Stiles & Shapiro, 1989). The underlying claim of causality is one of intervention causal-ity (Carey & Stiles, 2016; Van Geert & Steenbeek, 2014). That is to say, when we find an effect, which takes the form of differences between group averages, this is seen as an
intrinsic property of the manipulated variable (i.e., the in-tervention). The reasoning continues that if the effect ‘force’ lies in the intervention itself, the effect should apply to every single subject in the group. From this point of view the goal is to optimize and to control interventions. Manua- lized treatment programs are thought to guarantee the qual-ity of interventions and to avoid unintended variabilqual-ity of effects caused by client or therapist factors, or arbitrary environmental inputs. Within this tradition, randomized controlled trials are seen as the gold standard to test the effectiveness of interventions, because it is thought that through randomization and experimental or statistical con-trol of error variance, the influence of unintended factors is eliminated.
This view on psychological interventions “…as com-prising active ingredients, supplied by the therapist to the client…” (Stiles & Shapiro, 1989, p. 522) has come under serious attack, not the least by advocates of common or non-specific factors research. The idea of active ingredients has been challenged by various meta-analyses demonstrat-ing that the effect of treatment-specific elements and inter-vention manuals is actually smaller than non-specific fac-tors such as therapeutic alliance, treatment expectation or allegiance, and resources or stressors in the client’s every- day environment (Luborsky & Singer, 1975; Orlinsky et al., 2004; Wampold, 2015; Wampold & Imel, 2015). Several studies have demonstrated that clinical improvement is not necessarily ‘triggered’ by certain specific interventions (Bozog & Bühler, 1988; Orlinsky & Howard, 1987) and significant changes in symptoms often occur before specif-ic interventions are being applied (Heinzel et al., 2014; Kelly et al., 2007; Kelly et al., 2005). Moreover, adherence to treatment protocols does not seem to matter much and in fact produces only small effect sizes (Owen & Hilsenroth, 2014; Wampold, 2015). Similarly, so-called component studies (dismantling or additive studies) show that compo-nents of treatment programs can be rearranged or even eliminated without affecting the overall effectiveness of the treatment (Ahn & Wampold, 2001; Bell et al., 2013; Bozog & Bühler, 1988; Wampold, 2015; Wampold & Imel, 2015).
Further, the primary focus on the therapist and his or her techniques as the causal mechanism of change has been fundamentally questioned by more humanistic accounts of clinical change, which state that “it is the client who makes therapy work” (Bohart & Tallman, 2010; p. 94; but also Duncan et al., 2011; Orlinsky & Howard, 1987). Client factors in fact account for the largest proportion of variance in therapeutic outcome, varying from 40% (Asay & Lam-bert, 1999) up to 87% (Wampold, 2013). Additionally, em-pirical findings on self-generated care, spontaneous recov-ery, placebo effects and posttraumatic growth further sup-port the role of the client as an active agent in his or her personal change process (for an overview, see Bohart & Tallman, 2010). Against this background it is hard to as-sume that clients are passive, inert and interchangeable objects upon which techniques are administered that mechanistically cause them to get better.
Recently, a renewed emphasis on non-linear dynamic systems accounts of psychopathology can be observed in the field of psychiatry and clinical psychology (Cramer et al., 2016; Granic & Patterson, 2006; Hayes & Strauss, 1998; Hayes et al., 2015; Nelson et al., 2017; Schiepek, 2003; Schiepek et al., 1997; Schiepek & Strunk, 1994b; Strunk & Schiepek, 2006, 2014; Tschacher et al., 1992; Walter et al., 2010). This view is not new to psychology (e.g. Koffka, 1922; Lewin, 1935, 1951), but empirical work based on non-linear dynamic systems is still scarce (see Schiepek, Heinzel, et al., 2016).
In contrast to the medical disease model, which (im- plicitly) conceptualizes psychopathology as some sort of static and discrete entity, these approaches share the as-sumption that psychopathology is an emergent state, a dy-namically stable higher-order (macro) state, that evolves over the course of time through self-organization processes of lower-order (micro) elements (Haken, 1977). From this perspective it follows that we have to reconsider the mech-anistic perspective on intervention effects and move beyond simple one-way cause effect models (such as the well- known Stimulus-Response-Consequence model; for an excellent discussion of this point see Miller et al., 1960) and linear change models. Linear systems, regardless of how complicated they are, can only produce simple behav-ioral patterns (i.e., monotonic increase/decrease and simple cycles). Psychological processes including treatment pro-cesses, however, are erratic (an der Heiden, 1992; Hayes et al., 2007; Mackey & an der Heiden, 1982), unpredictable and non-trivial (von Foerster, 1970). Non-linear dynamical systems theory and applications thereof have proven their merit in understanding a host of phenomena observed in living systems (an der Heiden, 1992; Babloyantz & Destexhe, 1987; Deutsch, 1994; Freeman, 2000; Haken, 1977; Lotka, 1925; Mackey & an der Heiden, 1982; Olsen et al., 1988; Paluš et al., 2001; Scheffer et al., 2009; Scheffer et al., 2012; Thelen & Smith, 1994, 2006; Thelen & Ullrich, 1991). We therefore suppose that a non-linear dynamic systems approach holds great potential to better understand the generalities and idiosyncrasies of psycho-therapeutic change processes. Key properties of non-linear dynamic systems that are relevant to the study of psycho-therapeutic change processes are complexity, self- organization and phase transitions.
Complexity. The most prominent property of a non-linear dynamical system is self-organized complexity. It came as a big surprise when for certain mathematical systems, which today are referred to as non-linear dynamical systems, it was discovered that these systems on the one hand exhibit orderly and patterned behavior and at the same time also show behavior that is highly erratic and unpredictable (Strunk, 2019; Strunk & Schiepek, 2006, 2014). The basic nature of non-linear dynamical systems is that variables are dynamically related, which means that variables act upon
one another and by doing so change their properties. The very fact that elements are dynamically related creates posi- tive and negative feedback1 processes among those
ele-ments. In non-linear dynamical systems, we have a very peculiar situation, in which we can observe positive and negative feedback processes occurring simultaneously (i.e., mixed feedback, an der Heiden & Mackey, 1987), and it is precisely this mixture of positive and negative feedback processes that makes the behavior of non-linear dynamic systems complex (see the discussion in Strunk, 2019).
An essential feature of complexity is that even if we know all the elements of the system and the rules that govern the interactions of those elements, our (long-term) prognosis of future behavior of the system will be poor (Lorenz, 1963, 1972; Poincaré, 1890, 1904; Ruelle & Tak-ens, 1971; Strunk & Schiepek, 2014). Take for example the weather, a well-known non-linear dynamical system (Lo-renz, 1963), where a forecast is reliable for two days ahead but prediction after that time window becomes highly un-certain and unreliable. One of the reasons for the funda-mental long-term unpredictability is the sensitive depend-ency of the dynamics on its initial conditions and on small fluctuations during the process (the so-called ‘butterfly effect’, Lorenz, 1963, 1972).
Non-linear dynamical systems are thus often exhibiting highly complex dynamical patterns, which are generated by the interplay of the variables within the system. This means that complexity is the result of self-organizational processes and therefore also shows characteristics of well-organized order. Hence, order and complexity are two sides of the same coin in non-linear dynamical systems.
Self-organization. Complexity and order in non-linear dynamical systems theories are not explained as the result of external causes (like a stimulus that triggers conditioned behavior) but as a result of processes in which the system organizes itself. Key to self-organization is that there is no ‘master plan’ or internal prescription that dictates the pos- sible states of the system (Haken, 1977). Rather, self- organization processes among micro elements lead to the emergence of certain temporal, spatial and functional macroscopic structures (i.e., order parameters), which in their turn constrain and enslave the interactions among the micro elements (Haken, 1977). Although potentially there is an infinite number of possible states, self-organization predicts that a number of dominant states will emerge due to the internal dynamics of the system (Haken, 1977; Pri-gogine, 1955; Prigogine & Stengers, 1984). Therefore, the result of a self-organization process of a system can be viewed as an equilibrium state such as in Piaget’s model of a “schema” (Bartlett, 1932; Piaget, 1977) or a “gestalt”
1 Positive feedback interactions among system elements amplify
par-ticular variations, which leads to the emergence of novelty. Negative feedback causes elements to be linked and minimizes deviation through which the system converges to its attractor, the preferred state of the sys-tem.
with respect to gestalt-theory (e.g. Koffka, 1922; Lewin, 1935, 1951). A system develops a self-organized pattern (schema, gestalt), also called an attractor state, and is able to protect this pattern against external and internal disturb-ances. Such an attractor can be a beneficial and positive state but also a problematic and hindering pattern. Conse-quently, psychotherapy can be seen as changing self- organized patterns by a process called phase-transition.
Phase transition as a model for therapeutic change. Non-linear dynamical systems are multi-stable, that is, they have the property to show very different behavioral patterns. The self-organization process described above can produce qualitatively different attractor states depending on the in-fluences of the internal or external system environment (so called control-parameters). In addition, such systems can switch between different attractor states, which is called a ‘phase transition’. During a phase transition the system first loses its ability to defend its pattern against external influ-ences (critical slowing down, Haken, 1977, p. 110; Haken, 1990, p. 9), after which a new self-organizing process kicks in. At the micro level the system searches for a new attrac-tor state by exhibiting numerous possible patterns (critical fluctuations, Haken, 1990, p. 9, Haken & Schiepek, 2006; Schiepek & Strunk, 2010). This increased variability allows for new configurations to emerge or to be discovered (for a similar argument see Thelen & Smith, 1994; Van Geert & Van Dijk, 2002). After a short while negative feedback loops are setting in and stabilizing the system in a newly developed dominant macroscopic structure. The occurrence of critical fluctuations is therefore a marker of a system undergoing a phase transition, which in the case of a psy-chotherapeutic process is a necessary condition for a posi-tive change. This conception resonates well with theories from the psychotherapy literature, in which the general goal of therapy is often described as breaking down a rigid psy-chopathological state and shaking loose old patterns, to trigger a qualitative shift towards more healthy and flexible patterns of functioning (Carey, 2011; Hayes & Strauss, 1998; Hayes et al., 2015; Mahoney, 1991).
Based on these characteristic properties of non-linear dynamical systems behavior the aim of the current study was to demonstrate that therapeutic processes indeed ex-hibit characteristics of complex behavior generated by a non-linear dynamical system. In particular we focused on one specific therapeutic process: the therapeutic relation-ship between client and therapist. We have chosen this par-ticular process because it is widely accepted that the thera-peutic relationship (also referred to as alliance) is one of the key processes within treatment across different theoretical orientations. The therapeutic relationship is not separate from any specific intervention, rather the relationship is “an essential and inseparable part of everything that happens in therapy” (Horvath et al., 2011, p. 15). Psychotherapy can be understood as a special interpersonal relationship that takes place under certain professional conditions (cf. Czogalik, 1989, 1991). The effort of therapists to establish a fruitful relationship, on the basis of which psychotherapy can take
place, thus becomes a means which itself generates thera-peutic changes and provides the foundation for further change to occur (cf. already Bordin, 1979; Horvath & Lub-orsky, 1993; Rogers, 1957).
In the current study we have taken a micro perspective on the therapeutic relationship, that is, we were interested in the dynamics of the therapeutic relationship as it unfolds within the interaction between client and therapist across the entire course of a treatment trajectory. More specifically, micro-coded therapy sessions (10s intervals) of two client therapist dyads were analyzed to investigate if we can de-tect markers of complex dynamical systems behavior in those therapeutic interactions. We expected to find the fol-lowing generic markers of non-linear dynamical systems: (1) complex behavior and limited long-term predictability (i.e., butterfly effect), (2) the occurrence of critical fluctua-tions as a marker for phase-transifluctua-tions and a necessary con-dition for therapeutic change, and (3) self-organized pattern formation. The results presented here are an excerpt and new compilation of results that were earlier published in German only by Strunk (2004; see also Strunk, 2006; Strunk et al., 2006).
Methods
Case Descriptions
In this study two therapies were selected, provided by an experienced male therapist (age = 40), working with sys-temic solution-oriented brief therapy (de Shazer, 1985) at the Psychological Research and Counselling Centre of the University of Bamberg, Germany.
Therapy I. This therapy lasted 13 sessions. The client was female, in her late 20s, married and mother of a 2-year-old son. She came into therapy because she wanted to become more assertive, being better able to defend and protect herself against the demands of her husband, family, and parents-in-law. She felt rejected by her mother-in-law, which undermined her confidence in being a good mother. In conflict situations with her family, she felt overwhelmed and helpless and reacted with physical complaints (stomach problems, tachycardia, sweating, circulatory disorders). From the 9th session onwards improvements became visi-ble. She started to regularly take some time for herself, payed more attention to her diet, got involved in a mothers’ initiative and started following courses for professional development. Nevertheless, according to the client the therapy was only partly successful because she still suf-fered from several complaints at the end of treatment.
Therapy II. This therapy lasted 9 sessions. The client was female, in her mid 30s, living in a second marriage with her son (age unknown) from the first marriage. Her primary concern was the conflictual relationship with her husband. Her stance towards the recurring conflicts was very ambivalent. On the one hand she had a high need for har- mony, but at the same time she felt helpless and incompe-tent. Next to the relationship problems, other problems (i.e.,
agoraphobic behavior patterns) were also the focus of ther-apy. She further wanted to clarify her goals and gain a bet-ter sense of what she wanted to accomplish in life. Im-provements were visible from the 7th session onwards and intensified in the 8th session. At the end of therapy her personal goals were reached and her life satisfaction had improved substantially.
Coding
All therapy sessions were video-recorded and transcribed. The transcripts not only included verbal information but also non-verbal (gestures, posture, gaze direction) and para- verbal aspects (pitch, volume, intonation). The raw data (video-recordings and transcripts) was coded with a method called sequential plan analysis (first published in Richter et al., 1994; Schiepek, Schütz, et al., 1995; Schiepek & Strunk, 1994a, 1994b; Schiepek, Strunk, et al., 1995), which is based on Caspar’s static plan analysis (Caspar, 1986, 1995). The plan concept was first introduced by Miller et al. (1960) who defined a plan as a unit that includes a goal and the means chosen in order to reach the goal. Thus, an interac-tional plan is one used to reach interacinterac-tional goals like the search for help from others or to give advice to others. In the context of the current study the sequential plan analysis was used to describe the client’s and therapist’s aims and means of shaping the therapeutic relationship.
Naturally, interactional goals and the means to reach them are person-specific, that is they differ from person to person, and they are contextualized, that is they are em-bedded within a specific relational context. Thus, accord-ingly and in contrast to many other quantitative coding systems there are no predefined categories that are used for everyone, but a plan analysis is developed inductively from the raw data for each individual case, which makes it more similar to qualitative content analysis. Categories are first treated as hypotheses about the goals and means a person is trying to achieve. These hypotheses are then continuously tested and validated in an iterative process.
Next to being person-specific, the sequential plan analy-sis is also hierarchical. At the lowest level are the so-called operators in which all aspects of the conversation, verbal, non-verbal, and para-verbal, of client and therapist, are considered. These operators are thus the concrete behaviors of client and therapist and form the foundation of the se-quential plan analysis, which are coded in – in our case – 10s intervals. Inductively these operators are then inter-preted as concrete means for the first-level plans. For ex-ample: client behaviors such as looking at the therapist, leaning back, and asking “how should I behave?”, and on another occasion asking “is this normal?”, were interpreted as concrete means for the first-level plan ‘Request advice’. Other concrete operators such as “I am afraid of getting sick” and “I worry about the future” were grouped into an-other first-level plan ‘Express your fears’. As we move up in the hierarchy of the plans these two first-level plans are aggregated into more abstract second-level plans, in this
case: ‘Ask for help’. The highest level of the hierarchy re- presents categories of more superordinate goals of how one wants to present oneself as a social being within the inter-actional context. In this particular case the two second-level plans ‘Ask for help’ and ‘Refer to external causes for your
problems’ were grouped into the self-presentation category ‘Demonstrate helplessness’. The levels are thus becoming increasingly abstract, whereas the low levels are strongly connected to the concrete behaviors (i.e., the operators).
Self-representation (top-level plans)
Second-level plans First-level plans Operators Needs Behavior Goals Means
- looks at the therapist leans back - “how should I behave?” - “is this normal?” request advice ask for help refer to external causes for your problems demonstrate helplessness
Figure 1. Schematic Structure of a Sequential Plan Analysis
A sequential plan analysis consists of (1) operators as behavioral indicators, (2) first-level plans, (3) second-level plans, and (4) self- presentation categories as top-level. Example: the client, full of expectations, looks at the therapist, leans back and says “how should I behave?” and on another occasions asks “is this normal?” These operators are brought together under a first-level plan named ‘Request advice’ and together with other first-level plans to a second-level plan ‘Ask for help’. The client also often stresses that she is not to blame for her problems but others. These behaviors were grouped under another second-level plan named ‘Refer to external causes for your problems’. Both second-level plans can be seen as to serve a hierarchically higher goal, namely to demonstrate helplessness. Thus, these two second-level plans were placed under the self-representation category ‘II. Externalization / demonstration of helplessness’, shortened in the figure with: ‘Demonstrate helplessness’. The plan analysis method is based on the concrete behavior of client and thera-pist. The illustration can only show a very limited part of it. The fact that the two lower level plans were assigned to the higher level plan ‘Demonstrate helplessness’, results from the concrete way in which help is requested and how external reasons for the problem are put forward.
Importantly, each of the operators is exclusively attached to one particular first-level plan, as are first-level plans ex-clusively assigned to one of the second-level plans. In sum, the plan analysis results in a hierarchy of (1) operators as behavioral indicators for (2) first-level plans, and (3) second-level plans, which consist of a set of first-level plans. Finally, (4) second-level plans are aggregated into general self-presentation categories (Friedlander & Schwartz, 1985) as top-level plans. See Figure 1 for the schematic structure and an example of a sequential plan analysis.
Sequential plan analysis extends the static plan analysis developed by Caspar (1986, 1995) with a temporal dimen-sion, that is, one indicates which interactional plan is acti-vated at any given time point. In the current study, therapy sessions were coded in 10s intervals, in each of which the operators were coded based on the hierarchical structure outlined above, such that each interval received a 0 or 1 for each plan to indicate whether it was activated within that interval or not. This results in dichotomous (activated, not
activated) and multi-dimensional (several plans can be ac-tivated at the same time) time series, one for the therapist and one for the client (see Figure 2). Note that whether several operators, serving the same plan, are active simul-taneously is not visible here. A plan is considered activated (and thus receives a 1) as soon as one operator is coded within the time frame. In order to generate a more fine- graded time series, the active behavioral operators were counted and weighted on the basis of a 5-step rating scale. A cautious look for instance was rated with a 1 for the plan ‘Request advice’ whereas a clear verbal statement asking for advice was rated as a 5 for the plan ‘Request advice’. At the top-level (i.e., the self-representation categories), the behavioral operators and their weightings were added (weighted sum of activated operators) to produce finely graduated time series (for illustration see figure 3a and 3b).
Strategy of Analysis
activation patterns of plans (so-called plan scores, similar to music scores) and time series of the self-presentation categories (top-level plans) as well as product moment cor-relations between the therapist’s and client’s self-presenta- tion categories. All data coding, data processing and analy- ses were performed with software programmed by Guido Strunk, especially GChaos (www.complexity-research. com), a software for non-linear time series analysis.
(1) Identification of complex behavior and limited long-term predictability. Several ways exist to determine the degree of complexity in a given data set. The presence of a butterfly effect, which is – mathematically speaking – an exponential divergence of trajectories, is the gold stand-ard in order to demonstrate the complexity of a time series. The butterfly effect can be estimated using several methods (e.g., Kantz, 1994; Rosenstein et al., 1993; Wolf et al., 1985). But the common ground is that one starts by search-ing for two points within the time series that are maximally similar to each other. From those two starting points the system’s behavior is closely monitored to see whether the trajectories converge (conservative system with no com-plexity) or diverge exponentially (butterfly effect, a sign of complexity). In the case of a random process the diver-gence is instantaneously at its maximum. So the method is able to distinguish between order, complexity and random-ness (see also Strunk, 2009) by modeling the convergence or divergence of trajectories with an exponential function. The value of the exponent (i.e., the largest Lyapunov Ex-ponent, LLE) is a measure of the complexity of the system.
Since exponential growth is characterized by very little change in the beginning and then a rapid divergence, like an avalanche, the time period until the avalanche starts is the predictive horizon of the system – that is, the time window in which we can make accurate predictions about the system’s future behavior. The algorithm of Rosenstein, Collins and de Luca (1993) as implemented in GChaos was used to estimate the LLE and the predictive horizon. The therapist’s and client’s time series were analyzed separately and changes in LLE over time were estimated in a moving window of 500 data points. Surrogate data analysis was used to test whether the butterfly effect was the result of the temporal organization of the data. The main idea behind surrogate data analysis is that we want to compare our par-ticular non-linear metric (i.e., LLE) estimated from the available time series to the distribution of the same metric obtained from a large number of time series (i.e., surrogate data) that satisfy the null hypothesis of a random process with the same statistical moments as the original time series (Schreiber & Schmitz, 2000).
(2) Critical fluctuations and structural changes. The strength of the butterfly effect (i.e., the LLE) can change over the course of a time series. The standard deviation of the LLE within a given time point can be used as an indi-cator for the presence of critical fluctuations (i.e., a peak in the standard deviation of the LLE indicates critical fluctua-tions). We used a 50 data point moving window to calculate the changes in the standard deviation of the LLE. These
changes were then correlated with changes in the self- representation categories in order to examine the structural changes in interactional plans that were associated with critical fluctuations.
(3) Self-organized pattern formation. In order to investi-gate if the plan activations follow a self-organized pattern formation we looked at the frequency distributions of the on-off patterns of second-level plans. As we have explained earlier several (second-level) plans can be activated (and not activated) at the same time. This means that at any giv-en time in the therapy many differgiv-ent patterns are possible, each representing a specific combination of activated plans. We can then use the simple logic of combinatorics to esti-mate what the expected likelihood of any given combina-tion would be and test this expected likelihood against the observed frequency distribution of the combinations. If the observed patterns (combinations of activated second-level plans) are indeed the result of self-organized pattern for-mation we expect to find a frequency distribution that fol-lows a power-law function, with some patterns occurring extremely often and some occurring only rarely.
It is important to emphasize that the methodological ap-proach that we have chosen should be considered as just an example. It is one way of analyzing psychotherapeutic processes against the background of non-linear dynamic systems theories and principles. There may be other meth-ods and analytical approaches that are equally suited to address similar or related research questions. Additionally, individual case analyses are unsuited to prove the existence of certain phenomenon once and for all. They can show, however, whether a phenomenon exists at all and whether the existence in the given individual cases gives reason to assume that similar phenomena should at least be expected in other cases.
Results
Descriptive Results
The time series of Therapy I (13 sessions) comprised 3450 time points and Therapy II (9 sessions) contained 2030 time points, sampled at 10s intervals. Both therapies were coded with a total of 17 second-level plans (10 thera-pist, 7 client) and 7 self-representation categories (top-level plans, 4 therapist and 3 client). The therapist’s plans – both second- and top-level – were identical across both therapies. Both clients also had identical self-representation catego-ries (top-level) but three of the seven second-level plans were of different content. A plan score of the second-level plans for a section of both therapies are shown in Figure 2. The time series of the self-representation categories are shown in Figure 3a and 3b.
When we look at the evolution of the self-representation categories over time (see Figures 3a and 3b) we can imme-diately see that there are no clear trends or patterns in the time series. They look erratic.
Figure 2. Score of Plan Activation Patterns
The figure shows sequences of plan activations of second-level plans from the first session of Therapy I (above) and Therapy II (below). Every black box indicates the activation of a second-level plan. The duration for each column is 10 seconds. Clear differ-ences in the activation patterns are visible to the naked eye. Especially the difference in the second-level plan ‘Protect yourself from threatening changes’ is striking. The naming of plans is shortened in the figure.
Show competence Encourage a trusting relationship Show understanding Motivate her Encourage her to reflect on her patterns of thinking Confront her... Activate her Show her that she is responsible Guide her focus of attention Give her structure
Demonstrate strength and competence Make clear that things have been difficult Be a good client Refere to external causes for your problems Ask for help Show interest in solving your problems Protect yourself from threatening changes
Client Therapist
Show competence Show yourself sympathetic and as a good client Show understanding Motivate her wortlich ist
Encourage her to reflect Confront her... samkeit Activate her Show her that she is responsible Guide her focus of Give her structure
Demonstrate strength Make clear that things have been difficult Show your human qualities
Demonstrate helplessness Lack of progress is not your fault Show interest in solving your problems Protect yourself from threatening changes Client Therapist Motivate her Confront her... 0 96 Session 1 0 96 Session 1
.
Therapist
I. Encourage t rust / cr eate secur e atmosphere II. Confro ntation / exposing to insecurity III. Encourage se lf-responsibility of t he client IV. Active str uctu ring workClient
I.Search for sympathy /
appreciation / go od relationship II. Externalization / demonstration of helplessness III. Problem-o rien ted work (s el f-rel ated nes s vs. avoidance) 0 6.0 12.0 18.0 24.0 30.0 0 3.0 6.0 9.0 12.0 15.0 18.0 0 4.5 9.0 13.5 18.0 0 400 800 1200 1600 2000 2400 2800 3200 2.5 5.0 7.5 10.0 12.5 15.0 0 4.5 9.0 13.5 18.0 0 6.0 12.0 18.0 24.0 30.0 36.0 0 400 800 1200 1600 2000 2400 2800 3200 6.0 12.0 18.0 24.0 30.0 -6.0
Figure 3b. Time Series for Therapy II
Time series for all self-representation categories are shown. The time series are shortened here. The feedback phase, which often takes place in systemic therapies, was not coded here because of its fundamentally different dynamic structure.
Therapist I. Encourage t rust / cr eate secur e atmosphere II. Confro ntation / exposing to insecurity III. Encourage se lf-responsibility of t he client IV. Active str uctu ring work Client I.
Search for sympathy /
appreciation / go od relationship II. Externalization / demonstration of helplessness III. Problem-o rien ted work (s el f-rel ated nes s vs. avoidance) 0 3.0 6.0 9.0 12.0 15.0 18.0 0 2.5 5.0 7.5 10.0 12.5 0 1.5 3.0 4.5 6.0 7.5 9.0 0 300 600 900 1200 1500 1800 2.5 5.0 7.5 10.0 12.5 0 3.0 6.0 9.0 12.0 15.0 18.0 0 2.5 5.0 7.5 10.0 12.5 15.0 0 300 600 900 1200 1500 1800 6.0 12.0 18.0 -6.0 -12.0
Also the association between the client’s and therapist’s self-representation categories over time does not reveal any clear pattern. In Figure 4 the correlation, calculated in a moving window of 50 data points, between the therapist's self-representation category ‘I. Encourage trust / create
secure atmosphere’ and the client’s self-representation cat-egory ‘III. Problem-oriented work (self-relatedness vs. avoidance)’ is displayed. The average correlation is r =.03 (n.s.) but varies dramatically between -.44 (p = .001) and .60 (p < .001)
Figure 4. Changing Correlations between Therapist and Client
The figure shows the course of the correlation between the self-representation category of the therapist ‘I. Encourage trust / create secure atmosphere’ and the client’s self-representation category ‘III. Problem-oriented work (self-relatedness vs. avoidance)’ of Therapy I (cf. Figure 3a), each calculated for a window of 50 measurement points. The calculation window is moved by one data point after each calculation, resulting in a correlation time-series which is shorter than the original time-time-series. The correlation time-time-series is therefore centered in the figure (it starts later and ends earlier. Relatively high positive and high negative correlations are clearly visible, but no simple trend or pattern can be detected.
Table 1. Correlations between Client’s Critical Fluctuations and Self-representation Categories Therapy I Therapy II
Client
I. Search for sympathy /
appreciation /good relationship CorrelationP (2-tailed) N -.0942846 .000 -.3771476 .000 II. Externalization / demonstration of
helplessness
Correlation .104 -.217
P (2-tailed) .000 .000
N 2846 1476
III. Problem-oriented work
(self-relatedness vs. avoidance) CorrelationP (2-tailed) N -.2452846 .000 -.2821476 .000
T
hera
pi
st
I. Encourage trust / create secure
at-mosphere CorrelationP (2-tailed) N 2846 .000.117 -.2991476 .000 II. Confrontation / exposing to
insecu-rity CorrelationP (2-tailed) N 2846 .249.000 1476 .537 .000 III. Encourage self-responsibility of
the client
Correlation -.127 .585
P (2-tailed) .000 .000
N 2846 1476
IV. Active structuring work CorrelationP (2-tailed) -.047.011 .580 .000
N 2846 1476 0 400 800 1200 1600 2000 2400 2800 3200 0.4 0.8 1.0 -0.4 -0.8 -1.0
St an d ar d D ev iat io n o f LL E
Figure 5. Phase Transitions and Critical Fluctuations
The LLE is a measurement of the butterfly effect, indicating chaos in both therapies. Changes in LLE are visible with the naked eye and are interesting because they are markers for phase transitions and therefore for dramatic changes in the ther-apies. In order to identify most obvious changes, we have calculated the standard deviation of LLE. Peaks in the standard deviation indicate the presence of critical fluctuations (rapidly changing LLE). Black arrows point to synchronized critical fluctuations for client and therapist.
Identification of Complex Behavior and
Limited Long-term Predictability
The separate analysis of client and therapist as well as the analysis of the entire therapy time series revealed clear signs of a positive LLE, which indicates the presence of a butterfly effect. The median LLE (the median is given here because the LLE changes in time) for Therapy I was 0.2 bit/sample (min = .03 bit/sample, max = .4 bit/sample) and for Therapy II the median was 0.3 bit/sample (min = .1 bit/sample, max = .4 bit/sample). This means that after 10 to 15 time steps, the maximum divergence of closely lo-cated starting points is reached and hence, after 150 sec-onds (2.5 minutes) at the latest, due to the butterfly effect a prediction of the system behavior is no longer possible. The results of the surrogate test showed that no LLE could be
determined for the shuffled data sets which means that the LLE results for both therapies are indeed due to the tem-poral and non-linear structure of the data and are not based on random processes.
Critical Fluctuations and Structural Change
The strength of the butterfly effect changes abruptly during the course of both therapies. Plotting the standard deviation of the LLE, calculated in a 50 data point moving window, across the therapies reveals sudden increases of critical fluctuations several times over the course of the therapies. These sudden increases of critical fluctuations occur partly synchronously and partly independently be-tween client and therapist. If the four largest rashes are marked, two of them occur simultaneously in the therapist Therapy I Therapist LLE 0 0.1 0.2 0.3 0.4 0.5 S tand ar d D evi ati o n of L LE 0 0.025 0.050 0.075 0.100 0.125 Cl ie n t LL E 0 0.1 0.2 0.3 0.4 0.5 St anda rd De vi ati on of L LE 0 400 800 1200 1600 2000 2400 2800 3200 0.029 0.057 0.086 0.114 0.143 0.5 0.4 0.3 0.2 0.1 0 0.5 0.4 0.3 0.2 0.1 0 0.125 0.100 0.075 0.050 0.025 0 0.143 0.114 0.086 0.057 0.029 0 400 800 1200 1600 2000 2400 2800 3200 0 0.1 0.2 0.3 0.4 0.5 0 0.029 0.057 0.086 0.114 0.143 0 0.1 0.2 0.3 0.4 0.5 0 300 600 900 1200 1500 1800 0.020 0.040 0.060 0.080 0.100 Therapy II 0.5 0.4 0.3 0.2 0.1 0 0.5 0.4 0.3 0.2 0.1 0 0.143 0.114 0.086 0.057 0.029 0 0.100 0.080 0.060 0.040 0.020 0 300 600 900 1200 1500 1800
and client time series, meaning that therapist and client are critically fluctuating at the same time (see Figure 5).
In Table 1 correlations between the increase in critical fluctuations and the seven self-representation categories is presented. In Therapy I critical fluctuations in the client’s time series were accompanied by increases in confrontation by the therapist. At the same time the client’s problem solving went down and helplessness increased. The thera-pist increasingly refrained from demanding her personal responsibility and instead tried to convey security. Overall, correlations between the client’s critical fluctuations and the self-representation categories are not that high in Ther-apy I, but it seems that in times of critical fluctuations the client in Therapy I feels overwhelmed, being drawn to-wards a behavioral pattern that is not very helpful for her therapeutic progress.
In Therapy II we can observe a quite different pattern. Again, increases in critical fluctuations of the client were associated with increases in confrontation by the therapist, but also increases in the therapist’s promotion of the cli-ent’s personal responsibility and active structuring of the therapeutic work. At the same time the therapist’s provision
of trust and security went down. The client on the other hand, similar to Therapy I showed decreases in problem solving but also reductions in seeking approval and demon-strating helplessness. Overall, correlations were substan-tially higher in Therapy II and the pattern seems to suggest that this client is not overwhelmed in times of critical fluc-tuations, and that client and therapist fall into a behavioral pattern that promotes client empowerment and constructive therapeutic work.
Self-Organized Pattern Formation
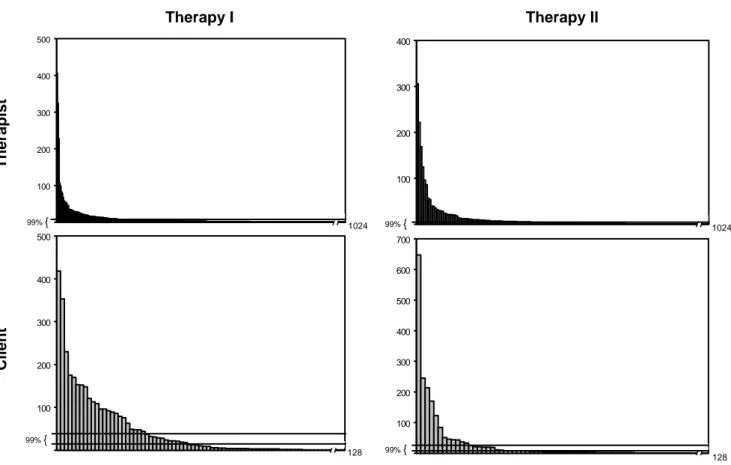
In addition to indicators of chaos and complexity, the data also clearly demonstrate self-organized pattern for-mation. In both therapies, therapist and client deviate sig-nificantly from a random on-off pattern and show a charac-teristic profile of pattern occurrence. That is, there are very few patterns that occur with a very high frequency after which the frequency of patterns decreases based on a power-law function, meaning that there are numerous pat-terns that occur only very rarely, i.e., once or twice over the entire therapy sessions (see Figure 6).
Therapy I Therapy II The rap ist 0 100 200 300 400 500 1024 0 100 200 300 400 500 128 99% { 99% { 0 100 200 300 400 1024 0 100 200 300 400 500 600 700 128 99% { 99% { C lient
Figure 6. Frequency Distributions of Plan Activation Patterns
The drawn interval limits show the expected frequencies according to an equal distribution (confidence interval of 99%). The form of the distribution corresponds to a so-called 1/fx distribution, which may be an indication of self-organized
In Therapy I the most frequent pattern (n = 418, 12% of overall time samples) shown by the client was a combina-tion of the following second-level plans: ‘Make it clear that you had a hard time’, ‘Be a good client’, ‘Demand help from the therapist’ and ‘Show interest in solving your problems’. This pattern characterizes her as a committed client who is willing to work and at the same time demands support. In five of her therapy sessions (session 6, 8-10, 12) this pattern was the most frequent state and in all other ses-sions this pattern was among the seven most frequent ob-served states. Only the last session (session 13) forms an exception in that this particular pattern was rarely observed. The most common therapist behavior in Therapy I is characterized solely by the second-level plan ‘Activate her’ (n = 405; 12%), which belongs to the self-representation category ‘Promoting the client’s personal responsibility’. All other frequently occurring patterns also center around this second-level plan (i.e., active her). Up until the 12th session it is the most frequently observed second-level plan, being present in every constellation. The therapist-client interaction seems to center around a theme of the client being cooperative but at the same time being afraid, and resistant. The therapist tries to activate her and encourages her to cooperate. Many of his interactional efforts are grouped around this goal.
In Therapy II the most frequently observed client pattern (n = 647; 32%) is made up of the two second-level plans: ‘Demonstrate helplessness/search for compassion/support’ and ‘Show interest and willingness to solve your problems’. This combination presents her as a committed client seek-ing help and beseek-ing willseek-ing to actively participate in the therapy. This plan constellation was the dominating pattern across all sessions. The most common therapist behavior is characterized by the second-level plan ‘Motivate her’ (n = 306; 15%), which nicely fits with her willingness to coop-erate.
Discussion
In this article we presented data of two single cases of therapeutic processes which in fact share key characteris-tics of non-linear dynamical systems: First and as expected, the interactional process between client and therapist showed clear signs of complexity. At first sight, when looking at the evolution of the self-representation catego-ries and the association between therapist and client cate-gories over time, no clear patterns and trends could be de-tected. It is evident that aggregating across time and/or subjects and applying linear analysis techniques would not reveal any meaningful information about this complex process (see also Fisher et al., 2018; Molenaar, 2004; Strunk, 2005 for a similar argument).
Analysis of the butterfly effect showed that the predic-tive horizon in which reliable predictions about the sys-tem’s future behavior could be made was relatively short.
After 2.5 minutes the trajectories of closely located starting points were totally divergent. The analyses presented here were based on two single cases and the predictive horizon within those cases. A related question with high clinical relevance is the relative divergence (i.e., butterfly effect) across clients with similar starting points. In other words, do clients with for example the same diagnosis show simi-lar change trajectories? The answer seems to be no, they do not. An initial investigation by Strunk and Schiepek (2014) based on client’s daily self-ratings of the therapeutic pro-cess and analyzed with a method called Cross-LLE showed that after 5-6 days a maximum divergence was reached. Thus, trajectories of clients with the same diagnoses started to diverge after only a few iterations. This finding is in line with a recent study by Rubel and colleagues (2019) who used the nearest neighborhood approach to identify clients with similar pretreatment characteristics to improve predic-tions of individual clients. Results showed that the ap-proach did not improve predictions, which we think is due to the butterfly effect. Only slight differences in starting conditions can lead to totally divergent trajectories.
Second, we found evidence of the presence of critical fluctuations and found that these periods were associated with distinct interactional patterns in both therapies. In both cases critical fluctuations were associated with confronta-tion from the therapist. In Therapy I, however, the client responded with increased helplessness and reduced prob-lem solving, and the therapist increased his provision of security and refrained from demanding her responsibility. This was the therapy that was deemed less successful. In Therapy II a different pattern was observed. In times of critical fluctuations, the client showed decreases in problem solving but also reductions in seeking approval and demon-strating helplessness. The therapist on the other hand in-creased active structuring of the therapeutic work and pro-motion of responsibility. This pattern might suggest a more constructive therapeutic interaction resulting in a better treatment outcome. The finding of the existence of critical fluctuations is in line with previous work using different time scales and analytical techniques (e.g., Fartacek et al., 2016; Haken & Schiepek, 2006; Hayes & Strauss, 1998; Hayes et al., 2015; Leemput et al., 2014; Licht-warck-Aschoff et al., 2012; Olthof et al., 2019; Schiepek, Eckert, et al., 2016; Wichers et al., 2016). These studies moreover suggest that periods of critical fluctuations and destabilization are associated with better treatment out-comes, which supports the claim that successful therapy indeed involves a (cascade) of phase transitions.
Finally, the frequency distribution of the various plan ac-tivation combinations showed clear signs of self-organized pattern formation. In both therapies frequency distributions clearly deviated from a random pattern and instead showed a power-law function, with a few plan activation combina-tions dominating the interaction. In sum, this unprecedent-ed data set of two cases with high-quality and high-density
data allowed us to test formal predictions of non-linear dy-namic systems theories and we found clear markers of complex dynamic behavior.
It is important to note that single case studies by defini-tion are unsuited to tell us how frequent a certain phenom-enon is and whether the phenomphenom-enon can be generalized to other cases. Rather single case studies are designed to demonstrate the existence of a phenomenon in the cases investigated. This represents sort of an opposite to the clas-sical discussion between Popper (1959) and the logical empiricists; hypotheses concerning the existence of some-thing are never completely falsifiable, but can be verified by a few proofs (cf. Groeben & Westmeyer, 1975).
Against the background of our results and similar find-ings in the literature (e.g., Fartacek et al., 2016; Olthof et al., 2019; Wichers et al., 2016), we advocate that at least the possibility of chaos in psychotherapeutic processes should be considered. This does not mean that we can as-sume that every therapy necessarily shows characteristics of chaos, non-linearity and phase-transitions, but that at least the possibility of chaos exists. In that sense our two case studies should be considered as convincing ‘counter-examples’ to falsify the simplified one-way cause effect and linear change models now dominating the field of interven-tion science. Our case studies demonstrate that this frame-work does not hold given the observed data and that we should expand our theoretical conception of intervention effects and the (long-term) predictability of treatment tra-jectories.
First, under conditions of non-linearity treatment can no longer be seen as a separate causal factor mechanistically producing (linear) relations between input (e.g., dosage, technique) and output (e.g., improvements in symptoms), but a factor whose functional role is dynamically embedded in an idiosyncratic network of multiple components. In that sense, causality is placed within the system rather than out-side, independent of the system’s dynamic. Consequently, applying interventions with expectable outcomes and ‘con-trolling’ treatment processes becomes impossible and hence an attitude of modesty and humility towards the feasibility of goal-directed change is warranted. Rather than pushing interventions on clients, non-linear dynamic systems theo-ries imply that psychotherapy has to provide conditions for self-organization to occur (Gelo & Salvatore, 2016; Haken & Schiepek, 2006; Hayes et al., 2015; Pincus, 2009; Schiepek & Strunk, 1994b; Strunk & Schiepek, 2002).
A detailed description of these conditions is beyond the scope of this article, and descriptions with much greater detail can be found elsewhere (see Haken & Schiepek, 2006; Hayes et al., 2015; Strunk & Schiepek, 2014). But it may be worthwhile for future research to learn from physi-cal systems and experiments about how change is brought about in these systems. Basically, these conditions have to do with the activation of control parameters, creating stable boundary conditions, destabilization and amplification of deviating feedback and stabilization of new attractors (Strunk & Schiepek, 2014). A crucial point in the
under-standing of interventions from a nonlinear dynamic system perspective – and especially when it comes to personaliza-tion of treatment – is their sensitivity to the process. In oth-er words, equally important as the question of what kind of treatment approach is realized is the question of when cer-tain interventions take place (process-sensitivity) (see Na-hum-Shani et al., 2015 for a similar argument). From this point of view, manualized and pre-defined treatments may be contra-productive.
Second, our results suggest that a client’s behaviour and response to treatment is unpredictable, at least in the long run. Certain starting values and conditions (e.g. pre- treatment conditions such as diagnosis) lose their predictive power only after a short period of time. Consequently, navigating a client’s treatment process becomes like driving a car in heavy fog: go very slowly, with maximum attention, ready to stop at any moment (Strunk & Schiepek, 2014). One important implication of this long-term unpredicta- bility is the critical need of high frequency data on a cli-ent’s change process, that is (almost) real-time monitoring, to be able to navigate a client’s treatment process under these ‘foggy’ conditions.
In our case we had 10s interval data, a sampling fre-quency which we realize is hard to implement in everyday clinical practice. In the current study, however, we were interested in the interactional dynamics underlying the therapeutic relationship. If that is the phenomenon one is interested in, such a dense sampling frequency, which al-lows a capture of the interactional dynamics is what is re-quired (see the work of Ramseyer & Tschacher, 2011 with similar high-frequency data). It is important that the sampling frequency matches the phenomenon of interest (see also Strunk, 1996; Thelen & Ullrich, 1991; Van Geert, 2006 for a similar argument).
There are other therapeutic processes that take place on slower time-scales and hence require fewer data to capture their dynamics. The analytic approaches that we presented here require extremely long time series (e.g., the LLE for instance can only be calculated with time series > 500 data points) but if the focus lies on other – slower – processes one can use different analytical approaches for shorter time series that can still be used to search for markers of com-plexity. For instance, we have recently conducted a study with daily self-ratings (median 59 days) in a mood dis- ordered sample and have used a complexity algorithm (de-veloped by Schiepek & Strunk, 2010) calculated in a 7-day moving window, which enabled us to detect critical fluctu-ations that were indicative of phase transitions (Olthof et al., 2019).
Thus, although some of the analytical strategies in the non-linear dynamic systems tool box may require lengths of time series not typically available in the clinical context, we are excited about the methodological advancements for shorter time series and the technological innovations to collect the type of intensive longitudinal data that will eventually lead to converging evidence for the notion of therapeutic processes as complex dynamical processes.
There are now increasingly more studies using experience sampling (i.e., several measurements within a day) or daily sampling procedures to collect intensive longitudinal data (Fisher & Boswell, 2016; Myin-Germeys et al., 2009; Nel-son et al., 2017; Schiepek, 2009; van Os et al., 2013; Wichers, 2014; Wigman et al., 2013). Studies in clinical settings demonstrate the clinical feasibility and utility of those personalized, contextualized and dynamic assess-ments (e.g., M. Bak et al., 2016; Kramer et al., 2014; Palmier-Claus et al., 2013; Schiepek, Aichhorn, et al., 2016). Consideration and close monitoring of the actual system dynamics, based on process-sensitive feedback will allow clinicians to tailor their interventions, that is, to dy-namically adjust their intervention efforts to the state that a client is in (see also Nahum-Shani et al., 2015; van Os et al., 2013; van Os et al., 2019).
One of these considerations of the dynamic state that the client is in concerns the identification of critical fluctua-tions periods that may function as windows of opportunities or sensitive periods in a client’s change process (see the concept of cairos by Haken & Schiepek, 2006; Schiepek, Schütz, et al., 1995 and Granic et al., 2006 for similar ar-gument). An interesting avenue for future research would be to test whether clients are more susceptible to interven-tion efforts during these destabilizainterven-tion periods compared to more stable periods in the change process. Increased sensitivity to influences during destabilization periods have been demonstrated in other fields (motor science, Haken et al., 1985; Schöner et al., 1986; cognitive performance, Stephen et al., 2009; Kruse et al., 1992; Stadler & Kruse, 1990, learning and didactics Sender, 2017). Also simulation studies of Schiepek and colleagues (Schiepek et al., 2017) illustrate the sensitive dependencies of intervention effects. Thus, rather than assuming that specific therapeutic tech-niques trigger goal-directed change irrespective of the dy-namic state a client is in, non-linear dydy-namic systems theo-ries predict that it is the stability of a system that deter-mines if inputs will elicit change or not.
To conclude, we here presented two clinical case studies analyzed from a non-linear systems perspective. Although there is a growing interest for a complex dynamic systems perspective in the field, we feel that the radical implications of this approach are not always well appreciated. If we consider that we are intervening on complex dynamical systems it means that we have to (1) acknowledge the prin-cipal individuality of change processes, (2) accept the fun-damental limitations of the mechanistic input-output model of treatment effects and (3) appreciate the impossibility of long-term predictions of treatment responses (see also Hawe, 2015). Consequently, professionals need to work under consideration and close monitoring of the actual sys-tem dynamics. For this, clinicians need process-sensitive feedback on the ongoing dynamics, especially on the stabil-ity or instabilstabil-ity of the client system. If those dynamic and personalized assessment approaches become integrated in clinical care we can use insights from non-linear dynamical systems theories to identify the optimal timing of
interven-tions, based on generic markers in the change process (i.e., critical fluctuations), and navigate a client’s treatment pro-cess under those ‘foggy’ conditions.
Acknowledgements
The coding of therapies was done by Monika Köhler, Klaus Richter, Petra Gruhl, Cornelia Schardt, and Jürgen Kraft.
Author contributions
(1) Contributions to conception and design (GST, AL-A), acquisition of data (GST), programming of data-base and analysis/graphic tools (GST), analysis of data (GST), and interpretation of data (GST, AL-A).
2) Drafting the article (AL-A, GST).
3) Final approval of the version to be published (AL-A, GST).
Action editor
Lars-Gunnar Lundh served as action editor for this article.
References
Ahn, H., & Wampold, B. E. (2001). Where oh where are the spe-cific ingredients? A meta-analysis of component studies in counselling and psychotherapy. Journal of Counseling
Psychology, 48, 251-257.
https://doi.org/10.1037/0022-0167.48.3.251
an der Heiden, U. (1992). Chaos in Health and Disease – Pheno- menology and Theory. In W. Tschacher, G. Schiepek & E. J. Brunner (Eds.), Self-Organization and Clinical Psychology.
Empirical Approaches to Synergetics in Psychology (pp. 55-87).
Berlin: Springer.
an der Heiden, U., & Mackey, M. C. (1987). Mixed Feedback: A Paradigm for Regular and Irregular Oscillation. In L. Rensing, U. a. d. Heiden & M. C. Mackey (Eds.), Temporal Disorders in
Human Oscillatory Systems (pp. 30-46). Berlin: Springer.
Asay, T. P., & Lambert, M. J. (1999). The empirical case for the common factors in therapy: Quantitative findings. In M. A. Hubble, B. L. Duncan & S. D. Miller (Eds.), The heart and soul
of change: Delivering what works in therapy (pp. 23-55).
Washington, DC: American Psychological Association. Babloyantz, A., & Destexhe, A. (1987). Strange Attractors in
Hu-man Cortex. In L. Rensing, U. a. d. Heiden & M. C. Mackey (Eds.), Temporal Disorders in Human Oscillatory Systems (pp. 48-57). Berlin: Springer.
Bak, M., Drukker, M., Hasmi, L., & van Os, J. (2016). An n= 1 clinical network analysis of symptoms and treatment in psy-chosis. Plos One, 11(9), e0162811.
https://doi.org/10.1371/journal.pone.0162811
Bak, P., & Chen, K. (1991). Self-organized Criticality. Scientific
American (January), 26-33.
and the 'Game of Life'. Nature, 342, 780-782. https://doi.org/10.1038/342780a0
Bartlett, F. C. (1932). Remembering, a Study in Experimental and
Social Psychology. Cambridge: Cambridge University Press.
Bell, E. C., Marcus, D. K., & Goodlad, J. K. (2013). Are the parts as good as the whole? A meta-analysis of component treatment studies. Journal of Consulting and Clinical Psychology, 81, 722-736. https://doi.org/10.1037/a0033004
Bohart, A. C., & Tallman, K. (2010). Clients: The neglected common factor in psychotherapy. In B. L. Duncan, S. D. Miller, B. E. Wampold & M. A. Hubble (Eds.), The heart and soul of
change: Delivering what works in therapy (pp. 83-111).
Wash-ington, DC: American Psychological Association.
Bordin, E. S. (1979). The generalizability of the psychoanalytic concept of the working alliance. Psychotherapy: Theory,
Research & Practice, 16(3), 252-260.
https://doi.org/10.1037/h0085885
Bozog, B., & Bühler, K. E. (1988). Wirkfaktoren der Psycho-therapie. Spezifische und unspezifische Einflüsse. Fortschritte
der Neurologie und Psychiatrie, 56, 119-132.
Carey, T. A. (2011). Exposure and reorganization: The what and how of effective psychotherapy. Clinical Psychology Review,
31(4), 236-248. https://doi.org/10.1016/j.cpr.2010.04.004
Carey, T. A., & Stiles, W. B. (2016). Some problems with ran-domized controlled trials and some viable alternatives. Clinical
Psychology & Psychotherapy, 23(1), 87-95.
https://doi.org/10.1016/j.cpr.2010.04.004
Caspar, F. (1986). Die Plananalyse als Konzept und Methode.
Verhaltensmodifikation, 4, 235-256.
Caspar, F. (1995). Plan analysis: Towards optimizing
psychother-apy. Seattle, WA: Hogrefe.
Chambless, D. L., & Ollendick, T. H. (2001). Empirically sup-ported psychological interventions: Controversies and evidence.
Annual Review of Psychology, 52(1), 685-716.
https://doi.org/10.1146/annurev.psych.52.1.685
Cramer, A. O. J., van Borkulo, C. D., Giltay, E. J., van der Maas, H. L. J., Kendler, K. S., Scheffer, M., et al. (2016). Major Depres-sion as a Complex Dynamic System. Plos One, 11(12), e0167490. https://doi.org/10.1371/journal.pone.0167490 Czogalik, D. (1989). Psychotherapie als Prozeß:
Mehrebene-nanalytische Untersuchung zu Struktur und Verlauf psycho-therapeutischer Interaktion. Habilitationsschrift, Universität Ulm.
Czogalik, D. (1991). Eine Strategie der Interaktions-
Verhaltenstherapie und Psychosoziale Praxis, 2, 173-186.
de Shazer, S. (1985). Keys to Solution in Brief Therapy. New York: Norton.
Deutsch, A. (Ed.). (1994). Muster des Lebendigen. Faszination
ihrer Entstehung und Simulation. Braunschweig: Vieweg Verlag.
Duncan, B. L., Miller, S. D., & Sparks, J. A. (2011). The heroic
client: A revolutionary way to improve effectiveness through
client-directed, outcome-informed therapy. John Wiley & Sons.
Duncan, B. L., & Reese, R. J. (2012). Empirically Supported Treatments, Evidence-Based Treatments, and Evidence‐ Based Practice. Handbook of Psychology, Second Edition, Volume 8.
Clinical Psychology. II. Psychotherapy.
https://doi.org/10.1002/9781118133880.hop208021
Fartacek, C., Schiepek, G., Kunrath, S., Fartacek, R., & Plöderl, M. (2016). Real-Time Monitoring of Non-linear Suicidal Dynam-ics: Methodology and a Demonstrative Case Report. Frontiers in
Psychology, 7(2), 1-14.
https://doi.org/10.3389/fpsyg.2016.00130
Fisher, A. J., & Boswell, J. F. (2016). Enhancing the personaliza-tion of psychotherapy with dynamic assessment and modeling.
Assessment, 23, 496-506.
https://doi.org/10.1177/1073191116638735.
Fisher, A. J., Medaglia, J. D., & Jeronimus, B. F. (2018). Lack of group-to-individual generalizability is a threat to human subjects research. Proceedings of the National Academy of Sciences
115(27), E6106-E6115.
https://doi.org/10.1073/pnas.1711978115.
Freeman, W. J. (2000). A Proposed Name for Aperiodic Brain Activity: Stochastic Chaos. Neural Networks, 13, 11-13. https://doi.org/10.1016/S0893-6080(99)00093-3
Friedlander, M. L., & Schwartz, G. S. (1985). Toward a Theory of Strategic Self-Presentation in Counseling and Psychotherapy.
Journal of Counseling Psychology, 32, 483-501.
https://doi.org/10.1037/0022-0167.32.4.483
Gelo, O. C. G., & Salvatore, S. (2016). A dynamic systems ap-proach to psychotherapy: a meta-theoretical framework for ex-plaining psychotherapy change processes. Journal of Counseling
Psychology, 63, 379-395. https://doi.org/10.1037/cou0000150.
Granic, I., & Patterson, G. R. (2006). Toward a comprehensive model of antisocial development: A dynamic systems approach.
Psychological Review, 113(1), 101-131.
https://doi.org/10.1037/0033-295X.113.1.101
Groeben, N., & Westmeyer, H. (1975). Kriterien psychologischer
Forschung. München: Juventa.
Haken, H. (1977). Synergetics. An Introduction. Nonequilibrium
Phase Transitions and Self-Organization in Physics, Chemistry
and Biology. Berlin, Heidelberg, New York: Springer.
Haken, H. (1990). Synergetics. An Introduction. Berlin: Springer. Haken, H., Kelso, J. A. S., & Bunz, H. (1985). A Theoretical Model
of Phase Transitions in Human Hand Movements. Biological
Cybernetics, 51, 347-356. https://doi.org/10.1007/BF00336922
Haken, H., & Schiepek, G. (2006). Synergetik in der Psychologie.
Selbstorganisation verstehen und gestalten. Göttingen: Hogrefe.
Hawe, P. (2015). Lessons from complex interventions to improve health. Annual Review of Public Health, 36, 307-323. https://doi.org/ 10.1146/annurev-publhealth-031912-114421 Hayes, A. M., Laurenceau, J.-P., Feldman, G., Strauss, J. L., &
Cardaciotto, L. (2007). Change is Not Always Linear: The Study of Nonlinear and Discontinuous Patterns of Change in Psycho-therapy. Clinical Psychology Review, 27, 715-723.
https://doi.org/10.1016/j.cpr.2007.01.008
Hayes, A. M., & Strauss, J. L. (1998). Dynamic systems theory as a paradigm for the study of change in psychotherapy: an applica-tion to cognitive therapy for depression. Journal of Consulting
and Clinical Psychology, 66, 939-947.
https://doi.org/10.1037/0022-006X.66.6.939
Hayes, A. M., Yasinski, C., Ben Barnes, J., & Bockting, C. L. H. (2015). Network destabilization and transition in depression: New methods for studying the dynamics of therapeutic change.