Significant changes in circulating microRNA by
dietary supplementation of selenium and
coenzyme Q10 in healthy elderly males. A
subgroup analysis of a prospective
randomized double-blind placebo-controlled
trial among elderly Swedish citizens
Urban Alehagen1*, Peter Johansson1, Jan Aaseth2, Jan Alexander3, Dick Wågsa¨ter4
1 Division of Cardiovascular Medicine, Department of Medical and Health Sciences, Linko¨ping University,
Linko¨ping, Sweden, 2 Research Department, Innlandet Hospital Trust, Elverum, Norway, and Hedmark University College, Elverum, Norway, 3 Norwegian Institute of Public Health, Oslo, and Norwegian University of Life Sciences (NMBU),Ås, Norway, 4 Division of Drug Research, Department of Medical and Health Sciences, Faculty of Health Sciences, Linko¨ping University, Linko¨ping, Sweden
*Urban.Alehagen@liu.se
Abstract
Background
Selenium and coenzyme Q10 is essential for important cellular functions. A low selenium intake is reported from many European countries, and the endogenous coenzyme Q10 pro-duction is decreasing in the body with increasing age. Supplementation with selenium and coenzyme Q10 in elderly have shown reduced cardiovascular mortality and reduced levels of markers of inflammation. However, microRNA analyses could give important information on the mechanisms behind the clinical effects of supplementation.
Methods
Out of the 443 healthy elderly participants that were given supplementation with 200μg Se/ day as organic selenium yeast tablets, and 200 mg/day of coenzyme Q10 capsules, or pla-cebo for 4 years, 25 participants from each group were randomized and evaluated regarding levels of microRNA. Isolation of RNA from plasma samples and quantitative PCR analysis were performed. Volcano- and principal component analyses (PCA)–plots were used to illustrate the differences in microRNA expression between the intervention, and the placebo groups. Serum selenium concentrations were measured before intervention.
Findings
On average 145 different microRNAs out of 172 were detected per sample. In the PCA plots two clusters could be identified indicating significant difference in microRNA expression between the two groups. The pre-treatment expression of the microRNAs did not differ between active treatment and the placebo groups. When comparing the post-treatment
a1111111111 a1111111111 a1111111111 a1111111111 a1111111111 OPEN ACCESS
Citation: Alehagen U, Johansson P, Aaseth J, Alexander J, Wågsa¨ter D (2017) Significant changes in circulating microRNA by dietary supplementation of selenium and coenzyme Q10 in healthy elderly males. A subgroup analysis of a prospective randomized double-blind placebo-controlled trial among elderly Swedish citizens. PLoS ONE 12(4): e0174880.https://doi.org/ 10.1371/journal.pone.0174880
Editor: Yiqing Song, Indiana University Richard M Fairbanks School of Public Health, UNITED STATES
Received: October 25, 2016 Accepted: March 15, 2017 Published: April 27, 2017
Copyright:© 2017 Alehagen et al. This is an open access article distributed under the terms of the
Creative Commons Attribution License, which permits unrestricted use, distribution, and reproduction in any medium, provided the original author and source are credited.
Data Availability Statement: Under Swedish Law, the authors cannot share the data underlying this study and cannot do any further research than what is specified in the ethical permissions application. For inquires on the data, researchers should first reach out to the owner of the database, the University of Linko¨ping. Please reach out to the corresponding author with requests and for
microRNAs in the active and the placebo groups, 70 microRNAs exhibited significant differ-ences in expression, also after adjustment for multiple measurements. For the 20 micro-RNAs with the greatest difference in expression the difference was up to more than 4 fold and with a P-value that were less than 4.4e-8.
Conclusions
Significant differences were found in expression of more than 100 different microRNAs with up to 4 fold differences as a result of the intervention of selenium and coenzyme Q10 com-bined. The changes in microRNA could be a part of mechanisms underlying the clinical effects earlier reported that reduced cardiovascular mortality, gave better cardiac function, and showed less signs of inflammation and oxdative stress following the intervention. How-ever, more research is needed to understand biological mechanisms of the protective effects of selenium and Q10 supplementation.
Introduction
Selenium (Se) is essential for a number of cellular functions. In the human selenoproteome 25 separate genes encodes for different selenoproteins[1]. Of those the intracellular glutathione peroxidase (GPX)-family including phospholipid hydroperoxide-, and gastrointestinal GPX, thioredoxin reductases (TXNRD) and extracellular selenoprotein P (SEPP 1) are important redox enzymes with a multitude of cellular and extracellular functions such as an anti-oxida-tive role [2,3] as well as endothelial protection[4].
About half of the selenium in whole blood is found in plasma, of which GPX-3 constitutes 25% and SEPP1 usually constitutes more than 60% [5]. SEPP1 is a main transporter of sele-nium from the liver to peripheral tissues [6]. Hurst et al. demonstrated that an intake of about total 100μg/d of selenium was needed in an adult UK population to achieve an optimal expres-sion of SEPP1, thus a supplemental intake of 50μg/d was needed, in addition to the habitual intake of ~55μg/d in order to obtain an optimal expression of the selenoprotein [7]. However the intake of selenium differs in various parts of the world [4] mainly due to varying selenium content in the soil [4]. For example, a significantly higher content of selenium could be found in the soils in North America than in Europe [4] with reported serum selenium levels of US cit-izens generally above 120μg/L[8,9], whereas in several European countries including the Nor-dic countries (Sweden, Norway, and Denmark), levels below 90μg/L have been reported. In Finland, the introduction of fertilizers with selenium have resulted in increased and presum-ably adequate levels[10]. Our group has recently reported mean serum selenium levels of 67.1μg/L in a healthy elderly Swedish population, corresponding to a low selenium intake. This low intake was associated with an increased risk for cardiovascular mortality [11]. Appar-ently optimal level of selenium in the body is important for human health.
Besides multiple selenoproteins, coenzyme Q10 is also one of the important antioxidants in the body [12]. The functions of these two classes are interrelated; the selenoenzyme TrxR1 being needed for the cell to reduce coenzyme Q10 (ubiquinone) to its active form ubiquinol [13,14]. Moreover, the synthesis of the selenocysteine-containing proteins requires a func-tional mevalonate pathway, of which coenzyme Q10 also is a product [15]. Because of a decline in the endogenous production of coenzyme Q10, only half of the production persists in the myocardium at the age of 80 years[16]. Based on these facts, an intervention with selenium assistance with data requests. If the university
approves the request, researchers can submit an application to the Regional Ethical Review Board for the specific research question that the researcher wants to examine.
Funding: Part of the analysis costs was supported by grants from Pharma Nord Aps, Denmark, the County Council of O¨ stergo¨tland, Linko¨ping University. The funding organizations had no role in the design, management, analysis, interpretation of the data, preparation, review or approval of the manuscript. No economic compensation was distributed.
Competing interests: Pharma Nord Aps, Denmark contributed to the main study through supplying the intervention preparations (selenium tablets, coenzyme Q10 capsules, and the corresponding placebo preparations). This does not alter our adherence to PLOS ONE policies.
and coenzyme Q10 was performed in healthy elderly community members for four years in a Swedish municipality. The results; a reduced cardiovascular mortality, improved cardiac func-tion, and less increase of the biomarker NT-proBNP are previously reported [17]. Furthermore the monitoring of the biomarkers sP-selectin, hsCRP, copeptin, and MR-proADM in blood samples showed signs of less inflammatory activation [18], and less oxidative stress [19] respectively. Supplementation with selenium and coenzyme Q10 reduced the mortality partic-ularly among those having the lowest selenium concentrations at baseline [20].
MicroRNAs, discovered in the beginning of 1990s [21,22], provide a new field of research, and today more than 2000 different microRNAs are known within the human genome [23,
24]. However, their role in diseases have only partially been evaluated, and the literature on their associations to cardiac diseases is sparse. The microRNAs play key roles in the regulation of the mammalian protein-encoding genes, which includes genes important for disease pro-cesses, healing as well as the production of selenoproteins. If the effects of an intervention with selenium and coenzyme Q10 combined could be traced to have an impact on the regulation of microRNAs, this would increase the understanding about the underlying mechanisms for the protective effects of the intervention with selenium and coenzyme Q10 and act as a further val-idation of the clinical results from our main study referred to above[17].
The aim of the present study was to explore if the intervention with selenium and coenzyme Q10 influenced the expression of circulating microRNAs in the same population.
Materials and methods
Study population
The basal characteristics of the study population is presented inTable 1.
In an epidemiological study in a rural municipality in Sweden that started in 1998, all par-ticipants in the age between 70–80 were invited to participate in the intervention study with selenium and coenzyme Q10. Of the 675 in this age span, 443 accepted participation in the study. All participants were examined by one of three experienced cardiologists. In all partici-pants a new clinical history was recorded and a clinical examination was obtained. The New York Heart Association functional class (NYHA class) was also assessed, a Doppler-echocardiographical examination was carried out and an ECG was registered. Blood pressure was measured in the right arm with the participant resting in supine position. All participants were supplemented for 48 months, and were re-examined at the end of each six-month period. All-cause and cardiovascular mortalities were registered[17].
The study protocol has previously been published [25]. The Medical Product Agency declined reviewal of the study protocol since the study was not considered a trial of a medica-tion for a certain disease but rather one of food supplement commodities that are commer-cially available. The study was approved by the Regional Ethical Committee (Diary no. 03– 176) and conforms to the ethical guidelines of the 1975 Declaration of Helsinki. Written, informed consent was obtained from all patients.
The intervention study was registered at Clinicaltrials.gov, and has the identifier NCT01443780.
Definitions
Diabetes mellitus was defined as having a fasting blood-glucose >7.0 mmol/L, or already undergoing treatment for diabetes (diet, oral therapy or insulin). Hypertension was defined as a resting blood pressure more than 140/90 mmHg as measured in the right arm or having a prior diagnosis of hypertension. Dyspnea was defined from the patient history, whereas pres-ence of peripheral edema was defined from patient history and/or clinical examination [17].
Ischemic heart disease was defined as a history of angina pectoris and/or treatment for ische-mic symptoms or on the basis of verified previous myocardial infarction. Cardiovascular mor-tality was defined as death caused by heart failure, and/or fatal arrhythmia, sudden death, ischemic heart disease or cerebrovascular disease.
Intervention study
Between 2003 and 2010 a population consisting of 443 representative elderly individuals were randomized in blocks of 6 in a double-blind manner and given either the active intervention or placebo. Thus 221 persons were given supplement of selenium + coenzyme Q10 (200μg Se/ day given as organic selenium yeast tablets (SelenoPrecise 200μg, Pharma Nord, Vejle, Den-mark), and 200 mg/day of coenzyme Q10 capsules (Bio-Quinon 100 mg B.I.D, Pharma Nord, Vejle, Denmark), and 222 persons received the placebo supplement (placebo group) in addi-tion to regular medicaaddi-tion. The intervenaddi-tion time was 48 months, and the median follow-up period was 5.2 years.
Study population for microRNA analysis
From the total study population of 443 participants, 25 male participants from the active treat-ment group, and 25 males from the placebo group were randomized and evaluated regarding microRNA, and constitutes the study population of the present study (Table 1). The
Table 1. Basal characteristics of the study population divided into active treatment and placebo.
Active treatment P-value Placebo Total study population
n 25 25 443
Age years mean (SD) 77.1 (3.5) 0.67 76.9 (3.1) 77.1 (3.5)
History Smokers n (%) 4 (16) 0.46 3 (12) 41 (9.3) Diabetes n (%) 4 (16) 0.31 7 (28) 95 (21.4) Hypertension n (%) 19 (76) 0.73 20 (80) 326 (73.6) IHD n (%) 6 (24) 0.73 5 (20) 100 (22.6) NYHA class I n (%) 16 (64) 0.39 13 (52) 226 (51.0) NYHA class II n (%) 6 (24) 0.35 9 (36) 125 (28.2)
NYHA class III n (%) 6 (24) 0.27 3 (12) 88 (19.9)
NYHA class IV n (%) 0 0 0 Unclassified NYHA n (%) 0 0 4 (1.0) Medications ACEI n (%) 3 (12) 0.27 6 (24) 89 (20.1) ARB n (%) 0 4 (16) 23 (5.2) Betablockers n (%) 8 (32) 0.15 13 (52) 153 (34.5) Digitalis n (%) 0 0 22 (5.0) Diuretics n (%) 8 (32) 0.56 10 (40) 158 (35.7) Statins n (%) 5 (20) 1.0 5 (20) 96 (21.7) Examinations EF<40% n (%) 3 (12) 0.64 2 (8) 33 (7.4)
Note: ARB; Angiotension receptor blockers; EF: Ejection fraction; IHD; Ischemic heart disease; NYHA: New York Heart Association functional class Note: In the table the subpopulations evaluated through microRNA analyses divided into active treatment and placebo has been presented regarding basal characteristics and compared to the total study population for the clearness of representativity of the subpopulations.
microRNAs were analysed at the study start and at the study end in both the intervention and the placebo groups.
Biochemical analyses
All blood samples were obtained while the patients were at rest in a supine position. The blood samples were collected in plastic vials containing EDTA (ethylenediamine tetracetic acid). The vials were placed on ice before chilled centrifugation at 3000g and then frozen at -70˚C, and no sample was thawed more than twice.
MicroRNA analysis
Isolation of RNA and real-time quantitative PCR analysis were performed by Exiqon A/S, Vedbaek, Denmark, as previously described [26].
Sample preparation
Total RNA was extracted from serum using the miRCURY™ RNA isolation kit- biofluids (Exi-qon A/S, Vedbaek, Denmark). In brief, 200μL of serum per sample, 60 μL of biofluids lysis solution containing 1μg carrier-RNA and RNA spike-in template mixture was added to the sample. 20μL protein precipitation solution was added and the tube was vortexed, incubated for 1 min at room temperature and centrifuged at 11,000g for 3 min. The clear supernatant was transferred to a new collection tube, and 270μL isopropanolol was added. The solutions were vortexed and transferred to a binding column. The column was incubated for 2 min at room temperature, and emptied using a vacuum-manifold. After that 100μL wash solution was added to the columns, the liquid was removed and 700μL wash solution was added. The liquid was removed using a vacuum-manifold. 250μL wash solution was added and the column was spun at 11,000g to dry the columns completely. The dry columns were transferred to a new collection tube and 50μL RNase free H2O was added directly on the membrane of the spin column to elute bound RNA. The column was incubated for 1 min at room temperature prior to centrifugation at 11,000g. The eluted RNA was stored in a -80˚C freezer.
MicroRNA real-time qPCR
SevenμL RNA was reverse transcribed in 35μL reactions using the miRCURY LNA™ Univer-salRT microRNA PCR, Polyadenylation and cDNA synthesis kit (Exiqon A/S) [26]. cDNA was diluted 50x and assayed in 10μLPCR reactions according to the protocol for miRCURY LNA™ Universal RTmicroRNA PCR. Each microRNA was assayed once by qPCR on the microRNA Ready-to-use PCR, serum panel using ExiLENT SYBR1Green master mix. The plasma panel includes 172 microRNAs validated to be significantly expressed in plasma. Negative controls excluding template from the reverse transcription reaction was performed and profiled like the samples. The amplification was performed in a LightCycler1480 Real-Time PCR System (Roche) in 384 well plates. The amplification curves were analysed using the Roche LC soft-ware, both for determination of Cq (by the 2ndderivative method) and for the melting curve analysis.
Data analysis
All assays were inspected for distinct melting curves and reactions with several melting points are removed from the data set. Reactions with amplification efficiency below 1.6, reactions with Cp values that are within 5 Cp of the negative controls and reactions with Cq>37 are removed from the dataset. microRNA-451 and 23a-3p were analysed to monitor hemolysis.
Using NormFinder software, the best normalizer was found to be the average of assays detected in all samples. All data was normalized to the average of assays detected in all samples (average-assay Cq). 145 assays were detected on average per sample. Data analysis was per-formed according to Exiqon´s recommendation.
Selenium analysis
The serum selenium analyses were performed using ICP-MS methodology at an Agilent 700 platform at Kompetenzzentrum fu¨r komplementa¨rmedizinische Diagnostik, Zweigniederlas-sung der synlab MVZ Leinfelden GmbH (Leinfelden-Echterdingen, Germany). The accuracy of the measurements was checked by analyzing two external reference materials with certified values of 63μg/L and 103 μg/L (control programme offered by the Society for Advancement of Quality Assurance in Medical Laboratories, INSTAND e.V., Du¨sseldorf, Germany), showing values within 90–110% of certified concentrations. A round-robin test with INSTAND e.V. always passed adequately. The precision of the method, checked by repetitive analyses of the same sera, showed an average coefficient of variation (CV) of 5.7%.
Statistics
Descriptive data are presented as percentages or mean and the standard deviation (SD). P-values < 0.05 were considered significant, based on a two-sided evaluation.
A Principal Component Analysis (PCA) was used to reduce the dimension of the large data set obtained, and in a PCA plot, the 50 microRNAs that had the largest variation across all samples. The largest component in the variation is plotted along the X-axis, and the second largest is plotted on the Y-axis.
Data of microRNA are shown as fold changes between the groups. Two-group comparisons were performed using Student T-test and false discovery rate (FDR) adjustment using the Ben-jamini-Hochberg (BH) adjusted p-value, correcting for multiple testing. P-values < 0.05 were considered statistically significant.
A power calculation has been performed applying 25 participants in each group, and a type I error (alpha) of 0.05. Of those 101 mRNAs of the total 145 that obtained significant differ-ences in mRNA expression, all had a power of >0,90, and more than 80% had a power of
>0.95 in a two-tailed analysis.
All data were analyzed using standard software (Statistica v. 13, Statsoft Inc, Tulsa, OK, USA.).
Results
Baseline characteristics
The basal characteristics of the two groups, actively treated and placebo groups, for further evaluations of circulating microRNA are presented inTable 1. From this it could be seen that the two groups are well balanced. In the study population about 22% of the participants had a history of ischemic heart disease, about 77% had a diagnosed hypertension, and about 15% were smokers, which is about the same proportions as in the total study group consisting of 443 and therefore we regard the group evaluated with microRNAs as representative of an elderly “healthy” population in Sweden.
MicroRNA evaluations
A PCR- panel was used for the study, and on average 145 microRNAs were detected per sample.
A heat map diagram was produced were the result of a two-way hierarchical clustering of the top 50 microRNAs with the highest standard deviation. The normalized values have been used and the samples are shown (Fig 1). In this, each row represents one microRNA, and each column represents one sample. The microRNA clustering could be seen on the left and includes the group receiving active intervention post treatment, whereas the others cluster in one group. The colour scale at the bottom illustrates the relative expression level of micro RNA across all samples, where red indicates an expression level above mean, and green repre-sents a level lower than the mean. The microRNAs cluster in two groups; one being up- and the other being down-regulated with largely opposite expression in the post active-treatment group vs. the remaining groups.
Principal Component Analysis plot
In the PCA plot (Fig 2), the 50 microRNAs that exhibited the largest variation across all sam-ples were projected. The samsam-ples seems to cluster with little difference between the pre- and post-placebo treatment groups and pre-active treatment groups, whereas the post-active treat-ment samples cluster as a clearly separate group indicating that the intervention resulted in dif-ferences in microRNA expression.
Fig 1. Heat map and hierarchical clustering of the study population in relation to micorRNA expression. Note: The clustering is
performed on all samples, and on the top 50 microRNAs with the highest standard deviation. The normalized (dCq) values have been used for the analysis.
Differentially expressed microRNAs post-treatment active treatment
group versus post-treatment placebo group
Comparing the post-treatment active group to the placebo group using Student´sT-test, 90
microRNAs were found to be differentially expressed using a cut-offP-value <0.05. Of those, Fig 2. A Principal Component Analysis (PCA) plot of the study population illustrating the changes pre-treatment versus post-treatment in expression of microRNAs in those on intervention with selenium and coenzyme Q10 versus those on placebo.
Note: The PCA analysis was performed on all samples, and on the top 50 microRNAs with the highest standard deviation. The normalized (dCq) values have been used for the analysis.
70 were still significant after correction for multiple measurements.S1 Tablepresents the
T-values of all evaluated mRNAs.
InTable 2, the 20 microRNAs that were most differentially expressed are presented. There were an increased expression of the microRNA as result of the intervention with sele-nium and coenzyme Q10 in the following microRNAs; miR-19b-3p, miR-93-5p, miR-16-5p, miR-29b-3p, miR-30e-5p, miR-140-3p, miR-22-3p, miR-363-3p and miR-451a, whereas the following microRNAs showed a decreased expression as a result of the intervention; miR-199a-3p, miR-26a-5p, miR-199a-5p, miR-221-3p, miR-151a-5p, miR-151a-3p, miR-130a-3p, miR-30c-5p, miR-191-5p, and miR-125a-5p.
As can be seen, all the 20 microRNAs have a highly significant difference in expression between the post treatment active treatment groups compared to the placebo group.
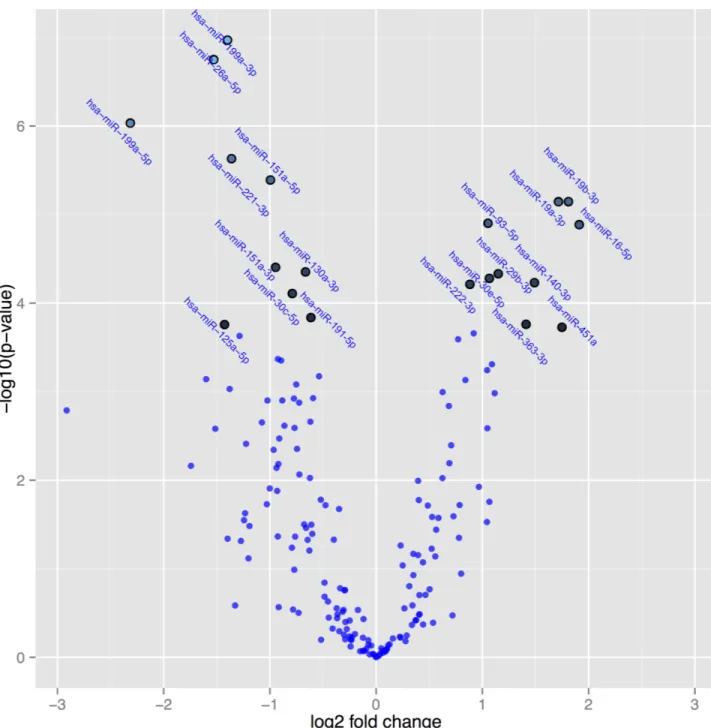
InFig 3, a volcano plot, the differentially expressed microRNAs active post-treatment versus placebo post-treatment are presented. The volcano plot is constructed by plotting the
P-values on the y-axis, and the fold change (ddCq) between the two experimental groups on
the x-axis so that up- and down regulations appear equidistant from the centre. Plotting the values in this way results in two regions that show microRNAs with the highest magnitude of fold changes and high statistical significance. The highlighted spots are the 20 microRNAs with the greatest difference in expression and with aP-value<0.05 after correction for multiple
measurements.
Table 2. Differential expressed microRNAs post-treatment active group versus post-treatment placebo group.
MicroRNA Fold change P-value BH adj. P-value Slope correlation coefficient
Hsa-miR-199a-3p -2.6 1.1e-7 0.000016 -0.42 Hsa-miR-26a-5p -2.9 1.8e-7 0.000016 -0.26 Hsa-miR-199a-5p -5.0 9.3e-7 0.000055 -0.24 Hsa-miR-221-3p -2.6 0.0000023 0.00010 -0.05 Hsa-miR-151a-5p -2.0 0.0000041 0.00014 -0.32 Hsa-miR-19b-3p 3.5 0.0000071 0.00018 -0.40 Hsa-miR-19a-3p 3.3 0.0000072 0.00018 -0.17 Hsa-miR-93-5p 2.1 0.000013 0.00026 -0.20 Hsa-miR-16-5p 3.8 0.000013 0.00026 -0.28 Hsa-miR-151a-3p -1.9 0.000039 0.00070 -0.42 Hsa-miR-130a-3p -1.6 0.000045 0.00071 -0.51 Hsa-miR-29b-3p 2.2 0.000048 0.00071 -0.21 Hsa-miR-30e-5p 2.1 0.000053 0.00072 -0.17 Hsa-miR-140-3p 2.8 0.000058 0.00073 -0.03 Hsa-miR-222-3p 1.8 0.000061 0.00073 -0.25 Hsa-miR-30c-5p -1.7 0.000078 0.00087 -0.07 Hsa-miR-191-5p -1.5 0.00014 0.0015 -0.06 Hsa-miR-363-3p 2.7 0.00017 0.0016 -0.10 Hsa-miR-125a-5p -2.7 0.00017 0.0016 -0.04 Hsa-miR-451a 3.4 0.00019 0.0017 -0.18
Note: BH adj: Benjamini-Hochberg adjusted P-value.
Note: The table shows the 20 microRNAs where the greatest difference could be demonstrated.
Note: The slope correlation coefficient indicates the relation between microRNA expression with regard to basal selenium concentration before intervention.
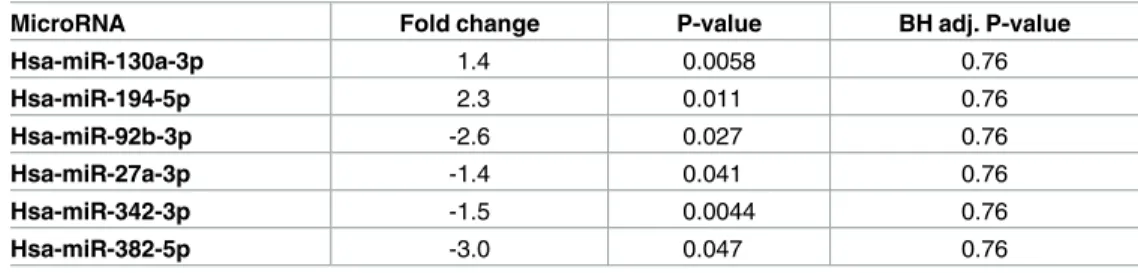
Differentially expressed microRNAs pre-treatment active group versus
pre-treatment placebo group
In order to evaluate that the above demonstrated changes partly could be explained by differ-ences in microRNA expression already before intervention we have compared the pre-treatment active group to the pre-pre-treatment placebo group using Student´sT-test. Only four
microRNAs were found to be differentially expressed using a cut-off level of 0.05. However,
Fig 3. A volcano plot illustrating the relation between P-values of the changes in expression of microRNAs, and fold change in active treatment post-treatment versus placebo post-treatment. Note: The highlighted spots are microRNAs with P-values below 0.05
after Benjamini-Hochberg correction for multiple testing. The top 20 microRNAs are shown.
after applying the Benjamini-Hochberger correction for multiple measurements, none of these differences persisted, indicating that no significant difference existed at the start of the inter-vention (Table 3).
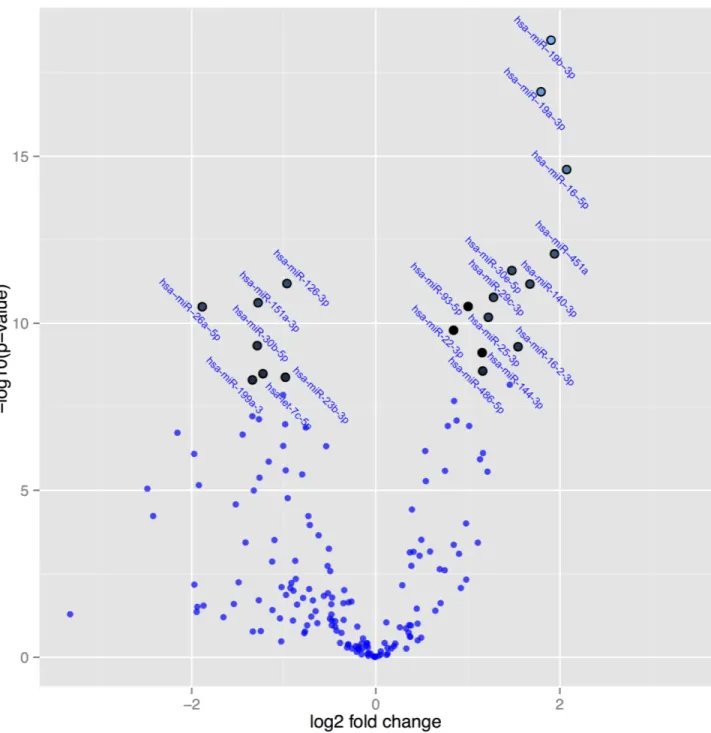
Differentially expressed microRNAs post-treatment active treatment
group versus pre-treatment active treatment group
Since the pre-treatment active group did not differ from the pre-treatment placebo group, as expected, we compared the microRNAs between the post-treatment and pre-treatment of the active group. From there 107 microRNAs were found to be differentially expressed. Applying correction for multiple measurements, still 101 microRNAs were differentially expressed after, compared with before treatment (Table 4). In general, the same microRNAs that demonstrated significant differences in expression between the intervention and the placebo groups could be found in Tables2and4.
InFig 4the microRNAs are presented where significant difference in expression after cor-rection for multiple measurements have been applied to the post-treatment and the pre-treat-ment active groups. The highlighted spots are the microRNAs with the greatest difference in expression and with aP-value <0.05 after correction for multiple measurements. As can be
seen, highly significant differences in expression of several microRNAs can be demonstrated comparing the intervention with the placebo group (Fig 4).
MicroRNA expression in relation to basal selenium concentration after
intervention
In the study population where microRNA have been evaluated, the basal serum selenium levels were also measured. Serum selenium concentrations between 36.0 to 103.4μg/L were
observed, and the majority of participants had low selenium concentrations, as have recently been reported [11].
The microRNA expression differed depending on the basal selenium level in spite of the same intervention dosage of selenium, and where the correlation coefficient differed between -0.03 to -0.51. In all evaluated microRNAs the slope of the graph was negative, as illustrated inFig 5.
Discussion
MicroRNA expression and intervention with selenium and coenzyme
Q10
In the present study we examined whether intervention with selenium and coenzyme Q10 as supplements in elderly males during 4 years on top of their ordinary medication was associated
Table 3. Differential expressed microRNAs post-treatment placebo group versus pre-treatment pla-cebo group.
MicroRNA Fold change P-value BH adj. P-value
Hsa-miR-130a-3p 1.4 0.0058 0.76 Hsa-miR-194-5p 2.3 0.011 0.76 Hsa-miR-92b-3p -2.6 0.027 0.76 Hsa-miR-27a-3p -1.4 0.041 0.76 Hsa-miR-342-3p -1.5 0.0044 0.76 Hsa-miR-382-5p -3.0 0.047 0.76
Note: BH adj: Benjamini-Hochberg adjusted P-value.
with changes in circulating microRNA. We could present substantial effects in the expression of a multitude of microRNAs, and the observed changes remained even after adjustments for multiple measurements. We have previously reported that the dietary supplementation with selenium and coenzyme Q10 during four years led to reduced cardiovascular mortality, less age-dependent increase in the biomarker NT-proBNP [17], less oxidative stress[19], and less inflammatory activity[18]. In the present study 178 microRNAs (S1 Table) were detected per sample. However, we present only the 20 microRNAs where the most substantial differences could be seen when comparing the active with the placebo group. In the literature the most extensive information on microRNAs comes from evaluation of different types of tumour dis-eases. Changes in microRNA related to cardiac function or cardiovascular risk factors are sparse. However, some interesting findings are noted.
We observed a 2.2 fold increase in expression of microRNA-29b-3p as a result of the inter-vention, presumably reflecting a protective role of the extracellular matrix genes around the myocardium. Kriegel et al. presented data regarding the microRNA-29 family that has shown repressive effects on 16in vivo confirmed extracellular matrix genes [27]. The different micro-RNA-29s are downregulated in the myocardium immediately after an infarction, as seen in mice. But during the healing process of the infarcted area, the expression of the extracellular matrix genes increases, and studies have shown a relationship between these genes and micro-RNA-29 [28].
A 2 fold increase of microRNA-30e-5p was found in our supplemented group compared with placebo. In a study on patients with acute heart failure, Ovchinnikova et al. found signifi-cantly decreased expression of microRNA-30e-5p, to about 50% of the levels found in controls
Table 4. Differential expressed microRNAs post-treatment active group versus pre-treatment placebo group.
MicroRNA Fold change P-value BH-adj. P-value
Hsa-miR-19b-3p 3.7 3.3e-19 5.9e-17
Hsa-miR-19a-3p 3.5 1.2e-17 1.0e-15
Hsa-miR-16-5p 4.2 2.5e-15 1.5e-13
Hsa-miR-451a 3.8 8.3e-13 3.7e-11
Hsa-miR-30e-5p 2.8 2.7e-12 9.5e-11
Hsa-miR-126-3p -1.9 6.4e-12 1.7e-10
Hsa-miR-140-3p 3.2 6.7e-12 1.7e-10
Hsa-miR-29c-3p 2.4 1.7e-11 3.7e-10
Hsa-miR-151a-5p -2.4 2.4e-11 4.8e-10
Hsa-miR-93-5p 2.0 3.0e-11 5.1e-11
Hsa-miR-26a-5p -3.7 3.2e-11 5.1e-10
Hsa-miR-25-3p 2.3 6.6e-11 9.8e-10
Hsa-miR-22-3p 1.8 1.6e-10 2.2e-9
Hsa-miR-30b-5p -2.4 4.7e-10 5.9e-9
Hsa-miR-16-2-3p 2.9 5.0e-10 5.9e-9
Hsa-miR-144-3p 2.2 7.4e-10 8.2e-9
Hsa-miR-486-5p 2.2 2.7e-10 2.8e-8
Hsa-let-7c-5p -2.8 3.2e-9 3.1e-8
Hsa-miR-23b-3p -2.0 4.1e-9 3.9e-8
Hsa-miR-199a-3p -2.5 5.0e-9 4.4e-8
Note: BH adj: Benjamini-Hochberg adjusted P-value.
Note: The table shows the 20 microRNAs where the greatest difference could be demonstrated.
[29], and Marfella et al. found an even more pronounced fall in expression of microRNA-30e-5p in heart failure patients compared with healthy controls [30]. Hence, increased expression could indicate raised protective protein production accompanied by diminished risk of heart failure, and presumably better cardiac function which accords with the clinical findings in the actively supplemented group previously reported [17].
Fig 4. A volcano plot illustrating the relation between P-values of the changes in expression of microRNAs, and fold change in active treatment post-treatment versus active treatment pre-treatment. Note: The highlighted spots are microRNAs with P-values below
0.05 after Benjamini-Hochberg correction for multiple testing. The top 20 microRNAs are shown.
Jickling et al. presented data showing that microRNA-19a had a decreased expression in patients with ischemic stroke [31]. In the present study a more than 3 fold increase in expres-sion of the microRNA-19a-3p could be noted. This might also indicate a protective effect of the intervention.
We also found a decreased expression of several microRNAs that all appear to be involved also in cardiovascular disease processes. This accords with observations by e.g. Da Costa Mar-tins et al. who found that increased expression microRNA-199a-5p was associated with myo-cardial hypertrophy [32]. Thus, a possible protective effect against myocardial hypertrophy by the intervention might be suggested.
Furthermore, we noticed a decrease in the expression of microRNA-130a-3p and RNA-191-5p in the supplemented group to be compared with a 2.5 fold increase of micro-RNA-130a in patients with moderate pulmonary hypertension and a more than 9 fold increase in patients with severe pulmonary hypertension as reported by Wei et al. [33].
The changed expressions of microRNAs resulting from the intervention with selenium and coenzyme Q10 in the present study may provide mechanisms for cardioprotective effects. However, the different microRNAs presented are also expressed in many other disease states, for example microRNA-140-3p is less expressed in lung cancer patients compared to healthy controls[34]. And according to Yang et al. an inhibitory effect on breast cancer progression and metastasis of raised microRNA-19a-3p may result [35].
Thus, the changed expression of the different microRNAs observed after supplementation with selenium and coenzyme Q10 may protect against cardiovascular disease as well as cancer. However, as the research area is new and presently not completely covered, more data will be needed to fully elucidate the relation between intervention of selenium and coenzyme Q10 and specific microRNAs.
MicroRNA expression and serum selenium concentration
We have recently reported that in 98% of the population evaluated in the present study a sele-nium deficiency defined as a serum concentration below the concentration for optimum
Fig 5. Scatterplot of expression of miRNA 130a-3p related to basal selenium concentration before intervention.
function of the SEPP1 could be seen[20]. In an interesting publication Xing et al, reported upregulated microRNAs (miR-16, miR-199a-5p and miR-30e), and downregulated micro-RNAs (miR-450a, miR-675, and miR3571) from those with selenium deficiency in a rat model [36]. However, following a selenium supplementation a downregulation of microRNAs could be seen in the selenium deficient animals (450a, 675 and miR3571, 675, miR-199a-5p, miR-16, miR195 and miR-30e), which is in agreement with the changes demon-strated in the majority of the microRNAs in the present human intervention study. It is so far demonstrated that the supplementation have clinical effects in terms of reduced inflammatory activity, less oxidative stress, and reduced cardiovascular mortality in comparison with pla-cebo. Some of the mechanisms behind this could be found in the changes in expressions of microRNAs, which are responsible for gene regulation and ultimately production of proteins such as TXNRD or SEPP1. Our results thereby show that the effects of selenium and Q10 may be mediated at the molecular level through changes in microRNA expression.
We have also evaluated the basal selenium concentration to the fold change of the expres-sion of the 20 microRNAs with the greatest fold change as a result of the intervention. To the knowledge of the authors, no such evaluation has previously been reported in the literature. It is interesting to note that even if the evaluated sample is small, the message is the same in a majority of the microRNAs analysed; a negative slope of the graph illustrating the fold change as the selenium concentration increases. This was both noted in the 10 microRNAs with increased expression as a result of the intervention, and in the 10 microRNAs with decreased expression (Table 2). The interpretation of this could be that the intervention was not enough to neutralize the deficiency in those with low basal selenium concentration, a fact that could be seen in those with no or low deficiency on selenium when given intervention. The result would therefore be that the microRNA expression differs between those low on selenium and those high on selenium before intervention, as could be seen inFig 5.
Limitations
The present report is based on male participants only, and with a restricted age span. Therefore the results could not automatically be extrapolated into other age classes, or even into female patients in the corresponding age span. However, we regard the data so interesting that the report should stimulate further research into other study groups.
Also, the study population consisted of a homogenous group of Caucasian males, a fact that also could restrict the extrapolation into other study groups.
A panel comprising the 172 microRNAs most commonly found in plasma was analysed. Out of the 2000 microRNA known to be expressed at higher levels in cells and tissues and less in plasma, we might have missed some.
Finally, the sample size of this study is small, especially the analysis of the microRNA expression depending on basal selenium concentration, however, it did not preclude finding some consistent changes in microRNA expression because of their magnitude.
Therefore we argue that the present report give new and important information.
Conclusions
MicroRNAs are important factors in the regulation of protein-encoding genes. As demon-strated previously, there is a selenium deficiency in the Swedish population. The present study is an evaluation of the changes in expression of microRNAs as a result of intervention with selenium and coenzyme Q10 in a healthy elderly population. We could demonstrate resulting significant differences in expression of more than 100 different microRNAs with up to 4 fold differences. The changes observed are compatible with previous studies on changes in
microRNA and cardiovascular diseases and selenium deficiency. These changes in microRNA could be a part of mechanisms underlying the clinical effects earlier reported for the same cohort, reduced cardiovascular mortality, better cardiac function, and less signs of inflamma-tion and oxdative stress following the interveninflamma-tion. However, more research is needed to understand biological mechanisms of the protective effects of selenium and Q10 supplementation.
Supporting information
S1 Table. Differential expressed microRNAs treatment active group versus post-treatment placebo group, all microRNAs.
(DOCX)
Author Contributions
Conceptualization: UA DW PJ. Data curation: UA DW. Formal analysis: UA DW. Funding acquisition: UA DW. Investigation: UA DW PJ. Methodology: UA DW PJ. Project administration: UA DW. Resources: UA DW.Supervision: UA DW J. Aaseth J. Alexander. Validation: UA DW.
Visualization: UA PJ.
Writing – original draft: UA DW PJ J. Aaseth J. Alexander.
References
1. Kryukov GV, Castellano S, Novoselov SV, Lobanov AV, Zehtab O, Guigo R, et al. Characterization of mammalian selenoproteomes. Science. 2003; 300(5624):1439–43.https://doi.org/10.1126/science. 1083516PMID:12775843
2. Traulsen H, Steinbrenner H, Buchczyk DP, Klotz LO, Sies H. Selenoprotein P protects low-density lipo-protein against oxidation. Free Radic Res. 2004; 38(2):123–8. PMID:15104205
3. Burk RF, Hill KE. Selenoprotein P: an extracellular protein with unique physical characteristics and a role in selenium homeostasis. Annu Rev Nutr. 2005; 25:215–35.https://doi.org/10.1146/annurev.nutr. 24.012003.132120PMID:16011466
4. Rayman MP. Selenium and human health. Lancet. 2012; 379(9822):1256–68. Epub 2012/03/03.
https://doi.org/10.1016/S0140-6736(11)61452-9PMID:22381456
5. Dumont E, Vanhaecke F, Cornelis R. Selenium speciation from food source to metabolites: a critical review. Anal Bioanal Chem. 2006; 385(7):1304–23. Epub 2006/07/11. https://doi.org/10.1007/s00216-006-0529-8PMID:16830114
6. Burk RF, Hill KE. Regulation of Selenium Metabolism and Transport. Annu Rev Nutr. 2015; 35:109–34.
https://doi.org/10.1146/annurev-nutr-071714-034250PMID:25974694
7. Hurst R, Armah CN, Dainty JR, Hart DJ, Teucher B, Goldson AJ, et al. Establishing optimal selenium status: results of a randomized, double-blind, placebo-controlled trial. Am J Clin Nutr. 2010; 91(4): 923–31. Epub 2010/02/26.https://doi.org/10.3945/ajcn.2009.28169PMID:20181815
8. Kafai MR, Ganji V. Sex, age, geographical location, smoking, and alcohol consumption influence serum selenium concentrations in the USA: third National Health and Nutrition Examination Survey, 1988–1994. J Trace Elem Med Biol. 2003; 17(1):13–8. Epub 2003/05/21.https://doi.org/10.1016/S0946-672X(03) 80040-8PMID:12755496
9. Bleys J, Navas-Acien A, Laclaustra M, Pastor-Barriuso R, Menke A, Ordovas J, et al. Serum selenium and peripheral arterial disease: results from the national health and nutrition examination survey, 2003–2004. Am J Epidemiol. 2009; 169(8):996–1003. Epub 2009/02/18.https://doi.org/10.1093/aje/ kwn414PMID:19221120
10. Alfthan G, Eurola M, Ekholm P, Venalainen ER, Root T, Korkalainen K, et al. Effects of nationwide addi-tion of selenium to fertilizers on foods, and animal and human health in Finland: From deficiency to opti-mal selenium status of the population. J Trace Elem Med Biol. 2015; 31:142–7.https://doi.org/10.1016/ j.jtemb.2014.04.009PMID:24908353
11. Alehagen U, Johansson P, Bjornstedt M, Rosen A, Post C, Aaseth J. Relatively high mortality risk in elderly Swedish subjects with low selenium status. Eur J Clin Nutr. 2016; 70(1):91–6.https://doi.org/10. 1038/ejcn.2015.92PMID:26105108
12. Bullon P, Roman-Malo L, Marin-Aguilar F, Alvarez-Suarez JM, Giampieri F, Battino M, et al. Lipophilic antioxidants prevent lipopolysaccharide-induced mitochondrial dysfunction through mitochondrial bio-genesis improvement. Pharmacol Res. 2015; 91:1–8.https://doi.org/10.1016/j.phrs.2014.10.007PMID:
25447593
13. Xia L, Nordman T, Olsson JM, Damdimopoulos A, Bjorkhem-Bergman L, Nalvarte I, et al. The mamma-lian cytosolic selenoenzyme thioredoxin reductase reduces ubiquinone. A novel mechanism for defense against oxidative stress. J Biol Chem. 2003; 278(4):2141–6.https://doi.org/10.1074/jbc.M210456200
PMID:12435734
14. Nordman T, Xia L, Bjorkhem-Bergman L, Damdimopoulos A, Nalvarte I, Arner ES, et al. Regeneration of the antioxidant ubiquinol by lipoamide dehydrogenase, thioredoxin reductase and glutathione reduc-tase. Biofactors. 2003; 18(1–4):45–50. PMID:14695919
15. Moosmann B, Behl C. Selenoproteins, cholesterol-lowering drugs, and the consequences: revisiting of the mevalonate pathway. Trends Cardiovasc Med. 2004; 14(7):273–81. Epub 2004/11/16.https://doi. org/10.1016/j.tcm.2004.08.003PMID:15542379
16. Kalen A, Appelkvist EL, Dallner G. Age-related changes in the lipid compositions of rat and human tis-sues. Lipids. 1989; 24(7):579–84. Epub 1989/07/01. PMID:2779364
17. Alehagen U, Johansson P, Bjornstedt M, Rosen A, Dahlstrom U. Cardiovascular mortality and N-terminal-proBNP reduced after combined selenium and coenzyme Q10 supplementation: a 5-year pro-spective randomized double-blind placebo-controlled trial among elderly Swedish citizens. Int J Cardiol. 2013; 167(5):1860–6.https://doi.org/10.1016/j.ijcard.2012.04.156PMID:22626835
18. Alehagen U, Lindahl TL, Aaseth J, Svensson E, Johansson P. Levels of sP-selectin and hs-CRP Decrease with Dietary Intervention with Selenium and Coenzyme Q10 Combined: A Secondary Analy-sis of a Randomized Clinical Trial. PLoS One. 2015; 10(9):e0137680.https://doi.org/10.1371/journal. pone.0137680PMID:26375288
19. Alehagen U, Aaseth J, Johansson P. Less increase of copeptin and MR-proADM due to intervention with selenium and coenzyme Q10 combined: Results from a 4-year prospective randomized double-blind placebo-controlled trial among elderly Swedish citizens. Biofactors. 2015; 41(6):443–52.https:// doi.org/10.1002/biof.1245PMID:26662217
20. Alehagen U, Alexander J, Aaseth J. Supplementation with Selenium and Coenzyme Q10 Reduces Car-diovascular Mortality in Elderly with Low Selenium Status. A Secondary Analysis of a Randomised Clini-cal Trial. PLoS One. 2016; 11(7):e0157541.https://doi.org/10.1371/journal.pone.0157541PMID:
27367855
21. Lee RC, Feinbaum RL, Ambros V. The C. elegans heterochronic gene lin-4 encodes small RNAs with antisense complementarity to lin-14. Cell. 1993; 75(5):843–54. PMID:8252621
22. Wightman B, Ha I, Ruvkun G. Posttranscriptional regulation of the heterochronic gene lin-14 by lin-4 mediates temporal pattern formation in C. elegans. Cell. 1993; 75(5):855–62. PMID:8252622 23. Kozomara A, Griffiths-Jones S. miRBase: annotating high confidence microRNAs using deep
sequenc-ing data. Nucleic Acids Res. 2014; 42(Database issue):D68–73.https://doi.org/10.1093/nar/gkt1181
PMID:24275495
24. Xie C, Yuan J, Li H, Li M, Zhao G, Bu D, et al. NONCODEv4: exploring the world of long non-coding RNA genes. Nucleic Acids Res. 2014; 42(Database issue):D98–103.https://doi.org/10.1093/nar/ gkt1222PMID:24285305
25. Alehagen U, Aaseth J, Johansson P. Reduced Cardiovascular Mortality 10 Years after Supplementa-tion with Selenium and Coenzyme Q10 for Four Years: Follow-Up Results of a Prospective Randomized
Double-Blind Placebo-Controlled Trial in Elderly Citizens. PLoS One. 2015; 10(12):e0141641.https:// doi.org/10.1371/journal.pone.0141641PMID:26624886
26. Wanhainen A, Mani K, Vorkapic E, De Basso R, Bjorck M, Lanne T, et al. Screening of circulating micro-RNA biomarkers for prevalence of abdominal aortic aneurysm and aneurysm growth. Atherosclerosis. 2016.
27. Kriegel AJ, Liu Y, Fang Y, Ding X, Liang M. The miR-29 family: genomics, cell biology, and relevance to renal and cardiovascular injury. Physiol Genomics. 2012; 44(4):237–44.https://doi.org/10.1152/ physiolgenomics.00141.2011PMID:22214600
28. van Rooij E, Sutherland LB, Thatcher JE, DiMaio JM, Naseem RH, Marshall WS, et al. Dysregulation of microRNAs after myocardial infarction reveals a role of miR-29 in cardiac fibrosis. Proc Natl Acad Sci U S A. 2008; 105(35):13027–32.https://doi.org/10.1073/pnas.0805038105PMID:18723672
29. Ovchinnikova ES, Schmitter D, Vegter EL, Ter Maaten JM, Valente MA, Liu LC, et al. Signature of circu-lating microRNAs in patients with acute heart failure. Eur J Heart Fail. 2015.
30. Marfella R, Di Filippo C, Potenza N, Sardu C, Rizzo MR, Siniscalchi M, et al. Circulating microRNA changes in heart failure patients treated with cardiac resynchronization therapy: responders vs. non-responders. Eur J Heart Fail. 2013; 15(11):1277–88.https://doi.org/10.1093/eurjhf/hft088PMID:
23736534
31. Jickling GC, Ander BP, Zhan X, Noblett D, Stamova B, Liu D. microRNA expression in peripheral blood cells following acute ischemic stroke and their predicted gene targets. PLoS One. 2014; 9(6):e99283.
https://doi.org/10.1371/journal.pone.0099283PMID:24911610
32. da Costa Martins PA, Salic K, Gladka MM, Armand AS, Leptidis S, el Azzouzi H, et al. MicroRNA-199b targets the nuclear kinase Dyrk1a in an auto-amplification loop promoting calcineurin/NFAT signalling. Nat Cell Biol. 2010; 12(12):1220–7.https://doi.org/10.1038/ncb2126PMID:21102440
33. Wei C, Henderson H, Spradley C, Li L, Kim IK, Kumar S, et al. Circulating miRNAs as potential marker for pulmonary hypertension. PLoS One. 2013; 8(5):e64396.https://doi.org/10.1371/journal.pone. 0064396PMID:23717609
34. Kong XM, Zhang GH, Huo YK, Zhao XH, Cao DW, Guo SF, et al. MicroRNA-140-3p inhibits prolifera-tion, migration and invasion of lung cancer cells by targeting ATP6AP2. Int J Clin Exp Pathol. 2015; 8(10):12845–52. PMID:26722475
35. Yang J, Zhang Z, Chen C, Liu Y, Si Q, Chuang TH, et al. MicroRNA-19a-3p inhibits breast cancer pro-gression and metastasis by inducing macrophage polarization through downregulated expression of Fra-1 proto-oncogene. Oncogene. 2014; 33(23):3014–23.https://doi.org/10.1038/onc.2013.258PMID:
23831570
36. Xing Y, Liu Z, Yang G, Gao D, Niu X. MicroRNA expression profiles in rats with selenium deficiency and the possible role of the Wnt/beta-catenin signaling pathway in cardiac dysfunction. Int J Mol Med. 2015; 35(1):143–52.https://doi.org/10.3892/ijmm.2014.1976PMID:25339460