Transcriptome and Proteome Analysis using
Signature Tags
Charlotta Agaton
Royal Institute of Technology Department of Biotechnology
© Charlotta Agaton
Department of Biotechnology Royal Institute of Technology AlbaNova University Center SE-106 91 Stockholm Sweden Printed at Universitetsservice US AB Box 700 14 SE-100 44 Stockholm Sweden ISBN 91-7283-642-3
Charlotta Agaton 2003. Transcriptome and Proteome Analysis using Signature Tags. Department of Biotechnology, AlbaNova University Center, Royal Institute of Technology, Stockholm, Sweden. ISBN 91-7283-642-3
Abstract
With the full sequence of the human genome now available, an exciting era in biomedical research has started. The sequence provides information about all our genes and greatly increases the scope to compare genetic activities in different cells, to analyze genetic variation between individuals and between different species and, most importantly, to investigate systematically the whole genome in a gene-by-gene manner, and thus increase our understanding of gene function.
This thesis describes studies in which developments were made in several areas of functional genomics. Messenger RNA levels were analyzed by the use of an amplification procedure, in which the 3´-ends of the transcripts were selected in order to amplify the mRNA population in an unbiased fashion. By sonicating cDNA originating from expressed mRNA, uniformly sized representatives of the transcripts, “signature tags”, were obtained. The mRNA levels in the original mRNA population correlated well with the levels in the amplified material, as verified by microarray analysis and real-time quantitative PCR. The expressed transcripts can be identified using pyrosequencing, by comparing the obtained sequence information from the signature tags to information contained in various sequence databases. In one of the articles, the use of pyrosequencing is illustrated by efforts to find genes involved in the disease progression of atherosclerosis.
More challenging than the study of mRNA levels is to analyze when, where and how proteins fulfill their wide-ranging roles in all the various cellular processes. Proteins are more complex biomolecules than mRNA, each having unique properties. Current techniques for studying proteins need much improvement, and are often limited to investigations of a specific portion of the proteome. One approach for studying the whole proteome is to systematically generate reagents with specific affinity for the proteins encoded by the genome, one by one. The affinity reagents can be used as flags for their targets, providing a flag-specific detection system, so that the target proteins can be sub-cellularly localized in the majority of human tissues in an array format. One of the articles included in the thesis presents a pilot project for large-scale affinity reagent production. The aim was to provide a sound basis for whole proteome studies, but as a pilot study this investigation was limited to the proteins encoded by human chromosome 21. All putative genes on the chromosome were subjected to antibody generation in a systematic manner. Small, uniform, and easily produced representative portions of the full-length proteins were expressed. These were denoted “Protein Epitope Signature Tags” and were designed to be unique for their full-length counterparts. The antibodies were produced in rabbits and two of the articles in the thesis discuss different approaches for affinity purification of the antibodies to achieve the highest possible specificity towards the targets. The resulting “mono-specific”, but still “multi-epitope”, antibodies can be used for a wide range of additional biochemical studies, such as protein array and protein pull-out analyses.
© Charlotta Agaton
Keywords: functional genomics, 3´-end signature tags, pyrosequencing, amplification, PrEST, chromosome 21, polyclonal antibodies, dual expression, affinity purification.
Jag är äldre nu
men jag är fortfarande ett barn
Allt är ännu ett mysterium
men det är spännande som fan
LIST OF PUBLICATIONS
This thesis is based on the following papers, which are referred to in the text by the corresponding Roman numerals:
I. Agaton, C., Unneberg, P., Sievertzon, M., Holmberg, A., Ehn, M., Larsson, M., Odeberg, J., Uhlén, M. and Lundeberg J. (2002) Gene expression analysis by signature pyrosequencing. Gene 289, 31-39.
II. Sievertzon, M., Agaton, C., Nilsson, P. and Lundeberg, J. (2003) Amplification of mRNA populations by a cDNA tag strategy. Biotechniques In press.
III. Agaton, C., Galli, J., Höidén Guthenberg, I., Janzon, L., Hansson, M., Asplund, A., Brundell, E., Lindberg, S., Ruthberg, I.,Wester K., Wurtz, D., Höög, C., Lundeberg, J., Ståhl, S., Pontén, F. and Uhlén, M. (2003) Affinity proteomics for systematic protein profiling of chromosome 21 gene products in human tissues. Molecular and Cellular Proteomics 2, 405-414
IV. Falk, R., Agaton, C., Kiesler, E., Jin, S., Wieslander, L., Visa, N., Hober, S. and Ståhl, S. (2003) An improved dual-expression concept, generating high-quality antibodies for proteomics research. Biotechnology & Applied Biochemistry 38, 231-239
V. Agaton, C.* / Falk, R.*, Höidén Guthenberg, I., Göstring, L., Uhlén, M. and Hober, S. (2003) Selective enrichment of monospecific polyclonal antibodies for antibody-based proteomics efforts. Submitted.
*
POPULÄRVETENSKAPLIG SAMMANFATTNING……….... 1 INTRODUCTION………... 4 1 Genomics………. 5 1.1 Genome projects………. 5 1.2 Genotyping………. 6 1.3 Gene interference……… 8 2 Transcriptomics……….. 13 2.1 Transcript profiling………. 13 2.2 Microarrays………. 14
2.3 Signature counting methods.……….. 17
3 Proteomics……… 19
3.1 Identification and quantification………... 20
3.2 Localization………. 22
3.3 Protein-protein interactions………... 24
3.4 Protein arrays……….. 26
3.5 Structural genomics……… ……… 28
3.6 PTM mapping and analysis of biochemical activity……….. 29
PRESENT INVESTIGATION ……… 32
4 Global expression analysis using pyrosequencing (I) ………. 32
4.1 Pyrosequencing technology……… 32
4.2 The use of pyrosequencing for transcriptome analysis……... 33
5 Amplification of mRNA populations (II) ………. 34
6 Proteome localization analysis using monospecific antibodies (III) ……… 36
6.1 Polyclonal versus monoclonal antibodies……… 37
6.2 Tissue arrays……… 37
6.3 Affinity tags………. 38
6.4 A pilot proteome localization study: analysis of a human chromosome ………... 39
7 Affinity purification of polyclonal antibodies (IV, V)………. 40
7.1 The dual expression concept ……….. 41
7.2 Two-step affinity purification procedure……… 43
7.3 Protein arrays as tools for quality control………... 46
CONCLUDING REMARKS... 48
ACKNOWLEDGEMENTS... 49
REFERENCES... 51 PUBLICATIONS (I –V)
POPULÄRVETENSKAPLIG SAMMANFATTNING
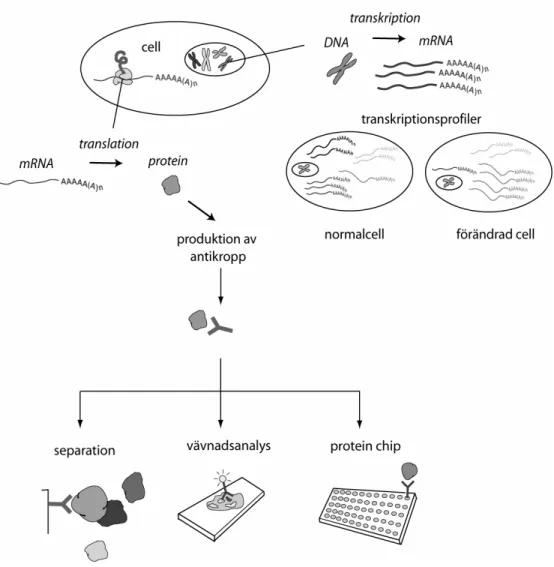
Molekylärbiologin utgår från något som brukar kallas ”det centrala dogmat” som utgör informationsflödet i cellen. Det innebär att det som definieras som gener i arvsmassan översätts till mRNA (transkriberas), som i sin tur översätts (translateras) till proteiner (se figur 1). Arvsmassan består av DNA och finns i kärnan hos alla eukaryota celler. Generna i DNAt ”kodar” således för proteinerna som är cellens byggstenar. DNA är uppbyggt av två komplementära strängar med förmågan att kopiera sig själva, vilket sker inför varje ny celldelning. DNA strängarna består av s.k. baser och en triplett av dessa motsvarar en aminosyra i proteiner. Det centrala dogmat definierades redan 1957 av Francis Crick och den molekylärbiologiska utvecklingen satte då ordentligt fart. Helt nyligen, 2003, hade forskningen kommit så långt att hela den mänskliga arvsmassan, det humana genomet, hade kartlagts. Trots att DNA sekvensen för människan således är känd har dock majoriteten av gener fortfarande inte en beskriven funktion. Detta har resulterat i en ny vetenskapsgren (funktionsgenomik) som försöker finna funktionerna hos generna och de motsvarande proteinerna. Först när proteinernas funktion är någorlunda beskrivna och man vet vilka proteiner som orsakar vissa sjukdomar kan man utveckla läkemedel riktade mot dessa. All sekvensinformation, dels från människa, men också från flera andra kartlagda arvsmassor, har resulterat i en ny storskalig inriktning på forskningen när det handlar om förståelsen av geners funktion. Storskaliga analyser av ”transkriptomet” (alla mRNA molekyler som kodas för i ett genom) och ”proteomet” (det translaterade transkriptomet) har kunnat genomföras. Transkriptom och proteom-analyser är en typ av ”upptäcktsbaserad” forskning till skillnad från den mer inriktade forskningen som har dominerat tidigare där man i förväg har förvärvade kunskaper om den specifika genen eller proteinet man studerar. I denna nya inriktning vet man således inte i förväg något om generna/proteinerna man letar efter, utan målet är att finna de gener/proteiner som är involverade i t.ex. en viss sjukdomsprocess för att kunna hitta lämpliga markörer för prognos eller kandidater för läkemedelsutveckling. I inledningen till den här avhandlingen beskrivs de tekniker som idag används för storskaliga analyser för förståelsen av geners funktion, både på DNA, mRNA och protein nivå.
De fem artiklar avhandlingen baseras på beskriver utvecklingen av olika metoder inom funktionsgenomiken. I metoderna utnyttjas delfragment av mRNA och proteiner som är framtagna för att vara så unika som möjligt för de motsvarande full-längdsmolekylerna och således utgöra ”signaturer” för dessa. En sådan signatur kan liknas vid min handledares signatur, som fast den är kort och oläslig är unik för honom. Genom att t.ex. studera alla dokument där denna signatur
förekommer kan man omedelbart få insyn i de processer han är engagerad i, och kanske kan man se möjligheterna att påskynda vissa aktiviteter och förhindra andra.
De två första artiklarna beskriver sätt att få fram s.k. transkriptionsprofiler, d.v.s. mönster över de gener som transkriberas i vissa celler under definierade förhållanden. Genom att identifiera och mäta mängden mRNA molekyler i ett visst cellprov, kan man få en bild av vilka gener som är aktiva just då. Den första artikeln beskriver jämförelsen av transkriptionsprofilen hos ”friska” celler med profilen hos celler som är inblandade i åderförkalkningsprocessen. Framförallt var målet med arbetet att visa en teknik som var passande för en sådan analys, men även för att identifiera de gener som blir upp- respektive nedreglerade i de sjuka cellerna. Ofta har man mycket begränsade mRNA mängder att arbeta med. Till exempel vid s.k. mikrodissektion när man skär ut en viss typ av celler, t.ex. tumörceller från ett vävnadssnitt på ett objektsglas. I den andra artikeln beskrivs en studie av hur man, genom att mångfördubbla mRNAt, kan använda mycket mindre startmaterial för att få fram en transkriptionsprofil som helt överensstämmer med ursprungspopulationen av mRNA, i detta fall med hjälp av signaturer för transkripten.
De tre sista artiklarna handlar om ett sätt att försöka generera specifika antikroppar, som flaggor eller markörer, för alla proteiner i människan. Det primära målet är att kunna lokalisera proteinerna, d.v.s att få en bild av i vilka celler och var i cellerna de förekommer. Kan man t.ex. lokalisera ett totalt okänt protein (figur 4 i artikel III) till en specifik celltyp i tjocktarmen, och t.o.m. se hur proteinet släpps ut i tarmhåligheten från dessa slemproducerande celler vet man plötsligt mycket mer om proteinet i fråga. Genom att använda sig av s.k. vävnadsarrayer kan man studera lokaliseringen av ett specifikt protein i de flesta mänskliga vävnaderna samtidigt. Artikel III beskriver ett pilotprojekt, i vilket specifika antikroppar genererades. Dessa riktades mot alla proteiner som är kodade för på kromosom 21. Projektet genomfördes för att utveckla tekniken så att så småningom en ”atlas” av alla mänskliga proteiner kan erhållas. De specifika antikropparna som genererades var i detta fall riktade mot noga utvalda fragment av proteinerna, fragment som vi kallar ”protein epitop signatur-taggar”. De sista två arbetena beskriver hur man väljer ut endast de antikroppar som verkligen är specifika för sitt respektive protein och tekniker för att studera specificiteten. Förutom för lokaliseringsstudier kan de specifika antikropparna sedan användas till en mängd andra typer av studier. Ett exempel är att försöka fästa antikropparna på en matris och på det sättet kunna ”fiska ut” deras respektive proteiner ur komplexa cellprov och få en möjlighet att studera proteinerna lite noggrannare. Proteiner binder t.ex. nästan alltid till andra proteiner och det ger en möjlighet att
identifiera även dessa, vilket i sin tur kan ge idéer om proteinets funktion och om de olika processerna som sker i cellen.
Figur 1. I cellens kärna finns arvsmassans DNA packat i kromosomer. Via transkription översätts generna i DNA till mRNA och från en celltyps mRNA population kan en s.k. transkriptionsprofil erhållas. mRNA molekylerna transporteras till cellens cytoplasma där de används som mall för proteinproduktionen via en process som kallas translation. Genom immunisering av djur med proteiner genereras protein-specifika antikroppar som så småningom kan användas i flera olika applikationer.
INTRODUCTION
The sequencing of the human genome represents a milestone in modern molecular biology. The enormous amount of information that has been gathered by DNA sequencing will now need to be translated into biologically relevant information. Using the sequence, we can identify genes and try to understand how the gene products, the proteins, individually and collectively perform their essential roles in all the various types of cellular processes. Ultimately, we want to understand the underlying events involved in disease and disease progression. We are entering what is often described as the “post-genomic era”. This era represents a shift from the study of individual genes and proteins to the parallel study of thousands of genes and proteins expressed under certain conditions and time points. As Stanley Fields formulated in 1997: “Genome sequences allow two previously impossible approaches to biology: obtaining a little bit of information about every protein and surveying all proteins to figure out which ones to learn a lot about.” Many of the human genes have still not been functionally characterized and all the different efforts to understand gene function have evolved and merged into a single field, denoted functional genomics or proteomics (figure 2).
Figure 2. Different areas contributing to functional analysis.
This thesis describes post-genome technologies aimed for identifying and understanding the function of genes and proteins. In the investigations this thesis was based upon, unique representatives of given biomolecules, “signatures”, were used instead of their full-length counterparts. This approach has several advantages, for example, it is more convenient to generate and handle a smaller, more robust part of a protein than the whole full-length protein. The rationale of using signatures will be discussed in detail in the thesis after a brief general introduction to the field.
1 Genomics
The basic laws of hereditary genetics were first described in 1866 by Gregor Mendel (based on his studies of garden peas), and in the early part of the twentieth century it became clear that heredity and development were dependent on information contained in chromosomes. Deoxyribonucleic acid (DNA) was first described as the hereditary material by Avery and co-workers in 1944, and the double helix structure of DNA was published in 1953 by James Watson and Francis Crick (Watson and Crick 1953). Thus, in April this year, the fiftieth anniversary of the discovery of the double helix was celebrated. Technologies for studying DNA have developed so rapidly since then that the completion of a high-quality, comprehensive sequence of the human DNA sequence could be published in the same month 50 years later.
Soon after the discovery of DNA, the central dogma in molecular biology was postulated. This describes the intrinsic capacity of DNA to copy itself, and how the hereditary units contained within DNA, called genes, are translated into proteins via messenger RNA.
1.1 Genome projects
During the last 20 years, an immense number of successful techniques used in the field of molecular biology have been developed. Two very important milestones in the history of DNA analysis were the development of DNA sequencing techniques (Maxam and Gilbert 1977; Sanger et al. 1977) and the Polymerase Chain Reaction (PCR), enabling amplification of DNA (Saiki et al. 1985; Mullis and Faloona 1987). Despite the increasing demand for high-throughput sequencing, the basic techniques for DNA sequencing, developed by Sanger and co-workers almost 30 years ago, are still in use. However, the throughput has increased enormously in the intervening time through the combined effects of numerous incremental advances and automation of the procedure by robotic sample preparation. In 1990, the Human Genome Project (HGP) was launched, with the ultimate aim of sequencing the whole human DNA sequence within 15 years. The genomes of a number of additional model organisms were sequenced in parallel, partly to establish the technologies for high-throughput sequencing and sequence analysis, and partly to enable elucidation of gene functions in humans by comparison with findings in the other species. The complete sequence of the first bacterial genome (Haemophilus influenzae) was reported in 1995 (Fleischmann et al. 1995) and in 1996, the first eukaryotic genome was fully sequenced: the genome of budding yeast (Saccharomyces cerevisiae) (Goffeau et al. 1996). Today, more than 100 bacterial genomes and 1000 viral genomes have been sequenced (http://www.ncbi.nih.gov) and the 20 completed eukaryotic genomes are listed in
Table I. In 2001, a first, draft version of the human genome was released (Lander et al. 2001; Venter et al. 2001), heralding a new era in molecular biology, and allowing a global perspective of the human genome to be developed. Enormous amounts of information lie within the sequence and the opportunity to compare the human sequence with those of other species enables the definition of previously unknown genes and the functional characterization of many genes.
From the sequence, it was estimated that the human genome contains approximately 30 000 protein-coding genes; a surprisingly low number compared to earlier estimates of 100 000. The great complexity of the proteome (the proteins encoded on a genome) however, indicates that the genes, their corresponding mRNAs and proteins can be modified in multiple ways. Splicing events, for example, can lead to several mRNA molecules being encoded by the same gene. Interestingly, the protein-encoding proportion of genomes from different species varies remarkably. In yeast, 70% of the bases are protein-coding, whereas in the human genome, as little as ~2% of all the bases encode proteins (Lander et al. 2001). The function of the remaining human sequence, of which repetitive sequences account for roughly 50%, is still poorly understood.
Table I
Completed vertebrate genomes
Completed plant genomes Completed genomes of other eukaryotes
Homo sapiens Avena sativa (oat) Anopheles gambiae
Mus musculus Glycine max (soybean) Arabidopsis thaliana
Rattus norvegicus Hordeum vulgare (barley) Caenorhabditis elegans Zebra fish Lycopersicon esculentum (tomato) Drosophila melanogaster
Oryza sativa (rice) Encephalitozoon cuniculi
Triticum aestivum (bread wheat) Guillardia theta nucleomorph
Zea mays (corn) Plasmodium falciparum
Saccharomyces cerevisiae Schizosaccharomyces pombe
1.2 Genotyping
The success of the Human Genome Project (HGP) has initiated a variety of different genetic analyses that are being performed on a global basis. One approach whereby our understanding of the evolutionary history of genes and the association of genes with diseases can be increased involves studying sequence variation between individuals: a type of genetic analysis called genotyping. HGP
has enabled the detection of high densities of sequence variations, present in varying frequencies across the whole genome. The sequence variations are denoted Single Nucleotide Polymorphisms (SNPs) and are the main agents responsible for phenotypic differences observed between individuals, in other words, responsible for individual traits. As indicated by their name, SNPs are single-base changes, occurring at specific locations in a genome, at a frequency of one SNP per 1300 bases (Lander et al. 2001).This number is equivalent to a total of ~3 million SNPs in the human genome (implying that 99.9% of the bases are the same for everyone). According to the definition of an SNP, the allele frequency of the most common variant should be <99%. Otherwise, it is referred to as a mutation.
Many causative (functional) SNPs, correlating to certain characteristics of an individual (the phenotype), have been identified. Detection of functional SNPs may subsequently lead to the identification of genes that are associated with specific diseases. For the hereditary traits Mendel studied, the observed variation was due to simple differences at single genes. During the last twenty years, genes responsible for a number of inherited human disorders have been identified. However, these disorders are largely restricted to mendelian (monogenic) cases, and not to the more frequently occurring, complex, multifactorial diseases, such as diabetes, cardiovascular and inflammatory diseases, psychiatric disorders and most cancers. It is believed that SNP analyses have the capacity to elucidate the mechanisms underlying the complexity of these diseases. By comparing the SNPs of affected individuals with those of healthy individuals, it should be feasible to trace the SNPs/genes responsible for the respective disorders. A complete human SNP map would clearly greatly facilitate these types of analyses. Therefore, in 1999, the SNP Consortium (TSC) was established with the primary aim of creating a high-density SNP map of the human genome. Currently, their public database contains ~1.8 million SNPs (TSC; http://snp.cshl.org).
In addition, different SNPs may also contribute to the genetic component of variations between individuals that cannot be seen, such as susceptibility to certain diseases and responsiveness to drug therapies. Thus, exploitation of SNP information may boost the chance of providing optimal medical treatments to specific patients via “pharmacogenomics”, i.e. genetic analyses of drug responses designed to develop “tailored” therapies on an individual basis (McCarthy and Hilfiker 2000; Shi 2001). Moreover, SNPs constitute important genetic markers for association studies in forensic analyses, diverse agricultural applications and the study of complex diseases.
Numerous high-throughput technologies have been developed for the detection of SNPs, many of which are commercially available from biotechnology companies (Ahmadian and Lundeberg 2002; Wypgant 2002). Most of the assays fall into one of two major classes: those that use an abbreviated form of DNA sequencing technology, and those that use hybridization affinity between perfectly and imperfectly complementary strands, usually in a microarray format with fluorescently labeled probes or targets. One application of the former class is pyrosequencing(Ahmadian et al. 2000), utilizing DNA extension from a primer annealed to the complementary strand, near the SNP site. This technique is described in section 4.1 of this thesis. Techniques that use mass spectrometry (see section 3.1) for detecting SNPs in primer extension assays are also evolving rapidly, giving results promising high levels of both reliability and throughput (Tost and Gut 2002). Oligonucleotide Ligation Assays (OLAs) provide a competing approach to primer extension assays, relying on the ability of ligase to discriminate between matched and mismatched probe ends (Landegren et al. 1988; Nilsson et al. 2002). Oliphant and co-workers have successfully applied the OLA principle to detect SNPs on a fiber optic BeadArray platform, and thus scaled up the SNP scoring procedure significantly (Oliphant et al. 2002). OLA has also recently been applied in combination with rolling circle amplification (Hardenbol et al. 2003). Additional examples of genotyping methods include minisequencing (Syvanen et al. 1993), TaqMan genotyping (Livak et al. 1995), the FRET-based Invader assay (Hall et al. 2000) and AMASE (Ahmadian et al. 2001).
Although the abovementioned methodologies are still subject to limitations, whole genome genotyping can soon become a reality, probably through use of several of the techniques in combination. Some efforts to identify SNPs in whole genome approaches have already been performed, for example in Arabidopsis thaliana (Borevitz et al. 2003) and humans (Kennedy et al. 2003).
1.3 Gene interference
Another possibility provided by the genome sequencing efforts is the ability to delete genes in a systematic manner and subsequently determine the consequences of such deletions. The basic principle of gene disruption has been applied for decades, in so-called “knock-out experiments” in mouse. Although the function of many genes can be characterized using model organisms such as yeast, fly and worm, mouse has been developed as a powerful vertebrate model organism for studying human disease (Bedell et al. 1997; Bedell et al. 1997). The classical approach for studying genes in human disease is targeted gene disruption. In this approach, specific genes are inactivated or “knocked out” by replacing the endogenous genes in mouse embryonic stem (ES) cells with altered versions, and the cells are then introduced into a mouse embryo. The consequences of the
loss-of-function of a specific gene can then be analyzed by phenotypic analysis of the affected individuals and their offspring. Genome-wide studies involving such gene replacements in mouse have not yet been feasible in a systematic gene-by-gene manner. However, random chemical mutagenesis, primarily using the mutagen N-ethyl-N-nitrosourea (ENU), has become an important tool for studying loss-of-function in global-scale approaches (Inamdar 2001). ENU generates point mutations at rates of up to 1 in 1200 bp. Recently, two groups have performed large-scale ENU-mutagenesis in mouse, resulting in a total of 40 000 mutant mice (Hrabe de Angelis et al. 2000; Nolan et al. 2000). These were screened for a broad spectrum of phenotypic abnormalities, such as visible defects, unnatural behavioral patterns and abnormal responses in various clinical tests. In total, about 700 new dominant, semi-dominant and recessive mutations were identified.
All the data obtained from the two projects and the mutant lines generated are freely available to the scientific community (http://www.mgu.har.mrc.ac.uk/mutabase and
http://www.gsf.de/ieg/groups/enu-mouse.html).
Yeast (Saccharomyces cerevisiae) is an excellent eukaryotic organism for systematic genome-wide investigations of genes. Experiments that have been performed on yeast are frequently cited throughout the Introduction of this thesis. Yeast is a single cell organism that has been intensively investigated. It is convenient to study, and in addition to carrying out all the basic functions of eukaryotic cells, approximately 30% of the genes implicated in human disease have yeast homologs (Bassett et al. 1997).
All protein-coding Open Reading Frames (ORFs) within the yeast genome have been elegantly subjected to gene deletion analysis and gene-deletion mutants are now available for 96% of the ORFs (Giaever et al. 2002), largely through the efforts of an international consortium of laboratories initiated in 1999 (Winzeler et al. 1999). In this project, each gene was precisely deleted by mitotic recombination and replaced with a deletion cassette. The deletion mutants can be uniquely identified, since the cassette in each mutant is flanked by two distinct 20-nucleotide sequences, serving as “molecular bar codes”. The abundance of each strain can be determined under different conditions via hybridization to an oligonucleotide array of the complementary bar codes (hybridization to oligonucleotide arrays is further discussed in section 2.2). Using this strategy, genes essential for growth in rich medium and in various environmental conditions, involving changes in carbon source, osmolarity, pH etc., were identified. Genes essential for viability (approximately 17% of the total), and especially those encoding proteins lacking human homologs, are believed to be the best targets for antifungal disease treatments(Winzeler et al. 1999). An interesting and unexpected observation was that increases in the expression (mRNA
abundance) of a gene under given conditions was not necessarily correlated with the requirement of that gene for optimal growth under the corresponding conditions (Giaever et al. 2002). In addition, another large-scale gene disruption analysis of the yeast genome has been performed using transposon tagging (Ross-Macdonald et al. 1999). In this study, a third of all ORFs were tagged and both the localization of gene products and disruption phenotypes were investigated under 20 different variants of growth conditions.
In 1999, Winzeler and co-workers in the abovementioned consortium reported the identification of about 1000 essential genes and the generation of approximately 5000 viable haploid gene-deletion mutants. These 5000 viable gene-deletion mutants became publicly available and have been subjected to several screens for phenotyping analysis, including screens for defects in drug sensitivity (Chang et al. 2002), cell size (Jorgensen et al. 2002) and morphology (Giaever et al. 2002). Although the genome of yeast was published in 1996, more than 30% of the genes in the organism remain to be functionally classified. Screening a specific mutant for a second-site mutation that either suppresses or enhances the original phenotype has been remarkably useful for the functional identification of genes and for probing functional relationships between genes. A systematic large-scale screening of “synthetic lethals” was recently performed with an array of 4700 deletion mutants(Tong et al. 2001). Two genes show a synthetic lethal interaction if a combination of the mutants causes cell death, while neither by itself is lethal. Using multiple Synthetic Genetic Array (SGA) screens, Tong and co-workers were able to generate a genetic interaction network. The roles of surrounding genes in this network, with similarities in their connectivity, can provide valuable indications about the functions of genes with unknown cellular roles.
A recently developed approach for gene disruption is to silence mRNA molecules using RNA interference (RNAi). The RNAi mechanism was first discovered in the nematode C. elegans in 1998 (Fire et al. 1998). It was found to be an ancient anti-viral defense mechanism in lower eukaryotes and now provides the basis for a promising experimental approach for the analysis of gene function (Hannon 2002; Arenz and Schepers 2003). As in classical gene knock-outs, the aim of RNAi analyses is to disrupt the expression of certain genes and examine the various phenotypes that may arise. However, the specific gene-silencing mechanism involved acts at the mRNA level. The approach has a similar mode of action to antisense techniques, utilized in gene-silencing efforts since the early 1990s. Antisense RNA inhibits the translation of complementary, endogenous (sense) mRNA, presumably by preventing ribosome binding (Brantl 2002; Arenz and Schepers 2003). Although antisense technology has proved to be very useful, resulting in potential drugs for treating virus infections for instance, use of the
technique can be problematic, e.g. it may be difficult to introduce the oligonucleotides effectively into the target cells. What Fire and co-workers discovered in 1998 was that the simultaneous injection of both sense and antisense RNA, i.e. double-stranded RNA (dsRNA), into C. elegans resulted in at least a tenfold higher potency in silencing gene expression. After feeding dsRNA, specific and long-lasting effects of gene-silencing, even in the offspring, were observed. The mechanism of RNAi is believed to begin with the processing of double-stranded RNA into small (~22-nucleotide) interfering RNAs (siRNA) by an enzyme called Dicer (Bernstein et al. 2001). The siRNAs are subsequently incorporated into a multi-component nuclease, called RISC (RNA-Induced Silencing Complex). This complex is activated by the unwinding of the siRNAs, which are used in the following step as guides for selecting the homologous endogenous targets to be degraded (Hannon 2002). Hence, by introducing dsRNA, loss-of-function phenotypes can be generated by this machinery. A first genome-wide RNAi screen was successfully performed in C. elegans in 2003 (Kamath et al. 2003). Kamath and co-workers were able to inhibit the function of 86% of the 19 427 predicted genes of C. elegans by this approach. They also identified mutant phenotypes for 1722 genes, and observed embryonic lethality for 929 different strains carrying a silenced gene.
It is believed that the silencing machinery operates at multiple levels, and evidence supporting this belief has been observed in plants, Drosophila, C. elegans and fungi(Hannon 2002). mRNA molecules are believed to be degraded by the act of the RISC complex. In addition, it has been observed at the DNA level that the RNAi machinery targets chromatin remodeling, and that a gene can be silenced when the dsRNA shares sequence with the promoter region. Moreover, translational inhibition by the machinery has also been observed in C. elegans. Attempts to apply this attractive new gene silencing approach to mammals were not at first successful. The introduction of dsRNA into mammalian cells induced an anti-viral defense mechanism (Clemens 1997) which eventually led to programmed cell death (apoptosis). However, this problem was overcome by introducing 21-23 nt siRNAs instead of dsRNA into mammalian cells. This triggered RNAi machinery without initiating the apoptosis response. The strategy used to introduce siRNAs today is through ligation of the cDNA into an expression vector in sense direction followed by the same sequence in antisense direction. After transfection into the target cells, a hairpin-like structure mimicking dsRNA is generated. The procedure for silencing genes in mammals is very promising, giving a knock-out efficiency of 80-90% (Arenz and Schepers 2003).
RNAi obviously has the potential to become a powerful therapeutic tool for curing infectious diseases. For example, in research into the HIV-virus, siRNAs have already been successfully used for silencing mRNAs for the HIV-1 receptor CD4 and the HIV-structural protein gag (Novina et al. 2002). In addition, it can be speculated that since the siRNA silencing is so specific, a siRNA could be used to silence a disease-causing mutant allele, such as an activated oncogene, without affecting the normal allele (Hannon 2002).
2 Transcriptomics
In a eukaryotic cell, mRNA molecules are generated in the nucleus, processed and transported to the cytoplasm before being translated into proteins. An important step in the processing of the mRNA is splicing, which involves the removal of intron sequences and the assembly of exon sequences. The splicing procedure has been shown to give rise to at least two to three different transcript variants per gene (Galas 2001), each with potentially differing functions. Translation of the transcripts into proteins is carried out in the cytoplasm by ribosomes, and is ceased by the degradation of the mRNA. The half-lives of the mRNAs vary considerably and have been shown to be affected by a number of stimuli and cellular signals, such as hormonal action andviral infections (Wang et al. 2002).
Initiation of transcription is strictly regulated and contributes to the unique characteristics of specific cell types. Although more than 10 000 genes in a given cell are active at any given time (Yamamoto et al. 2001), the vast majority of active genes help maintain general cellular processes, and relatively few genes are responsible for the differences, both obvious and subtle, between cell types. By comparing “expression profiles” of cells, the genes responsible for the differences may be identified, for example, by comparing normal versus cancerous cells. Also, gene expression studies can be applied for identifying genes with altered expression in response to certain treatments or stimuli.
This section describes the most common strategies used for studying gene expression at the transcriptional level, with a focus on microarray technology and Serial Analysis of Gene Expression (SAGE).
2.1 Transcript profiling
Using a procedure called reverse transcription, it is possible to transcribe RNA into complementary DNA (cDNA). Double stranded cDNA is much more convenient to handle than single-stranded RNA, since RNA is rapidly degraded. Using a polyT sequence, complementary to the polyA tail in the mRNA transcripts, all mRNA molecules can be captured and enriched from a total RNA sample. The mRNA population can subsequently be reverse transcribed into cDNA, and each cDNA fragment can be cloned into a vector system. Such a clone collection (a cDNA library) represents only the expressed genes, with the same distribution as the original mRNA. The individual cDNA clones can then be sequenced, each representing a certain gene transcript. In 1992, the first high-throughput cDNA clone sequencing project was described, in which clones were randomly selected and partially sequenced (Adams et al. 1992). The sequence fragments were denoted “Expressed Sequence Tags” (ESTs) and it was found that EST sequencing could be used to obtain a statistical overview of gene expression
in a certain cell type or tissue at a certain time point (Adams et al. 1993; Matsubara and Okubo 1993). Sequencing cDNA for the generation of ESTs also became a common strategy for identifying new genes. The sequence tags obtained when sequencing from the 3´-end of the transcripts are believed to be most unique, since the untranslated region in the 3´-end is less strongly evolutionary conserved than the coding sequences, often obtained by sequencing 5´-ends. Today (October 2003), EST databases harbor an extensive number of EST sequences, e.g. 5 426 001 and 3 881 878 human and mouse ESTs, respectively (http://www.ncbi.nih.gov/dbEST).
In global expression profiling, the ultimate aim is to obtain a complete representation of all transcripts expressed during certain events or under certain conditions. Currently, microarray technology, for example, is approaching that goal with arrays representing whole genomes, which will be further discussed below. In contrast to studying all expressed transcripts, techniques have also been developed to identify only genes that are differentially expressed between two samples. These include differential display (Liang and Pardee 1992) and representational difference analysis (Lisitsyn and Wigler 1993; Hubank and Schatz 1994).
2.2 Microarrays
Microarray technology was introduced less than a decade ago, but is today the most widely used technique for measuring gene expression. The method relies on the specific hybridization (interaction between complementary DNA or RNA strands) of labeled mRNA or cDNA populations either to oligonucleotides or to cDNA probes, attached at specific locations on a solid support, such as glass or filters (Lockhart and Winzeler 2000; Shoemaker and Linsley 2002). Since the mRNA or cDNA populations hybridized to an array are labeled, usually fluorescently, when the array is scanned the signal intensities of the various hybridization spots differs, depending on the amount of material bound in them, thus providing quantitative or relative measurements of transcripts that are complementary to the probes. In principle, two types of microarrays were initially developed, oligo-based arrays, described first in 1991 by the biotechnological company Affymetrix (Fodor et al. 1991; Pease et al. 1994) and cDNA arrays (The chipping forecast, Nature Genetics 1999 and 2002). In the oligo-chip technique developed by Affymetrix, oligonucleotides are synthesized by photolithography and multiple (20) different probes (20-25 nucleotides in length) per gene are placed on the array. By averaging the signal from the multiple probes for a single transcript, an estimate of the number of transcripts per cell can be obtained directly for that transcript. Recently, Affymetrix has designed an array set representing more than 47 000 human transcripts obtained from the human genome sequence
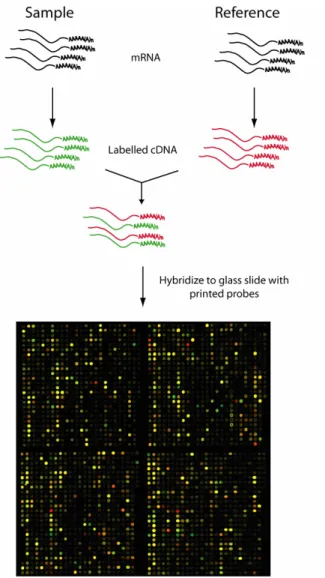
(http//www.affymetrix.com/products). Standardized oligo-chip arrays are commercially available for a variety of organisms, but many academic institutions do not have the financial resources required to exploit oligo-chip technology and thus print their own cDNA arrays. On cDNA arrays, a long, double-stranded cDNA probe is attached in multiple copies for each gene and the information obtained following hybridization gives the relative abundance of a given transcript in two different samples (Lockhart and Winzeler 2000). The samples being compared are usually labeled with Cy3 and Cy5 fluorophores, respectively, co-hybridized to the array and the relative abundance of the transcripts can thus be determined by scanning the array at two different wavelengths (figure 3). When RNA is used for the hybridization, it can be labeled directly, while cDNA is commonly labeled by the introduction of labeled nucleotides in the reverse transcription reaction.
Today, an alternative to the abovementioned approaches is frequently utilized. It is a similar approach, but instead of in situ synthesis of oligonuclotides or spotting of full-length cDNA, 50-70mer oligonucleotides are spotted onto arrays in the same standard manner as cDNA (Shoemaker and Linsley 2002). Recently, an ink-jet printer was used to synthesize large sets of oligonucleotides (Hughes et al. 2001), and the results prompted the cited authors to conclude that oligonucleotides of 60 bases provide excellent specificity and sensitivity.
The major applications of microarray analysis have been in the comparison of diseased and normal tissues, classification of tumors, and studies of gene regulation during development and following inductive treatments of cells in vitro (Holloway et al. 2002). In addition, by comparing the expression profiles of characterized genes, knowledge of their function can be extrapolated to indicate the functions of uncharacterized genes showing similar profiles.
Several types of tumor, including breast tumors, have been studied extensively by microarray analysis (Hedenfalk et al. 2001; Martin et al. 2001). For instance, tumors with mutant forms of BRCA1 and BRCA2 genes have been shown to be transcriptionally distinct from each other and from sporadic breast tumors (Hedenfalk et al. 2001). Furthermore, microarrays can be used in the study of gene expression in tumor cells to identify candidate or prognostic markers for certain types of tumor (Dhanasekaran et al. 2001; Welsh et al. 2001). These markers can subsequently provide information on clinical outcomes and prognostic information suggesting a certain treatment.
Figure 3. Expression profiling by cDNA microarray analysis (microarray image kindly provided by Johan Lindberg).
In a microarray experiment, controls are of utmost importance. Using replicate spots of control genes enables variation within the glass slide and hybridization quality to be evaluated. Positive controls are spiked into the sample in order to confirm that they specifically hybridize to their corresponding spots, while negative controls, such as repetitive DNA and non-crossreactive sequences from a different organism, are used to ensure that no unspecific cross-reactivity is
interfering with the results. In addition, several replicates of all the spots, glass slides and hybridizations are essential to ensure that the data are reliable.
As well as comparing expression levels from control genes on the array and comparing replicate experiments, the results should be verified by another method, such as Northern blotting, Real-Time Quantitative PCR (RTQ-PCR) or in situ hybridization. For this kind of confirmation, a limited number of genes are usually investigated. In Northern blot analysis, RNA samples are denatured, separated by gel electrophoresis, blotted onto a nitrocellulose membrane and, finally, the amount of a certain transcript in the sample can be estimated by a labeled DNA probe specifically hybridizing to the RNA molecule that is being studied (Chaib et al. 2001). A second common strategy to confirm the reliability of microarray hybridization data for specific transcripts involves RTQ-PCR (Heid et al. 1996). By comparing targets with a reference gene and by relating the number of cycles required for a specific gene to be detected over background noise, the relative amounts of transcripts in two samples can be determined. RTQ-PCR is very sensitive and a few copies of a transcript are sufficient for detection. Finally, transcripts can be localized to certain cells using in situ hybridization (Dagerlind et al. 1992) and mRNA species with previously annotated abundance can be used as controls. Using radioactively or fluorescently labeled probes complementary to the transcript, the target mRNA can be detected with sensitivities down to tens of mRNA molecules (Harris et al. 1996).
2.3 Signature counting methods
During the last few years, the scope for obtaining transcript profiles by counting signatures of DNA-fragments, such as ESTs, has been greatly expanded by the development of higher-throughput methods. Some advantages of the signature counting methods are that they provide a digital representation of abundance and the possibility of identifying genes with very low expression levels, depending on the number of clones investigated. In addition, these methods are suitable for the identification of differentially expressed genes that are not present in current databases, although this is a minor problem in human research since the release of the human genome sequence. However, to allow precision and accuracy, a large number of clones have to be analyzed. This constitutes a significant problem with regard to scale and cost, so methods have been sought that allow parallel analysis of many clones. Serial Analysis of Gene Expression (SAGE) was first described in 1995 (Velculescu et al. 1995) and rapidly became the most widely used strategy for more extensive tag sequencing. In SAGE, a type II recognition enzyme, cleaving at a certain distance downstream of its recognition site, is used to generate concatemers of short tags of cDNA, which are cloned and sequenced. In this way, the electrophoresis step is more fully utilized and 20-50 gene tags per lane may be identified instead of one. The method relies on the assumption that
short gene-specific nucleotide sequence tags (10 base pairs) from the 3´-end of the mRNA contain sufficient information to uniquely identify transcripts through SAGE database searches. Using SAGE, global transcript profiles have been obtained for rice and yeast (Velculescu et al. 1997; Matsumura et al. 1999) and, for example, numerous cancer (Zhang et al. 1997; Hibi et al. 1998) and immunological (Chen et al. 1998; Hashimoto et al. 1999) studies of gene expression have also been performed. Several improvements have been described to accelerate and simplify the SAGE procedure (Powell 1998; Datson et al. 1999; Yamamoto et al. 2001).
In MPSS (Massively Parallel Signature Sequencing) (Brenner et al. 2000), the gene expression analysis also involves type II recognition enzyme cleavage, but instead of cloning concatamers, the signature tags are sequenced on microbead arrays using a step-wise cleavage of the immobilized template yielding 16-20 base pair signature tags.
Although these methods (especially SAGE) have generated extensive amounts of data, relatively few groups have exploited them, mainly due to the laborious procedures and technical difficulties involved. In addition, a major limitation is that the genes cannot be identified with high reliability due to the relatively short tag sequences obtained.
3 Proteomics
Traditionally, studies in which differences in gene activity between normal and diseased cells, or the effects of perturbation of a system, have been measured, have been carried out at the level of transcription. Measuring transcribed mRNA has proven to be a very powerful approach for the discovery of molecular markers and elucidation of functional mechanisms, but it is not sufficient for comprehensive characterization of a biological system. There are several important factors in protein regulation that will not be detected by measuring mRNA levels. These include post-translational modifications of the proteins, control of their half-lives, associations with other proteins and accurate predictions of their subcellular localization. In addition, the increased expression of a certain transcript often indicates an increase in the corresponding protein expression, but mRNA and protein levels do not always correlate well. Large-scale studies have been performed in yeast, comparing mRNA and protein abundance (Gygi et al. 1999; Griffin et al. 2002). By investigating the effects of the perturbation of yeast cells, significant differences in abundance ratios of mRNA transcripts and their corresponding proteins have been observed. For example, the expression from one gene (GAL2)could differ, following perturbation, from a 500-fold increase at the mRNA level to a 10-fold increase at the protein level, indicating that strong post-transcriptional mechanism of regulation occurs in this system.
This third section of the thesis will shift focus from the analysis of mRNA levels to the evaluation of protein levels on a global scale, including analysis of protein amounts, interactions, structures, localization and post-translational modifications. The technologies used for studying proteins in large-scale approaches are not as well developed as for mRNA. Studying mRNA levels is easier, since mRNA molecules are composed of only four building blocks, compared to twenty in proteins, and the complementarity of the RNA molecules allows them to be amplified. Clearly, the ability to amplify very low abundance transcripts provides mRNA-based approaches a clear advantage over the global characterization of proteins. Low abundant proteins, such as transcription factors and protein kinases are important regulatory proteins that may not be detected using current proteome analysis methods, although the techniques are approaching those of mRNA-based techniques in terms of sensitivity.
Moreover, studying proteins poses a greater challenge since they are physically more complex molecules than RNA. Different proteins can have totally different chemical properties, with respect to features such as charge, solubility, hydrophobicity and isoelectric point. They can also be modified in a number of ways, for example by phosphorylation, glycosylation, acetylation, ubiquitination,
sulphurylation etc. In addition, they can exist in several splice variants, they may be cleaved into several pieces, undergo changes in structure or location within the cell and/or display major variations in their half-lives. Certain proteins also have numerous functions while others have virtually identical functions, further complicating the evaluation of protein interactions and biological pathways. Given all these complications, it will probably take mankind several decades to create a complete description of any proteome (Fields 2001).
3.1 Identification and quantification
Two-Dimensional gel Electrophoresis (2DE) was introduced in the early 1970s (O'Farrell 1975), but was hampered by experimental problems and the poor initial ability to characterize the separated proteins. Since the development of more sophisticated methods for separating proteins and, most importantly, Mass Spectrometric (MS) techniques for protein identification, 2DE in combination with MS and bioinformatic tools has become “the classical proteomics approach”. In this approach, proteins in complex mixtures are separated by 2DE, detected by staining and quantified according to the staining intensity of their spots. The two dimensions the proteins are separated in are isoelectric focusing (IEF), separating the proteins according to isoelectric point, and SDS-PAGE separating according to molecular weight (figure 4). Protein spots are cut out of the gel, proteolytically digested, and identified by database searches with the sequence information obtained using one of several mass spectrometric techniques (Aebersold and Goodlett 2001). Only proteins that already exist uniquely in a protein sequence database will be identified. In this manner, proteins can be quantified and spot patterns in multiple gels can be matched and compared.
One major limitation of the 2DE strategy is that it is difficult to detect certain categories of proteins, such as low-abundance proteins, very small and large proteins, alkaline proteins and hydrophobic membrane proteins (Santoni et al. 2000). In addition, single spots are frequently composed of several proteins, complicating the identification process. The high sensitivity of the technique also increases the risk of contamination.
Mass spectrometry is a highly accurate method for mass determination, providing scope for both identifying proteins and characterizing their post-translational modifications (Aebersold and Mann 2003). MS techniques that have had a major impact in the proteomics field include Matrix-Assisted Laser Desorption/Ionization Time-Of-Flight MS (MALDI-TOF-MS) and Electrospray Ionization-Quadropole Ion Trap MS (ESI-Q-IT-MS). MALDI and ESI denote the mechanism whereby investigated chemical species are ionized, while TOF, Q and IT describe the mechanisms whereby their mass to charge ratios are determined. A common approach for identifying proteins is a combination of the two techniques,
in which the digested proteins are first investigated by MALDI-TOF-MS for peptide mass mapping and searched against databases to obtain unique hits for identification. Proteins not identified in the first run are subsequently analyzed, peptide by peptide, by the more time-consuming ESI-Q-IT-MS to obtain the sequences of the individual peptides from their product-ion-spectra (Beranova-Giorianni 2003).
Figure 4. 2DE gel image of a whole cell lysate of HCT116 colorectal cancer cells (kindly provided by Dionissios Baltzis).
There have been several recent advances in 2DE and MS. New staining methods have increased the sensitivity and reproducibility with which proteins can be detected on gels, compared to the standard Coomassie Blue and silver staining procedures. In addition, separation methods with higher resolution have been developed that have increased the number of proteins that can be separated. These include the use of narrow range IPG (immobilized pH gradient) strips covering a single pH unit, and pre-fractionation strategies, separating proteins based on, for example, their solubilities or their subcellular localization (Molloy et al. 1998; Jung et al. 2000). The advances in separation resolution have resulted in studies in which, for example, ~2300 proteins in a single eukaryotic cell lysate have been successfully resolved (Wildgruber et al. 2000). An attractive and widely used
alternative to separation on gels is the use of liquid chromatography (Hunt et al. 1992; Butt et al. 2001; Griffin et al. 2002).
New combinations of the MS instruments are also enhancing the accuracy and throughput of mass determinations, for example, ESI in combination with QTOF (Chernushevich et al. 2001) and MALDI with QTOF (Shevchenko et al. 2000). Another type of instrument that has been recently developed is the MALDI tandem-time-of-flight (MALDI-TOF/TOF) mass spectrometer. In these MS/MS approaches, both peptide-mass mapping and peptide sequencing can be performed using the same system and the same sample portions (Medzihradszky et al. 2000). Although no technique has yet been developed that is able to quantify proteins on a genome-wide scale, methods for determining relative levels of proteins in different samples have been developed. In the DIGE (difference gel electrophoresis) approach, for instance, two protein samples are tagged with different fluorescent dyes, run simultaneously on the same gel and the differences between the samples are determined (Unlu et al. 1997; Tong et al. 2001). In a similar method (Isotope-Coded Affinity Tag, or ICAT, labeling) the proteins are labeled, instead, with isotope-coded affinity tag reagents. Here, cysteines in the protein samples are labeled with either a heavy (15N) or a light (14N) ICAT. Using MS, the ratio of heavy:light peaks of individual peptides can be compared to evaluate the relative composition of the two samples. ICAT techniques can be applied when the protein samples have been either separated by 2DE (Smolka et al. 2002) or resolved by liquid chromatography (Han et al. 2001). Even differentially post-translationally modified forms of a protein can be identified and quantified using ICAT approaches (Smolka et al. 2002). Limitations with the system include the relatively high costs of labeling reagents and the fact that only cysteine-containing proteins can be labeled.
3.2 Localization
Different cells in an organism have differing functions, so differ in the subsets of proteins they express at given points in time. In addition, within a given cell, the functions of the proteins are compartmentalized. Information on the localization of a protein in specific cells and/or subcellular compartments, is thus assumed to provide strong indications of protein function (Kumar et al. 2002). In addition, knowledge of where and when a certain protein is expressed allows more targeted studies to be designed. Traditionally, localization techniques using protein-specific antibodies have been applied to connect a protein to a certain tissue or cell type by Western blot analysis in vitro, or more thoroughly, to obtain subcellular information in tissue sections by immunolocalization in situ. However, subcellular information can also be obtained by Western blotting if the protein samples are derived from different cellular compartments. In a Western blot approach, proteins
in samples are separated according to size on an SDS-PAGE gel and then transferred to a membrane. In both Western blot and in situ tissue immunolocalization approaches, the membrane or tissue section is then incubated with a primary antibody (or another specific affinity reagent) followed, often, with a secondary antibody recognizing the primary antibody. The secondary antibody is labeled enzymatically, fluorescently or radioactively, enabling detection of the protein of interest. One limitation with in situ immunolocalization strategies is that the cells must either be fixed, causing protein denaturation, or frozen, making samples more susceptible to protein degradation and disrupting cell morphology. In addition, integral membrane proteins can be difficult to detect and background staining is frequently observed.
Two common strategies currently used for determining subcellular localization of proteins, are to fuse the corresponding gene to a reporter or to tag the protein with a protein epitope, for which a specific antiserum has been generated. Green Fluorescent Protein (GFP) is a widely used reporter, enabling direct detection via fluorescence. An important advantage of this system is that it allows living cells to be studied, but fusing the protein to GFP may hinder the functionality of the protein and also influence the localization pattern. Large-scale subcellular localization studies have been performed using GFP-fusion strategies in humans (Simpson et al. 2000) and yeast (Ding et al. 2000).
A major advantage using epitope-tagging approaches, compared to traditional immunolocalization methods in which each protein is investigated by one antiserum, is that only antisera against the epitope tags have to be generated. A drawback, however, is that the tag is fused to either the N- or the C-terminus of the protein: sequences that may be important for proper function, regulation and targeting of the proteins. Two tagging approaches were recently performed in parallel in a proteome-wide study in yeast with subsequent immunolocalization using tag-specific antibodies (Kumar et al. 2002). One of the approaches involved directed cloning of all ORFs into an expression vector under the regulation of the GAL1 promoter, yielding constitutively expressed tagged proteins. In the other approach, transposon mutagenesis was applied, resulting in random tagging of the ORFs at their native genomic loci, so expression of the tagged proteins was regulated by their endogenous promoters. The results suggested that the effects of tag size, placement and expression were less severe than generally thought. Roughly 60% of the yeast proteome could be successfully epitope-tagged in total, and out of the ~6100 yeast proteins, subcellular information was obtained for 2744. The analysis demonstrated a good correlation between protein function and localization in the cell.
An attractive approach for obtaining protein profiles in defined locations in tissue sections is IMS (Imaging Mass Spectrometry) technology, which utilizes MALDI-TOF-MS for direct protein profiling in tissues (Stoeckli et al. 2001; Chaurand and Caprioli 2002). However, since IMS is a recently developed technique, a number of instrumental issues need to be resolved to ensure that extensive and robust experimental data can be reliably generated. Problems that may arise include, inter alia, difficulties in resolving several kDa proteins with small differences in mass, suppression of signals caused by very strong signals and poor detection of low molecular weight peptides. Nevertheless, the technique clearly has great potential, for example in a recent protein profiling study reported by Caprioli and co-workers, 500 distinct mass signals were detected from a single tissue section (Chaurand and Caprioli 2002).
3.3 Protein-protein interactions
Most proteins seem to act within complex cellular pathways, interacting with a few other proteins or as components of larger complexes (Kumar and Snyder 2002; Auerbach et al. 2002). There are several reasons for the great interest in identifying proteins that interact with each other. First, interaction information often gives valuable clues about the way that different cellular pathways function and interlink. Second, functions may be suggested for uncharacterized proteins by considering the functions (if known) of other proteins with which they interact. Third, identification of protein interactions in a particular pathway involved in a certain disease can help identify targets for drug screening.
The amount of information being generated in the field of interaction proteomics has exploded in recent years, mainly due to the large-scale studies performed in yeast. Proteins identified in an interaction network in yeast can be used to subsequently predict possible functions for their orthologs in other species, such as Homo sapiens.
Commonly used methods for studying protein-protein interactions are the two-hybrid system, mass spectrometry approaches (described below), phage display (Tong et al. 2002) and protein fragment complementation assays (Remy et al. 2002). The earliest and most widely used technique for detecting interaction partners in vivo is the yeast two-hybrid system (Fields and Song 1989). More than 50% of all protein interactions described in the literature have been detected using this system (Xenarios et al. 2001). The technique relies on the use of transcription factors that can be divided into two functionally distinct domains, one mediating DNA binding and the other transcription activation. By fusing one of the proteins in a putative interaction pair to the DNA-binding domain and fusing the other protein to the activation domain, the transcription factor can be reconstituted via an interaction of the two proteins of interest. Detection is carried out by assaying
the activity of reporter genes. The system has proven to be suitable for larger-scale applications, and comprehensive large-scale studies using the two-hybrid system have been performed in yeast (Uetz et al. 2000; Ito et al. 2001). By applying the described approaches to all ~6000 annotated protein-coding ORFs, the cited groups were able to identify 841 and 692 protein-protein interactions, respectively. One major drawback was that there were substantial differences in the results from the two groups. Only 20% of all interactions in the two datasets actually overlapped, suggesting that such screenings are still far from representative. Another limitation of the system is that certain groups of proteins are difficult to analyze, including integral membrane proteins, transcription factors and proteins that are unable to enter the nucleus. Different approaches have been developed to overcome this limitation (Auerbach et al. 2002).
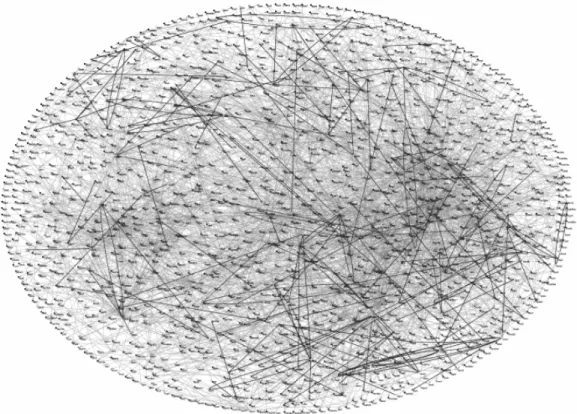
Another way of identifying protein-protein interactions is by tagging individual proteins in order to “pull-out” associated proteins by affinity chromatography. One successful approach for purifying protein complexes in a high-throughput manner by affinity chromatography is by using the Tandem Affinity Purification (TAP) tag (Rigaut et al. 1999; Gavin et al. 2002), described in section 6.3. The components of a protein complex are subsequently identified by mass spectrometry. In 2002, two groups separately published results from studies on all the protein interactions in yeast, identified using the pull-out approach (Gavin et al. 2002; Ho et al. 2002). Trying to identify all the interactions in yeast is a formidable challenge, since as many as 30 000 protein interactions are estimated to occur during the life cycle of yeast (Kumar and Snyder 2002). From their pull-out experiments, Gavin and co-workers were able to define 232 multi-protein complexes, 91% of which contained at least one protein of previously unknown function. New cellular roles were proposed for 344 proteins. In addition, most of the complexes had a component in common with another complex, linking various pathways that were not previously known to be connected and thus forming a higher-order interaction network (figure 5). In the study, they estimated that 30% of the interactions might be false-positives, further illustrating the importance of using several different experimental approaches in order to obtain an accurate understanding of protein networks.
Various analyses have also been reported of interactions between proteins and other molecules, such as carbohydrates using oligosaccharide microarrays (Fukui et al. 2002) and small-molecules, analyzed by chemiproteomics in drug discovery efforts (Figeys 2002). In addition, Green and co-workers developed a system, based on the SELEX (systematic evolution of ligands by exponential enrichment) method for identifying protein-nucleic acid interactions (Ellington and Szostak 1990; Singer et al. 1997), for selecting high-affinity oligonucleotides, aptamers,
that are able to bind a number of different molecules, such as proteins, small, organic molecules and carbohydrates (Green et al. 2001).
Figure 5. Protein-protein interactions identified in yeast by Gavin and colleagues (Gavin et al. 2002).
3.4 Protein arrays
The aim of using protein arrays is to study many component proteins simultaneously, and thus learn how proteins are regulated and interact with each other, as well as with non-proteinaceous molecules. To date, development of protein arrays has mainly relied on the use of antibodies. Reports of protein-detecting arrays have often been based on one of three different immunoassay strategies (figure 6) (MacBeath 2002); 1) sandwich immunoassays, in which antibodies are immobilized on a solid support and bound proteins are detected by a second, labeled antibody; 2) antigen capture assays, in which the proteins are similarly captured by immobilized antibodies, and then detected by mass spectrometry, surface plasmon resonance or by being labeled in advance; 3) direct
immunoassays, in which the complex protein mixture itself is immobilized and specific proteins are visualized using labeled antibodies. Detection approaches, apart from those used in antigen capture assays, as mentioned above, include enzyme-catalyzed chemiluminescence, fluorophore- or radio- labeling, and rolling circle amplification detection by fluorescence (Schweitzer et al. 2002). One possibility would be to use pairs of antibodies in proximity ligation for highly-sensitive protein detection (Fredriksson et al. 2002). Since antibodies are difficult to produce by recombinant means without the use of live animals, alternative binding molecules have been developed. By utilizing “display” technologies, for example phage display, specific binders from large combinatorial libraries of binding ligands can be selected, usually by several selection cycles. Much of the in vitro selection technology has been based either on antibody fragments, especially scFvs and Fabs, or alternative protein scaffolds, such as affibodies (Nord et al. 1997). These affinity binders provide an attractive alternative to antibodies in protein array approaches (Karlström and Nygren 2001).
Figure 6. Antibody array strategies.
Protein-protein interactions have also been studied using array applications without the use of antibodies or similar affinity reagents. For example, by immobilizing thousands of expressed ORFs fused to GST (Zhu et al. 2001), screening for their ability to interact with other, labeled, proteins or substrates could be performed (Ge 2000; Zhu et al. 2001).
ProteinChip systems for protein profiling and protein biomarker discovery are commercially available in the form of Surface Enhanced Laser Desorption/Ionization time-of-flight mass spectrometers (SELDI-TOF MS) (Issaq