MASTER THESIS IN APPLIED MATHEMATICS
MMA891 Degree Project in Mathematics
Pricing European Call Option
in Scott’s Stochastic Volatility Model
by
Hailong Zhao
S.M. Nazmul Hoque
Masterarbete i matematik/tillämpad matematik
Med inriktning i Financial Engineering
DIVISION OF APPLIED MATHEMATICS
MÄLARDALEN UNIVERSITY
DIVISION OF APPLIED MATHEMATICS
_____________________________________________________________________
Master Thesis in Mathematics / Applied Mathematics
Date:
2010-06-10
Project name:
Pricing European Call Option in Scott’s Stochastic Volatility Model
Author:
Hailong Zhao and S.M. Nazmul Hoque
Supervisor:
Anatoliy Malyarenko
Examiner:
Anatoliy Malyarenko
Comprising:
30 ECTS credits
_____________________________________________________________________
DIVISION OF APPLIED MATHEMATICS
MÄLARDALEN UNIVERSITY
Abstract
In this paper, we derive pricing equations for the European call option under
Scott’s stochastic volatility model and achieve a price for the European call
option by creating a JAVA applet. Through certain times of simulating we can
observe the tendency of the options price, as a result, which it can provide the
necessary data for implementing the optimal strategies of investment.
Acknowledgement
During the period of writing our master thesis we have learned many useful
skills and knowledge in different aspects, such as programming and research
abilities. Specially thanks for the help and encouragement from our supervisor
Anatoliy Malyarenko, so we can finish our master thesis perfectly. Overall, we
are grateful to all our professors, teachers and friends in Mälardalens University
for giving us knowledge and wonderful studying time.
Västerås May 27
th, 2010
Content
Introduction ... 6
1. Scott’s Stochastic volatility model ... 8
2. Deriving Solution Procedure ... 9
3. User’s Guide of JAVA Applet ... 16
4. Numerical Results and Analysis ... 20
Conclusion ... 32
Reference ... 33
Introduction
The goal of this paper is to calculate the price of European call option under the
Scott’s stochastic volatility model, as well as its implementation in a JAVA
applet. Some basic concepts concerned are introduced below:
Definition 1: An option
is a contract that gives the holder the right, but
not the duty, to make a specified transaction, to buy (for a call option) or
sell (for a put option) a specific amount of a given stock, commodity,
currency, index, or debt, at a specified price (the strike price) during a
specified period of time.
According to the different exercised date, options can be ranged to European
option and American option and so on. European options can only be exercised
at the expiry date of the option; however, American options can be exercised at
any time between the purchase date and the expiration date. According to the
right of owner options can be ranged to call option and put option. In this paper
we concern European call option.
Definition 2: Stochastic volatility model is used in the field of
Mathematical finance to evaluate derivative securities, such as options.
The name derives from the models' treatment of the underlying security's
volatility as a random process and governed by state variables, such as the
price level of the underlying security. The tendency of volatility to revert
to some long-run mean value, and the variance of the volatility process
itself among others.
As we known, the famous and major model to deriving price of the option is the
Black-Scholes model. However, the application of this model is clumsy in real
options trading because it is under the assumptions of no dividend payment,
constant volatility, and a constant interest rate. By this means, stochastic
volatility model is one approach which can resolve a shortcoming of the
Black-Scholes model. In particular, this model assumes that the underlying volatility is
constant over the life of the derivative, and unaffected by the changes in the
price level of the underlying security.
In the former parts of this paper, we will focus on introducing and deriving the
Scott’s stochastic volatility equation, furthermore, calculate the results of this
model to pricing the European call options. Then we adopt a JAVA applet to
simulating and pricing the numerical result of options.
The structure of this paper is organized as following: the first section provides a
brief description of Scott’s stochastic volatility model; in the second section
deriving method will be presented; then in the third section solutions will be
given by calculating; section 4 is the JAVA applet user guide and the last not the
least section 5 is about numerical results and analysis part.
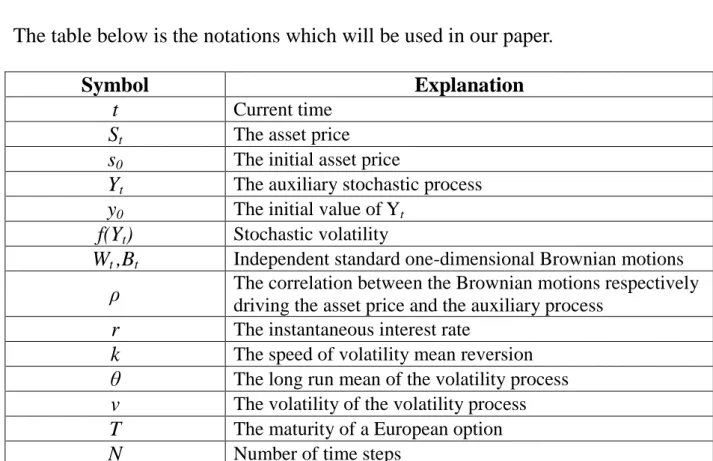
The table below is the notations which will be used in our paper.
Symbol
Explanation
t
Current time
S
tThe asset price
s
0The initial asset price
Y
tThe auxiliary stochastic process
y
0The initial value of Y
tf(Y
t)
Stochastic volatility
W
t,B
tIndependent standard one-dimensional Brownian motions
ρ
The correlation between the Brownian motions respectively
driving the asset price and the auxiliary process
r
The instantaneous interest rate
k
The speed of volatility mean reversion
θ
The long run mean of the volatility process
v
The volatility of the volatility process
T
The maturity of a European option
N
Number of time steps
Table 1 List of Notations
1. Scott’s Stochastic volatility model
In order to evaluate derivative securities, such as options, the stochastic
volatility model is used as an approach to resolve the shortcoming of the
Black-Scholes model. It derives from how the underlying security's volatility as a
random process to be governed by state variables, such as the price level of the
underlying security and the tendency of volatility to revert long-run mean value,
as well as the variance of the volatility process itself.
In our paper, we focus on Scott’s study in pricing European options. The Scott’s
stochastic volatility model has the general form as below
0 0 0 0 2,
)
(
)
(
0
),
1
(
)
(
y
Y
dW
Y
σ
dt
Y
b
dY
s
S
dB
ρ
dW
ρ
S
Y
f
dt
rS
dS
t t t t t t t t t t
(1.1)
Where r is the instantaneous interest rate, and B
tand W
tare independent
standard one-dimensional Brownian motions, ρ is the correlation between the
Brownian motions and the process Y
t, f is transformation function with value e
y
,
b(y) is a function about the speed of volatility mean reversion with the long run
mean of the volatility process and value of auxiliary stochastic process which
equal to k (θ – y), and volatility function σ (y) = v.
Through Scott’s stochastic volatility model we can calculate the price of an
European option with good convergence properties while we assume that
functions f , σ and b are smooth in return when we construct and analysis simple.
2. Deriving Solution Procedure
Through five steps we can derive and calculate European option price. In these
five steps we describe how to derive the model and find solutions for the model.
First, our main idea is to make a rotation of stochastic integral involving the
common Brownian motion W
tin the model. Then we use Itô’s formula to
achieve the new form of model without common Brownian motion W
t. Next
deriving the solution for the equation of model which we obtain after Itô’s
formula and then construct a discretization scheme in order to allow for a weak
convergence on the whole trajectory order one and avoid simulating the iteration
of stochastic integrals.
Step 1 We make (1.1) logarithmic change of variables for the asset: X
t= lnS
t.
After arrangement the model has the form (2.1) below
0 0 0 0 2 2,
)
(
)
(
)
ln(
),
1
)(
(
)
2
/
)
(
(
y
Y
dW
Y
σ
dt
Y
b
dY
s
X
dB
ρ
dW
ρ
Y
f
dt
Y
f
r
dX
t t t t t t t t t(2.1)
Here we use the asset price process X
tto substitute the stock price.
Step 2 Then we define the primitive F(y) as
F
y
yf
σ
y
y
dy
0(
)
)
(
)
(
(2.2)
From ( 2.2), we can calculate F(y) by
y y y y y ye
v
v
dy
e
v
dy
y
f
y
σ
dy
y
f
y
F
0 0 0 01
)
(
)
(
)
(
)
(
(
1
)
1
)
(
1
0
y ye
v
e
e
v
(2.3)
Step 3 Now it is the most important step that we apply Itô’s formula to (2.1).
In terms of the Itô process (2.4) and a new process (2.5)
dY
μ
(
Y
t,
t
)
dt
σ
(
Y
t,
t
)
dW
t(2.4)
Y
(
t
)
f
(
Y
(
t
),
t
)
(2.5)
We can obtain
dY
μ
y
dt
σ
y
dw
t
(2.6)
Then we apply
Itô formula to (2.6), we can have
t
dW
y
f
σ
dt
σ
y
f
μ
y
f
t
f
dF
2 2 22
1
(2.7)
Since we know
)
1
(
1
)
,
(
)
(
)
,
(
)
(
)
,
(
e
y
v
t
y
f
y
σ
t
y
σ
y
b
t
y
μ
Then we can calculate first and second derivative the function
f(y,t) with
respect to y.
y
e
v
y
f
1
y
e
v
y
f
1
2
2
And we can substitute
y
f
and μ
to (2.7) and then we can get
(
)
1
y
σ
e
v
σ
y y
So that the formula becomes
t
e
σ
y
dW
tv
dt
y
σ
y
b
e
v
Y
dF
y y)
(
1
)
(
2
1
)
(
1
)
(
2
(2.8)
Continue to simplify (2.8) with previous value of f(y) and σ (y) in (1.1)
dt
y
f
y
σ
dY
y
σ
y
f
dt
y
σ
dY
y
σ
y
f
dW
y
σ
dt
y
σ
dt
y
b
y
σ
y
f
Y
dF
t t t t t t t t t t t)
(
)
(
2
1
)
(
)
(
)
(
2
1
)
(
)
(
)
(
)
(
2
1
)
(
)
(
)
(
)
(
2 2
(2.9)
Since
(
)
)
(
)
(
)
(
)
(
)
(
)
(
2 t t t t t t t yy
σ
y
f
y
σ
y
σ
y
f
y
σ
y
f
v
e
So that
σ
Y
dY
σ
Y
f
Y
f
Y
σ
Y
dt
Y
f
Y
dF
t t t t t t t t(
(
)
'
(
)
(
)
'
(
))
2
1
)
(
)
(
)
(
(2.10)
We substitute (2.10) into (2.1), therefore the model becomes
0 0 0 0 2,
)
(
)
(
)
ln(
),
(
)
(
1
)
(
)
(
y
Y
dW
Y
σ
dt
Y
b
dY
s
X
t
dB
Y
f
ρ
dt
Y
h
Y
dF
ρ
dX
t t t t t t t t(2.11)
Where
(
(
)
'
(
)
(
)
'
(
))
2
1
)
(
)
(
)
(
)
(
2
1
)
(
2σ
y
f
y
f
y
σ
y
y
σ
y
f
y
b
ρ
y
f
r
y
h
(2.12)
Furthermore, since we know
y y
e
y
f
v
y
σ
y
θ
k
y
b
e
y
f
)
(
)
(
),
(
)
(
,
)
(
Then we can get
/
2
(
)
/
2
)
(
2 y y yve
v
e
y
θ
k
ρ
e
r
y
h
(2.13)
Now we change this model (2.11) equation without common Brownian motion
W
t,where this equation expressed by k and θ are strictly positive constant, which
are the speed of volatility mean reversion and the long run mean of the volatility
process respectively. Then we can figure out solutions of our model by
integrating the first equation in (2.11).
Step 4 After integrating the first equation in (2.11) we have the following
solution for the model:
s t s t s t t
s
ρ
F
Y
F
y
h
Y
ds
ρ
f
Y
dB
X
0 0 2 0 0)
(
(
)
(
))
(
)
1
(
)
ln(
(2.14)
As we can see from (2.14), there are only two integrals left which respect to
time which can be treated by the use of a trapezoidal scheme and a stochastic
integral which is independent of the Brownian motion.
If we let
δ
N
T
/
N
be the discretization step and for any function V, we define
ys
v
ds
y
v
ζ
0(
)
)
(
and
(
,
)
(
(
))
1y
v
ζ
t
ζ
y
t
v
η
V
where
ζ
is a primitive of 1/v, and then the solution can be written as
η
.
Within this step we can calculate
η
v
(
t
,
y
)
and
η
v
0(
t
,
y
)
, where
V
(
s
)
σ
(
s
)
and
V
0(
s
)
b
(
s
)
σ
(
s
)
σ
'
(
s
)
/
2
Since we know
V
(
s
)
σ
(
s
)
v
y
vx
x
v
y
v
ds
y
v
ζ
y
0)
(
and
ζ
v
x
vx
)
(
1Then, we can obtain that
vt
y
v
y
t
ζ
y
v
ζ
t
ζ
y
t
v
η
V V
)
(
))
(
(
)
,
(
1 1(2.15)
As well as, from
V
0(
s
)
b
(
s
)
σ
(
s
)
σ
'
(
s
)
/
2
k
(
θ
s
)
We can calculate
xk xk xk y y y y
e
e
θ
y
e
y
θ
θ
kx
y
θ
θ
x
y
θ
θ
k
θ
k
y
θ
k
s
θ
k
s
θ
ds
k
s
θ
k
ds
s
v
ds
y
v
ζ
)
1
(
ln
ln
1
ln
1
)
ln(
1
)
(
ln
1
1
)
(
)
(
)
(
0 0 0 0 0 0
Finally, we can derive inverse
ζ
0
(
)
(
1
)
1 xke
θ
x
v
ζ
(2.16)
Then substitute (2.16) into the equation ηv
0(t,y),
(
)
1
1
1
)
ln
1
(
))
(
(
)
,
(
ln ) ln 1 ( 1 0 1 0 0y
θ
e
θ
y
θ
θ
e
θ
e
θ
e
θ
y
θ
θ
k
t
ζ
y
v
ζ
t
ζ
y
t
v
η
xt xt y θ θ xt y θ θ x t x V V
(2.17)
At last, we get the solutions for the volatility of time and the initial value of the
auxiliary stochastic volatility. In final step we figure the discretization scheme of
Y
twhich is an auxiliary stochastic process and apply to the JAVA programming
in order to calculate asset price accurately.
Step 5 The discretization scheme of Y has the form as below.
0 0
y
Y
N
1
0
))),
,
2
(
0
,
(
,
2
(
0
1 1
Y
k
N
N
T
v
η
W
W
v
η
N
T
v
η
Y
t t tN N t k k k kAs well as the discretization scheme of X has the form
G
v
ρ
m
y
F
Y
F
ρ
s
X
TN N T N T N T
ln(
0)
(
(
)
(
0))
(
1
2)
where
1 0 12
))
(
)
(
N k N t N t N N T k kY
h
Y
h
δ
m
1 0 1 2 22
))
(
)
(
N k N t N t N N T k kY
f
Y
f
δ
v
And G is a standard normal random variable. Furthermore,
X
TNis a Gaussian
random variable with mean
TNN T
F
y
m
Y
F
ρ
s
)
(
(
)
(
))
ln(
0 0and variance
(
1
ρ )
2v
TNconditionally on
k N N tkY
0 .3. User’s Guide of JAVA Applet
A JAVA applet is designed to calculate the European call option and the
simulating price graph is plotted as well. Within this JAVA applet we
programmed different financial and mathematical parameters in order to input
data to calculating different results. The applet layout consists of Input, Control
and Output panels.
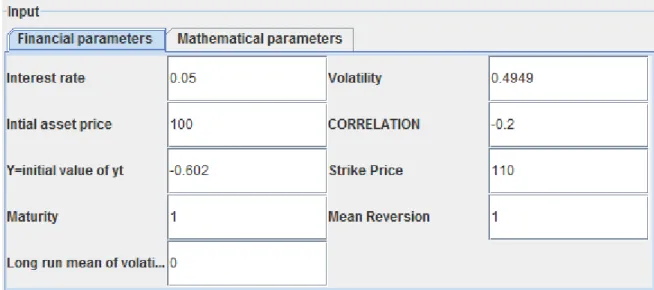
3.1 Input Panel
The input panel contains two parts which are Financial and Mathematical
Parameters. They are shown as below:
Figure 3.1.1 Input Financial Parameters
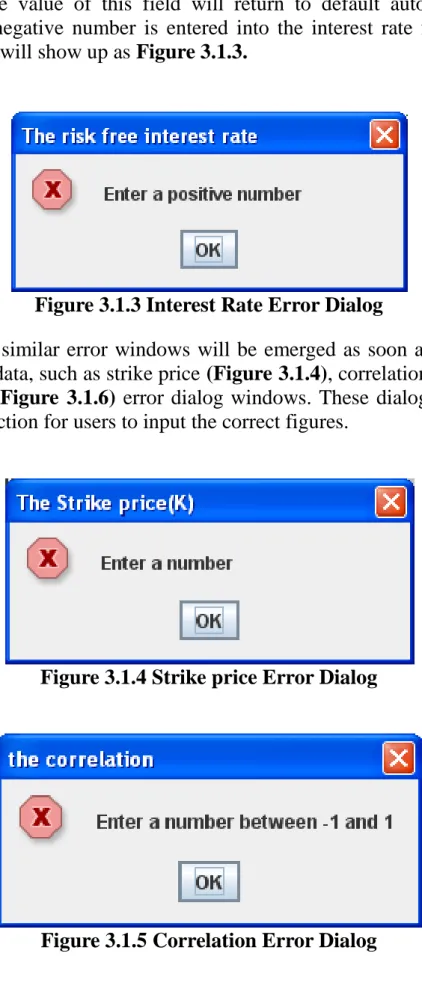
For all input data values into a field should satisfy the type of input value which
is programmed. If a wrong type of data is input, an error warning window will
emerge and the value of this field will return to default automatically. For
example, if a negative number is entered into the interest rate field, the error
dialog window will show up as Figure 3.1.3.
Figure 3.1.3 Interest Rate Error Dialog
Other kinds of similar error windows will be emerged as soon as users enter a
wrong type of data, such as strike price (Figure 3.1.4), correlation (Figure 3.1.5)
and time step (Figure 3.1.6) error dialog windows. These dialog windows can
provide a protection for users to input the correct figures.
Figure 3.1.4 Strike price Error Dialog
Figure 3.1.6 Time Steps Error Dialog
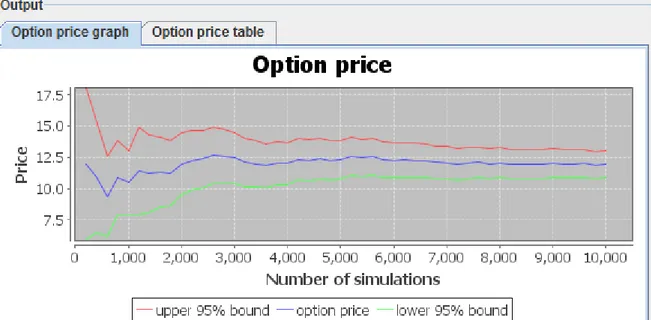
3.2 Control and Output Panels
A Calculate button and a Reset button lay on the control panel. After users input
data they can press the Calculate button to calculate the results of price and
press Reset button to return default value. After calculating option price, a
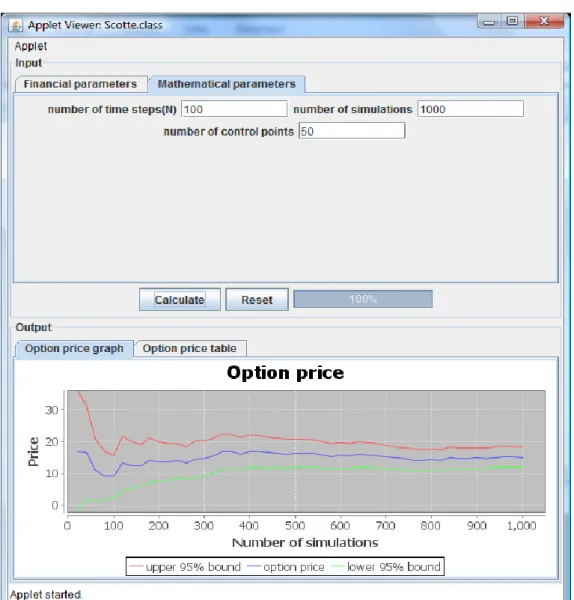
simulating price graph will show in the output panel (Figure 3.2.1) as well as
the option price table will emerge (Figure 3.2.2), as following:
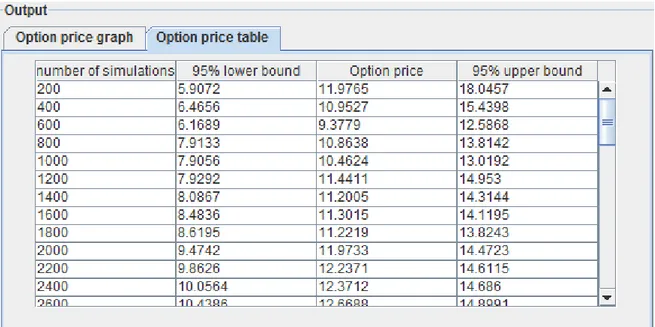
Figure 3.2.2 Option Price Table
The prices on this table are classified by the control points of number of
simulations. The lower price bound and upper price bound are listed as well.
Besides, both lower and upper bound are plotted in the option price graph.
4. Numerical Results and Analysis
In this section we examine the different parameters of calculation of European
option pricing. Through changing parameters we can analysis different
numerical results and provide us data to predicting the price of options.
CASE 1 Increase Interest Rate (г)
In this case we only increase interest rate and remain others parameter same in
order to figure out the effect of changing interest rate. The flowing option price
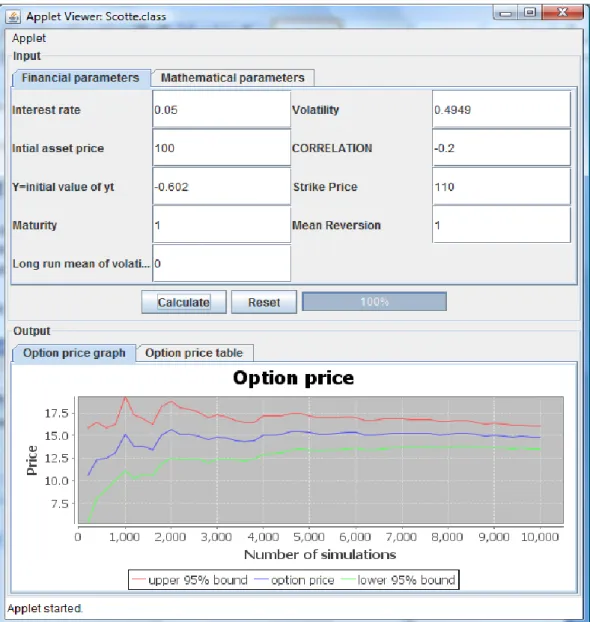
with certain amount of simulation is obtained on interest rate is 0.05:
Figure 4.1.2 Mathematical Parameters of JAVA Applet
Figure 4.1.3 Option Price Table with Interest Rate 0.05
As we can see from output, we have different option price which is blue line in
(4.1.1) after different times of simulation. And the more times of simulating, the
less fluctuation of option price. As well as we give the upper and lower bound
which are red and green line respectively in (4.1.1).
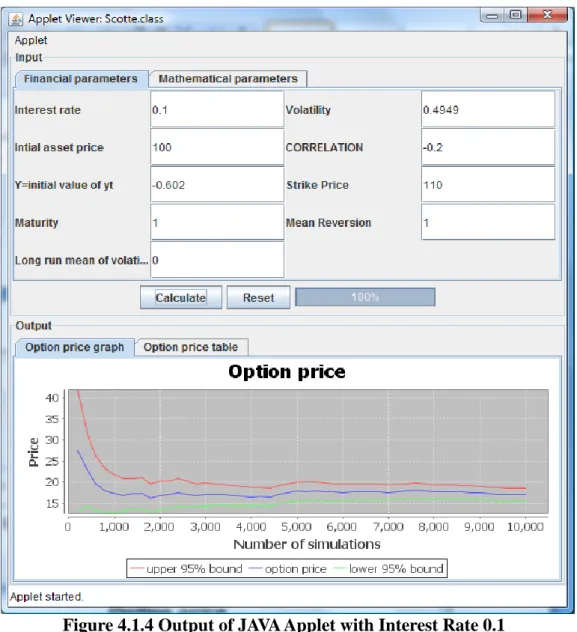
Figure 4.1.4 Output of JAVA Applet with Interest Rate 0.1
We can see from figure 4.1.4 and figure 4.1.5 that when the interest rate
increases the option price increase as well. In order to observe the change of
increasing interest rate we make once more calculate which increasing the
interest rate to 0.5 and others parameters obtained.
Figure 4.1.6 Output of JAVA Applet with Interest Rate 0.5
As we can see, the option price increases sharply when the interest rate increase.
In the market investors purchase call option and make more profit while interest
rate increase.
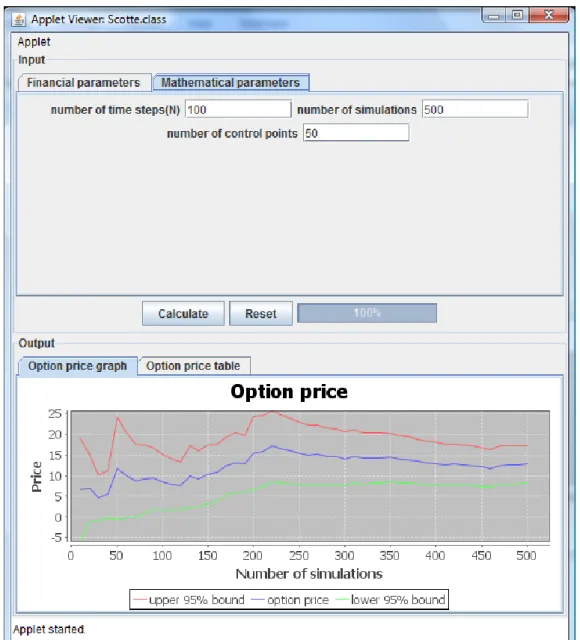
CASE 2 Increase Numbers of Simulation (N):
The number of simulations can affect the accuracy of the option price. With the
certain number of simulating the option price curve tend to be even and closed
to the mean of real option price. Then we use four numbers 500, 1000, 5000 and
10000 to test the result of simulations.
When we simulate for 100
When we simulate for 1000
Figure 4.2.2 Result of 1000 Simulations
From figure 4.2.1 and figure 4.2.2 we can observe the curve of option price
becomes even in figure 4.2.2 which is unlike the fluctuant curve in figure 4.2.1.
Then we do more tests with large number of simulation.
When we simulate for 5000
Figure 4.2.3 Result of 5000 Simulations
When we simulate for 10000
Figure 4.2.4 Result of 10000 Simulations
According to our tests, we can observe that the curve becomes even which that
means the option price is quite closed to the real price.
Case 3: Change Volatility (σ):
What will happen if we change the volatilities? We test the different value of
volatilities and to see what happen for the option price.
Calculate for Volatility is 0.60:
Figure 4.3.1 Result of Volatility 0.60
Option price for volatility 0.90:
Figure 4.3.3 Result of Volatility 0.90
Figure 4.3.4 Option Price Table for Volatility 0.90
Repeat to test some others value of volatility we create an inductive table as
below:
Volatility
Call Option prices
0.4949
15.4113
0.60
17.1398
0.70
21.3289
0.80
24.9266
0.90
27.5769
From the table 4.3.1 we can easily see that option price increase with the value
of volatility increase. Since the market becomes risky, inventors have bigger
chance to make profit than in a stable market.
CASE 4 Change of Correlation (ρ):
We know the correlation ρ
[-1, 1]
is between the Brownian motions respectively
driving the asset price and the auxiliary process. In this case we examine the
sensitive of change of option price with correlation.
When the correlation is -0.7
When the correlation is -0.2
Figure 4.4.2 Option Price when correlation is -0.2
When the correlation is 0
When the correlation is 0.5
Figure 4.4.4 Option Price when correlation is 0.5
As we can see from these four figures, the price is low when the correlation is
less than zero since the asset price has inversely correlated with the auxiliary
process. With the correlation increase the option price increase as well.
Furthermore, the increase of option price is sharp which this means investors
can have a good payoff when the correlation more than zero.
Conclusion
In this paper, we use Scott’s stochastic volatility model to price European call
option through applying JAVA programming. Through deriving the model
expression we explain the characteristic of this model with strong convergence.
With the implementation of JAVA applet, option price can be visible in a graph
and a price table with different parameters. The analysis for changing different
parameters shows how sensitivity of option price changing with parameters,
such as the option price increase sharply when the correlation ρ more than zero.
To conclude, we should mention that this model assumes that the underlying
volatility is constant over the life of the derivative, and no effect by changing in
the price level of the underlying security.
Reference
High order discretization schemes for stochastic volatility models
By Benjamin Jourdain and Mohamed Sbai arXiv:0908.1926v2 [math
.PR]Efficient Simulation of the Heston Stochastic Volatility Model
By Leif Andersen (January 23, 2007). Available at SSRN:
http://ssrn.com/abstract=946405
Option from
http://economics.about.com/cs/economicsglossary/g/option.htm
Last visit 2010/06/05
Stochastic volatility from
http://en.wikipedia.org/wiki/Stochastic_volatility
Last visit 2010/06/10
Itô formula from
http://www.theponytail.net/wiki/pmwiki.php/Main/ItoFormula
Appendix
JAVA Code for Pricing European Call Option
/*** @(#) Scotte.java 1.0 03/05/2010 *
* Copyright (c) 2010 Mälardalen University
* Högskoleplan Box 883, 721 23 Välterås, Sweden. * All Rights Reserved.
*
* The copyright to the computer program(s) herein * is the property of Mälardalen University.
* The program(s) may be used and/or copied only with * the written permission of Mälardalen University * or in accordance with the terms and conditions * stipulated in the agreement/contract under which * the program(s) have been supplied.
*
* Description: pricing European call option in Scott's * stochastic volatility model
* Jourdain, B., Sbai, M. High order discretization * schemes for stochastic volatility models.
* arXiv:0908.1926v1 [math.PR] 13 Aug 2009 * @version 1.0 03 May 2010
* @author S.M. Nazmul Hoque and Hailong Zhao * Mail: */ import java.awt.*; import java.awt.event.*; import javax.swing.*; import java.text.*; import java.util.*; import org.jfree.chart.*; import org.jfree.chart.axis.*; import org.jfree.chart.plot.*; import org.jfree.data.xy.*; import org.jfree.data.statistics.*;
public class Scotte extends JApplet implements FocusListener, ActionListener {
// Class variables
// Panels
private JPanel inputPanel = new JPanel(); private JPanel controlPanel = new JPanel(); private JPanel financialPanel = new JPanel(); private JPanel mathematicalPanel = new JPanel(); private JPanel outputPanel = new JPanel();
private ChartPanel graphPanel = new ChartPanel(null); private JPanel tablePanel = new JPanel();
// Tabbed panes
private JTabbedPane inputPane = new JTabbedPane(); private JTabbedPane outputPane = new JTabbedPane();
// Buttons
private JButton calculateButton = null; private JButton resetButton = null; // Progress bar
private JProgressBar bar = new JProgressBar(JProgressBar.HORIZONTAL); // Labels
private JLabel label = null; //private JLabel label1= null;
// Text fields
private JTextField interestField = new JTextField(); private JTextField volatilityField=new JTextField();
private JTextField intialassetpriceField= new JTextField(); private JTextField correlationField= new JTextField();
private JTextField initialvalueofytField = new JTextField(); private JTextField strikepriceField = new JTextField(); private JTextField maturityField = new JTextField(); private JTextField meanreversionField = new JTextField();
private JTextField longrunmeanvolatilityField = new JTextField(); private JTextField numberoftimestepsField = new JTextField(10); private JTextField numberofsimulationField = new JTextField(10); private JTextField numbercontrolpointsField= new JTextField(10);
// table model
private TableModel prices = new TableModel();
// tables
private JTable pricesTable = new JTable(prices);
// Scroll panes
private JScrollPane pricesPane = new JScrollPane(pricesTable); // Number formatter
DecimalFormat myFormatter = null; // String constants
private final String FINANCIAL = "Financial parameters";
private final String MATHEMATICAL = "Mathematical parameters"; private final String INPUT = "Input";
private final String OUTPUT = "Output";
private final String CALCULATE = "Calculate"; private final String RESET = "Reset";
private final String GRAPH = "Option price graph"; private final String TABLE = "Option price table"; private final String INTEREST = "Interest rate"; private final String VLATILITY = "Volatility";
private final String INTIALASSETPRICE="Intial asset price"; private final String CORRELATION = "CORRELATION";
private final String INITIALVALUEOFYT ="Y=initial value of yt"; private final String STRIKEPRICE ="Strike Price";
private final String MATURITY = "Maturity";
private final String MEANREVERSION ="Mean Reversion";
private final String LONGRUNMEANVOLATILITY= "Long run mean of volatility";
private final String NUMBEROFTIMESTEPS=" number of time steps(N)"; private final String NUMBEROFSIMULATION ="number of simulations"; private final String NUMBERCONTROLPOINTS="number of control points"; private final String LOWER_BOUND = "95% lower bound";
private final String UPPER_BOUND = "95% upper bound"; // Tooltips
private final String INTEREST_TOOLTIP = "The risk free interest rate"; private final String VOLATILITY_TOOLTIP= "The Volatility";
private final String INTIALASSETPRICE_TOOLTIP ="The initial asset price";
private final String CORRELATION_TOOLTIP = "the correlation";
private final String INITIALVALUEOFYT_TOOLTIP="Y=initial value of yt"; private final String STRIKEPRICE_TOOLTIP= "The Strike price(K)";
private final String MATURITY_TOOLTIP =" the Maturity date(T)"; private final String MEANREVERSION_TOOLTIP = " the mean reversion"; private final String LONGRUNMEANVOLATILITY_TOOLTIP =" the long run mean volatility";
private final String NUMBEROFTIMESTEPS_TOOLTIP ="The number of time steps";
private final String NUMBEROFSIMULATION_TOOLTIP ="the number of simulations";
private final String NUMBERCONTROLPOINTS_TOOLTIP="the number of control points";
// Error messages
private final String NOT_A_NUMBER = " Enter a number";
private final String NON_POSITIVE = " Enter a positive number"; private final String NOT_INTEGER = " Enter an integer number";
private final String NOT_A_CORRELATION = " Enter a number between -1 and 1";
// Numerical constants
private final double INTEREST_RATE = 0.05; private final double VOLATILITY_RATE=0.4949; private final double INTIALASSETPRICE_So= 100.0; private final double CORRELATION_p= -0.2;
private final double INITIALVALUEOFYT_yt=-0.602; private final double STRIKEPRICE_K= 110;
private final double MATURITY_T= 1.0;
private final double MEANREVERSION_VALUE =1.0;
private final double LONGRUNMEANVOLATILITY_VALUE=0.0; private final int NUMBEROFTIMESTEPS_VALUE=100;
private final int NUMBEROFSIMULATION_VALUE=10000; private final int NUMBER_CONTROL_POINTS = 50; // Numerical variables
private double interestRate = INTEREST_RATE; private double volatility= VOLATILITY_RATE;
private double initialassetprice =INTIALASSETPRICE_So; private double correlation = CORRELATION_p;
private double initialvalueofyt = INITIALVALUEOFYT_yt; private double strikeprice = STRIKEPRICE_K;
private double maturity =MATURITY_T;
private double meanreversion =MEANREVERSION_VALUE;
private double longrunmeanvolatility = LONGRUNMEANVOLATILITY_VALUE; private int numberoftimesteps = NUMBEROFTIMESTEPS_VALUE;
private int numberofsimulation = NUMBEROFSIMULATION_VALUE; private int numbercontrolpoints= NUMBER_CONTROL_POINTS; // random number generator
private Random generator = new Random(); // Class methods
// Initialise decimal formatter
DecimalFormatSymbols symbols = new DecimalFormatSymbols(); symbols.setDecimalSeparator('.');
myFormatter = new DecimalFormat("###.####",symbols); // get content pane
Container contentPane = getContentPane(); // set layout
contentPane.setLayout(new GridLayout(0,1)); contentPane.add(inputPanel);
contentPane.add(outputPanel);
inputPanel.setLayout(new BorderLayout());
inputPanel.setBorder(BorderFactory.createTitledBorder(INPUT)); inputPanel.add(inputPane,BorderLayout.CENTER);
inputPanel.add(controlPanel, BorderLayout.SOUTH); calculateButton = new JButton(CALCULATE);
calculateButton.addActionListener(this); controlPanel.add(calculateButton);
resetButton = new JButton(RESET); resetButton.addActionListener(this); controlPanel.add(resetButton); controlPanel.add(bar); bar.setStringPainted(true); bar.setValue(0); bar.setIndeterminate(true); inputPane.add(financialPanel,FINANCIAL); inputPane.add(mathematicalPanel,MATHEMATICAL); outputPanel.setLayout(new BorderLayout());
outputPanel.setBorder(BorderFactory.createTitledBorder(OUTPUT)); outputPanel.add(outputPane,BorderLayout.CENTER);
outputPane.add(graphPanel,GRAPH); outputPane.add(tablePanel,TABLE);
financialPanel.setLayout(new GridLayout(0,4));
label = new JLabel(INTEREST); financialPanel.add(label);
interestField.setText(myFormatter.format(INTEREST_RATE)); interestField.setToolTipText(INTEREST_TOOLTIP);
interestField.addFocusListener(this); financialPanel.add(interestField); label = new JLabel(VLATILITY); financialPanel.add(label);
volatilityField.setText(myFormatter.format(VOLATILITY_RATE)); volatilityField.setToolTipText(VOLATILITY_TOOLTIP);
volatilityField.addFocusListener(this); financialPanel.add(volatilityField);
label = new JLabel(INTIALASSETPRICE); financialPanel.add(label); intialassetpriceField.setText(myFormatter.format(INTIALASSETPRICE_So)); intialassetpriceField.setToolTipText(INTIALASSETPRICE_TOOLTIP); intialassetpriceField.addFocusListener(this); financialPanel.add(intialassetpriceField); label = new JLabel(CORRELATION);
financialPanel.add(label);
correlationField.setText(myFormatter.format(CORRELATION_p)); correlationField.setToolTipText(CORRELATION_TOOLTIP);
correlationField.addFocusListener(this); financialPanel.add(correlationField);
label = new JLabel(INITIALVALUEOFYT); financialPanel.add(label); initialvalueofytField.setText(myFormatter.format(INITIALVALUEOFYT_yt)); initialvalueofytField.setToolTipText(INITIALVALUEOFYT_TOOLTIP); initialvalueofytField.addFocusListener(this); financialPanel.add(initialvalueofytField);
label = new JLabel(STRIKEPRICE); financialPanel.add(label);
strikepriceField.setText(myFormatter.format(STRIKEPRICE_K)); strikepriceField.setToolTipText(STRIKEPRICE_TOOLTIP);
strikepriceField.addFocusListener(this); financialPanel.add(strikepriceField); label = new JLabel(MATURITY);
financialPanel.add(label);
maturityField.setText(myFormatter.format(MATURITY_T)); maturityField.setToolTipText(MATURITY_TOOLTIP);
maturityField.addFocusListener(this); financialPanel.add(maturityField);
label = new JLabel(MEANREVERSION); financialPanel.add(label); meanreversionField.setText(myFormatter.format(MEANREVERSION_VALUE)); meanreversionField.setToolTipText(MEANREVERSION_TOOLTIP); meanreversionField.addFocusListener(this); financialPanel.add(meanreversionField);
label = new JLabel(LONGRUNMEANVOLATILITY); financialPanel.add(label);
longrunmeanvolatilityField.setText(myFormatter.format(LONGRUNMEANVOLATILITY _VALUE));
longrunmeanvolatilityField.setToolTipText(LONGRUNMEANVOLATILITY_TOOLTIP); longrunmeanvolatilityField.addFocusListener(this);
financialPanel.add(longrunmeanvolatilityField);
label = new JLabel(NUMBEROFTIMESTEPS); mathematicalPanel.add(label); numberoftimestepsField.setText(myFormatter.format(NUMBEROFTIMESTEPS_VALUE)) ; numberoftimestepsField.setToolTipText(NUMBEROFTIMESTEPS_TOOLTIP); numberoftimestepsField.addFocusListener(this); mathematicalPanel.add(numberoftimestepsField); label = new JLabel(NUMBEROFSIMULATION);
mathematicalPanel.add(label); numberofsimulationField.setText(myFormatter.format(NUMBEROFSIMULATION_VALUE )); numberofsimulationField.setToolTipText(NUMBEROFSIMULATION_TOOLTIP); numberofsimulationField.addFocusListener(this); mathematicalPanel.add(numberofsimulationField);
label = new JLabel(NUMBERCONTROLPOINTS); mathematicalPanel.add(label); numbercontrolpointsField.setText(myFormatter.format(NUMBER_CONTROL_POINTS)) ; numbercontrolpointsField.setToolTipText(NUMBERCONTROLPOINTS_TOOLTIP); numbercontrolpointsField.addFocusListener(this); mathematicalPanel.add(numbercontrolpointsField);
// add column titles to the table
prices.addColumn(NUMBEROFSIMULATION); prices.addColumn(LOWER_BOUND);
prices.addColumn(PRICE);
prices.addColumn(UPPER_BOUND);
// put call table into the scroll pane
pricesTable.setPreferredScrollableViewportSize(new
Dimension(500,200));
// add it to table panel
tablePanel.add(pricesPane);
}
public void focusGained(FocusEvent e) {} public void focusLost(FocusEvent e) { // Obtain source
Object source = e.getSource(); // if interest rate field
interestRate = readPositive(interestField, interestRate, interestField.getToolTipText()); return; } // if volatility field if (source == volatilityField) { volatility = readDouble(volatilityField, volatility, volatilityField.getToolTipText()); return; }
// if initial asset price field
if (source == intialassetpriceField) { initialassetprice = readPositive(intialassetpriceField, initialassetprice, intialassetpriceField.getToolTipText()); return; } // if correlation field if (source == correlationField) { correlation = readCorrelation(correlationField, correlation, correlationField.getToolTipText()); return; }
// if the initial value of yt field
if (source == initialvalueofytField) {
initialvalueofyt = readDouble( initialvalueofytField, initialvalueofyt,
initialvalueofytField.getToolTipText());
return; }
// if the strike price field
if (source == strikepriceField) {
strikeprice = readPositive (strikepriceField, strikeprice,
strikepriceField.getToolTipText()); return;
}
// if the maturity field
if (source == maturityField){
maturity = readDouble (maturityField, maturity,
maturityField.getToolTipText()); return;
// if the volatility mean reversion field if (source == meanreversionField) { meanreversion= readDouble(meanreversionField, meanreversion, maturityField.getToolTipText()); return; }
// if the long run mean of volatility process field
if (source == longrunmeanvolatilityField){ longrunmeanvolatility= readDouble (longrunmeanvolatilityField, longrunmeanvolatility, longrunmeanvolatilityField.getToolTipText()); return; }
// if the number of time steps field
if (source == numberoftimestepsField) { numberoftimesteps= readInt(numberoftimestepsField, numberoftimesteps, numberoftimestepsField.getToolTipText()); return; }
// if the number of simulation field
if (source == numberofsimulationField){ numberofsimulation = readInt(numberofsimulationField, numberofsimulation, numberofsimulationField.getToolTipText()); return; }
// if the number of control points field
if (source == numbercontrolpointsField){ numbercontrolpoints = readInt(numbercontrolpointsField, numbercontrolpoints, numbercontrolpointsField.getToolTipText()); return; } }
private double readPositive(JTextField field, double oldValue, String title) {
boolean isOK = true; double newValue = 1; try { // test input
newValue = Double.parseDouble(field.getText()); }
catch (NumberFormatException e) { // ERROR message
JOptionPane.showMessageDialog( null, NOT_A_NUMBER, title, JOptionPane.ERROR_MESSAGE); isOK = false; }
if (newValue <= 0) { // ERROR message
JOptionPane.showMessageDialog(null, NON_POSITIVE, title, JOptionPane.ERROR_MESSAGE); isOK = false; } if (isOK) { return newValue; } else { field.setText(Double.toString(oldValue)); return oldValue; } }
private double readDouble(JTextField field, double oldValue, String title) {
boolean isOK = true; double newValue = 1; try { // test input
newValue = Double.parseDouble(field.getText()); }
catch (NumberFormatException e) { // ERROR message
JOptionPane.showMessageDialog( null, NOT_A_NUMBER, title, JOptionPane.ERROR_MESSAGE); isOK = false; } if (isOK) { return newValue; } else { field.setText(Double.toString(oldValue)); return oldValue; } }
private int readInt(JTextField field, int oldValue, String title) {
boolean isOK = true; int newValue = 100; try { // test input
newValue = Integer.parseInt(field.getText()); }
catch (NumberFormatException e) { // ERROR message
JOptionPane.showMessageDialog( null,
title,
JOptionPane.ERROR_MESSAGE); isOK = false;
}
if (newValue <= 0) { // ERROR message
JOptionPane.showMessageDialog( null, NON_POSITIVE, title, JOptionPane.ERROR_MESSAGE); isOK = false; } if (isOK) { return newValue; } else { field.setText(Integer.toString(oldValue)); return oldValue; } }
private double readCorrelation(JTextField field, double oldValue, String title) {
boolean isOK = true; double newValue = 1; try { // test input
newValue = Double.parseDouble(field.getText()); }
catch (NumberFormatException e) { // ERROR message
JOptionPane.showMessageDialog( null, NOT_A_NUMBER, title, JOptionPane.ERROR_MESSAGE); isOK = false; }
if (Math.abs(newValue) > 1) { // ERROR message
JOptionPane.showMessageDialog( null, NOT_A_CORRELATION, title, JOptionPane.ERROR_MESSAGE); isOK = false; } if (isOK) { return newValue; } else { field.setText(Double.toString(oldValue)); return oldValue; } }
private double getEta(double t, double y){ return volatility*t+y;
}
private double getEtao(double t, double y){ return longrunmeanvolatility-(Math.exp(-1*initialassetprice*t)*(longrunmeanvolatility-y)); }
return interestRate- Math.exp(2*y)-correlation*(meanreversion*
(longrunmeanvolatility-y)*Math.exp(y))/volatility+volatility*Math.exp(y)/2; }
public void actionPerformed(ActionEvent e) {
// Obtain source
Object source = e.getSource(); // if calculate button
if (source == calculateButton) { // Program mathematics
// prepare progress bar
bar.setMaximum(numberofsimulation); bar.setValue(0);
bar.setIndeterminate(false); // introduce variables
double[] y = new double[numberoftimesteps+1]; y[0] = initialvalueofyt; double w = maturity/(2*numberoftimesteps); double w1 = Math.sqrt(2*w); double m = 0; double v = 0; double z = maturity/numberoftimesteps; double l = Math.log(initialassetprice); double f = (Math.exp(y[0])-1.0)/volatility; double o = 1.0-correlation*correlation; double sampleMean = 0; double sampleVariance = 0;
int[] number = new int[numbercontrolpoints];
double[] upperBound = new double[numbercontrolpoints]; double[] estimate = new double[numbercontrolpoints]; double[] lowerBound = new double[numbercontrolpoints]; int step = numberofsimulation/numbercontrolpoints; for (int i=0; i<numbercontrolpoints; i++) {
number[i] = step*(i+1); }
// Delete old rows, if any
int rowCount = prices.getRowCount(); for (int i=rowCount-1; i>=0; i--) {
prices.removeRow(i); }
int n =0;
// simulation loop
for (int i=0; i<numberofsimulation; i++) { for (int k=0; k<numberoftimesteps; k++) {
// calculate y[k+1]
double temp = getEtao(w,y[k]);
temp = getEta(w1*generator.nextGaussian(),temp); y[k+1] = getEtao(w,temp); m += (getH(y[k])+getH(y[k+1]))/2; v += (Math.exp(2*y[k])+Math.exp(2*y[k+1]))/2; } //calculate x m *= z; v *= z; double x = l+correlation*((Math.exp(y[numberoftimesteps])-1.0)/volatility-f); x += m; x += Math.sqrt(o*v)*generator.nextGaussian();
double securityPrice = Math.exp(x);
double optionPrice = Math.max(securityPrice-strikeprice,0); sampleMean += optionPrice;
sampleVariance += optionPrice*optionPrice; if (i==number[n]-1) {
estimate[n] = sampleMean/number[n];
double variance = sampleVariance/number[n]; variance -= estimate[n]*estimate[n];
double dif = 1.96*Math.sqrt(variance/number[n]); upperBound[n] = estimate[n]+dif; lowerBound[n] = estimate[n]-dif; bar.setValue(number[n]); bar.paint(bar.getGraphics()); n++; } } // Show results // create dataset
XYSeriesCollection dataset = new XYSeriesCollection(); // create series
XYSeries upper = new XYSeries("upper 95% bound"); XYSeries price = new XYSeries("option price"); XYSeries lower = new XYSeries("lower 95% bound"); double minResult = Double.POSITIVE_INFINITY; double maxResult = Double.NEGATIVE_INFINITY; // fill series and table
for (int i=0; i<NUMBER_CONTROL_POINTS; i++) { upper.add(number[i], upperBound[i]);
if (upperBound[i]<minResult) minResult = upperBound[i]; if (upperBound[i]>maxResult) maxResult = upperBound[i]; price.add(number[i], estimate[i]);
//fielsd
if (estimate[i]<minResult) minResult = estimate[i]; if (estimate[i]>maxResult) maxResult = estimate[i]; lower.add(number[i], lowerBound[i]);
if (lowerBound[i]<minResult) minResult = lowerBound[i]; if (lowerBound[i]>maxResult) maxResult = lowerBound[i]; // add new row
Object[] row = {new String(myFormatter.format(number[i])), new String(myFormatter.format(lowerBound[i])), new String(myFormatter.format(estimate[i])),
new String(myFormatter.format(upperBound[i]))}; prices.addRow(row);
}
// add series to data set
dataset.addSeries(upper); dataset.addSeries(price); dataset.addSeries(lower);
JFreeChart chart = ChartFactory.createXYLineChart( "Option price", // chart title
"Number of simulations", // x axis label
"Price", // y axis label
dataset, // data
PlotOrientation.VERTICAL, true, // include legend
true, // tooltips
false // urls
// change y axis
XYPlot plot = (XYPlot)chart.getPlot(); ValueAxis rangeAxis = plot.getRangeAxis();
rangeAxis.setRange(minResult-0.05, maxResult+0.05); // show graph graphPanel.setChart(chart); graphPanel.setVisible(true); return; } // if reset button if (source == resetButton) { interestRate = INTEREST_RATE; interestField.setText(myFormatter.format(INTEREST_RATE)); volatility= VOLATILITY_RATE; interestField.setText(myFormatter.format(VOLATILITY_RATE)); initialassetprice =INTIALASSETPRICE_So; intialassetpriceField.setText(myFormatter.format(INTIALASSETPRICE_So)); correlation = CORRELATION_p; correlationField.setText(myFormatter.format(CORRELATION_p)); initialvalueofyt = INITIALVALUEOFYT_yt; initialvalueofytField.setText(myFormatter.format(INITIALVALUEOFYT_yt)); strikeprice = STRIKEPRICE_K; strikepriceField.setText(myFormatter.format(STRIKEPRICE_K)); maturity =MATURITY_T; maturityField.setText(myFormatter.format(MATURITY_T)); meanreversion =MEANREVERSION_VALUE; meanreversionField.setText(myFormatter.format(MEANREVERSION_VALUE)); longrunmeanvolatility = LONGRUNMEANVOLATILITY_VALUE; longrunmeanvolatilityField.setText(myFormatter.format(LONGRUNMEANVOLATILITY _VALUE)); numbercontrolpoints = NUMBER_CONTROL_POINTS; numbercontrolpointsField.setText(myFormatter.format(NUMBER_CONTROL_POINTS)) ; return; } } }