MIRIAM
_____________________________________________
Models for rolling resistance In Road Infrastructure Asset Management systems
Road surface influence on tyre/road rolling resistance
Authors:
Ulf Sandberg, Swedish National Road and Transport Research Institute (VTI)
Anneleen Bergiers, Belgian Road Research Centre (BRRC)
Jerzy A. Ejsmont, Technical University of Gdansk (TUG)
Luc Goubert, Belgian Road Research Centre (BRRC)
Rune Karlsson, Swedish National Road and Transport Research Institute (VTI)
Marek Zöller, The Federal Highway Research Institute (BASt)
Deliverable # 4 in MIRIAM SP 1 Deliverable Version, 2011-12-31
Document type and No. Report MIRIAM_SP1_04
Sub-project SP 1 Measurement methods and source models
Author(s) Ulf Sandberg (a), Jerzy A. Ejsmont (b), Anneleen Bergiers (c), Luc Goubert (c), Marek Zöller (d), Rune Karlsson (a)
Authors' affiliations (acronyms) (a) VTI, (b) TUG, (c) BRRC, d (BASt) Contact data for main author ulf.sandberg@vti.se
Document status and date Deliverable Version 111231 Dissemination level Public
File Name MIRIAM_SP1_Road-Surf-Infl_Report
Foreword
MIRIAM, an acronym for "Models for rolling resistance In Road Infrastructure Asset Manage-ment systems", is a project started by twelve partners from Europe and USA. They have collectively contributed internal and external funding for this project. The managing partner is the Danish Road Institute.
The overall purpose of MIRIAM is to provide information useful for achieving a sustainable and environmentally friendly road infrastructure. In this project, the focus is on reducing the energy consumption due to the tyre/road interaction, by selection of pavements with lower rolling resistance – and hence lowering CO2 emissions and increasing energy efficiency.
MIRIAM has been divided into five sub-projects (SP). The work reported here has been made within SP 1 "Measurement methods and surface properties model".
A first phase of the project has included investigation of pavement characteristics, energy efficiency, modelling, and raising awareness of the project in order to secure economical and political support for a second phase. The second phase will focus on development and implementation of CO2 controlling models into the road infrastructure asset management systems.
The website of MIRIAM is http://www.miriam-co2.net/ where extensive project information can be found.
The order of authors on the title page, following the main author Ulf Sandberg, is alphabetical and is not related with the extent or importance of the co-authors' contributions.
This report is the fourth Deliverable of SP 1. The Deliverables of Phase 1 are the following:
Deliverable 1:
“Rolling Resistance – Basic Information and State-of-the-Art on Measurement methods”
Deliverable 2:
"Rolling Resistance – Measurement Methods for Studies of Road Surface Effects"
Deliverable 3:
“Comparison of Rolling Resistance Measuring Equipment - Pilot Study"
Deliverable 4:
“Road surface influence on tyre/road rolling resistance"
Acknowledgements and disclaimer
It is gratefully acknowledged that the studies reported here and the production of this report have been funded by the following organizations (in alphabetical order only):
• Belgian Road Research Centre (BRRC) • Pooled funds of project MIRIAM
• Swedish National Road and Transport Research Institute (VTI) • Swedish Transport Administration (STA)
• Technical University of Gdansk (TUG), Gdansk, Poland • The Federal Highway Research Institute (BASt)
The funding organizations have no responsibility for the contents of this report. Only the authors are responsible for the contents. Any views expressed are views of the authors only.
TABLE OF CONTENTS
SUMMARY VII
1 INTRODUCTION 1
2 PURPOSE, LIMITATIONS AND CONCEPT 2
3 TEXTURE AND ROAD UNEVENNESS RANGES AND COMMONLY USED PARAMETERS 3
3.1 Texture and road unevenness ranges 3
3.2 Commonly used measures describing the road surface 5
3.3 Positive and negative textures (skewness) 7
3.4 Tyre tread enveloping of texture 7
3.5 Other road parameters having a potential influence on rolling resistance 8
4 RESULTS OF MEASUREMENTS BEFORE 2000 9
4.1 Swedish measurements of texture effects 9
4.2 Swedish measurements of road condition effects 10
4.3 Belgian measurements of texture and unevenness effects 11
4.4 French measurements 12
4.5 German measurements in the 1990’s 14
4.6 New Zealand measurements in the 1990’s 15
4.7 Other early measurements 16
4.8 Discussion 17
5 RESULTS OF LABORATORY DRUM MEASUREMENTS 18
5.1 Measurements at Dunlop in the UK around 1980 18
5.2 Measurements at BASt in Germany in the 1990's 18
5.3 Measurements at TUG in Poland around year 2000 21
6 RESULTS OF TRAILER MEASUREMENTS IN SWEDEN 2007-2011 22
6.1 Introduction 22
6.2 Test (reference) tyres 23
6.3 Tested road surfaces 24
6.4 Pilot tests with RR trailer 24
6.5 Further tests with RR trailer – Macrotexture influence 24
6.6 Special effects – porosity 27
6.7 Special effects – stiffness 29
7 RESULTS OF COASTDOWN MEASUREMENTS IN SWEDEN 30
7.1 Coastdown measurements 30
7.2 Comparison of results obtained with other methods 31
8 SURVEY OF ROLLING RESISTANCE OF 40 DUTCH TEST TRACK SURFACES IN 2008 32
9 RESULTS FROM THE BELGIAN ARTESIS PROJECT 33
9.2 Correlation between RRC and texture 33
10 RESULTS FROM THE MIRIAM ROUND ROBIN TEST RELATED TO ROAD SURFACE INFLUENCE
ON ROLLING RESISTANCE 35
10.1 Introduction 35
10.2 Correlation between RRC and texture levels in third-octave bands 35
10.3 Correlation between RRC and macro- and megatexture levels LMa and LMe 36
10.4 Correlation between RRC and Mean Profile Depth (MPD) 38
10.5 Correlation between RRC and texture measures - Overall 40
10.6 Correlation between RRC and unevenness (IRI) 42
11 RESULTS OF MEASUREMENTS IN MINNESOTA 43
12 EFFECTS OF ASYMMETRIC PROFILES 44
12.1 Background 44
12.2 Work at TRL Ltd and Dunlop Tyres Ltd by Parry 44
12.3 Swedish tests in 2011 on polishing off the top of the surface 46
12.4 Results of tests in Minnesota in 2011 47
12.5 Results in the MIRIAM Round Robin Test (RRT) in 2011 47
13 INFLUENCE OF TYRES ON THE ROAD SURFACE EFFECT ON ROLLING RESISTANCE 48
14 OVERVIEW OF RESULTS 49
14.1 General 49
14.2 Macro- and megatexture levels (based on rms of profiles) 49
14.3 MPD 49
14.4 Enveloping 49
14.5 Unevenness and IRI 49
14.6 Texture spectral effects 50
14.7 Other pavement effects 50
14.8 Design of low rolling resistance pavements 50
14.9 The data reported here suggest that the most important texture range for generation of rolling Interactions
with vehicle type 50
15 CONCLUSIONS AND PROPOSED PRELIMINARY MODEL 51
16 RECOMMENDED FURTHER STUDIES 53
17 REFERENCES 54
A. Annex A: Asymmetric profile curves and enveloping procedures 56
A.1 Introduction 56
A.2 Asymmetric profile curves and skewness 56
A.3 MPD as a measure of asymmetry and its relation with skewness 57
SUMMARY
MIRIAM has established a sub-project (SP), designated SP 1, to deal with measurement methods for rolling resistance and related issues. This subject forms the most fundamental basis for the MIRIAM ambition to consider rolling resistance in pavement management or other types of infrastructure systems. Without robust measurement methods and equipment that can use them there will be no reliable data as input to such systems and the end result will be most uncertain, if useful at all.
In order to develop and study measurement methods, there must be a basic understanding of the influencing parameters as well as what energy losses that should be included in the concept of rolling resistance. These issues are, therefore, important parts of the work in SP 1. This report is intended to provide basic knowledge about how and to what degree the rolling resistance is influenced by various fundamental road pavement parameters, such as texture, unevenness and stiffness.
For road management purposes one cannot rely on direct measurements of rolling resis-tance; it is better to develop a model by which rolling resistance can be predicted from collected road pavement data, the latter of which is already made to a large extent in many European countries. This report aims at providing data for such predictions that may be used in sub-project 2 of MIRIAM.
This report summarizes research so far made with regard to this subject, covering the time period from approximately 1980 to and including major studies in 2011. It focuses on the correlation between rolling resistance coefficients or fuel consumption and road surface parameters. The most important work for this purpose is a number of studies in Sweden since 2005 and a Round Robin Test (RRT) made within the first phase of MIRIAM, but there are also many other studies which contribute to the knowledge.
The results presented in this report show the following:
Rolling resistance is not only a property of tyres, but is also a property of the pavement which is of high importance for the energy consumption in the road transport sector and must be systematically considered along with other functional properties in pavement management systems.
As an example, in the MIRIAM RRT, the range of surfaces on the test track (MPD from 0.08 to 2.77 mm) the rolling resistance coefficient for the test tyres increased from the smoothest to the roughest of the surfaces by 21 - 55 %, depending on the tyre type. Such rolling resistance differences correspond to roughly 7 - 18 % in fuel consumption differences, using calculations made in SP 2 of MIRIAM for light vehicles driving on a typical two-lane highway at 90 km/h (to be published in January 2012).
The range in rolling resistance between the best and worst pavements in the MIRIAM partner countries in Europe is at least 50 % (the worst has an RRC 50 % higher than the best), although the more common pavements exposed to high traffic flows show a range of 20-25 % in rolling resistance.
Macrotexture, represented by the parameter MPD, is a major factor influencing rolling resistance. MPD is particularly suited for this purpose as it is sensitive to the vertical direction of the peaks and valleys in the profile curves.
Especially, MPD calculated on an enveloped profile curve seems to give excellent correlation with rolling resistance. It is so well correlated with rolling resistance that it will be difficult to find a better single or major variable for the purpose of quantifying the pavement influence on rolling resistance.
Megatexture level might be an alternative parameter, albeit not really as good as MPD, provided it is calculated on an enveloped profile curve. The advantage with this measure is that it is easier to measure by road survey vehicles using profilometers.
The relation between rolling resistance coefficients and MPD is rather consistent measured in different and independent measurement series reported here. The currently best estimate is a coefficient X of 0,0017 to 0,0020 in an equation of RRC = X*MPD + Y, where Y is a constant depending on a large number of factors. The coefficient 0.0020 might be an attractive option as it is easy to remember and to use.
There has been in the past, and to some degree still is, a substantial bias between various series of measurements made by presently available rolling resistance trailers, a "day-to-day" variation; the source of which is not yet known. But it is believed that temperature is part of the solution and that uncertain calibration might be another part of the solution.
It is proposed that a tentative source model for the pavement influence on rolling resistance contains the following significant pavement parameters:
MPD, IRI, pavement stiffness.
Of these three, the MPD and IRI are certainly needed, but the need for stiffness is yet a bit uncertain.
For light vehicles the IRI effect on rolling resistance is probably around 1/3 of that of the effect of MPD. It may be higher for heavy vehicles. Nevertheless, it shall not be neglected. The best source model for the road surface influence is currently proposed to be:
Rolling resistance coefficient = Constant + 0.0020∙MPD + X∙IRI
where MPD is Mean Profile Depth in mm, measured according to ISO 13473-1 and X is a constant yet to be determined
and "Constant" is a value unique to a certain tyre and several other circumstances; usually around 0.008 to 0.012 for light vehicles and approximately 50-60 % of that for heavy vehicles.
This simple model is useful over a speed range of at least 50-110 km/h for the rolling resistance part of the driving resistance. Suspension losses are included only if the IRI term above is specified by assigning a number to its constant "X".
The model is based on light vehicle data. For heavy vehicles, one may use the same model, scaled to representative values of Cr for heavy vehicle tyres, as long as no better model is available, but one must be aware that it is very uncertain for this category.
It is noted that MPD and IRI are collected widely in most countries already, at least for the national and regional road networks. Thus, the use of these variables for rolling resistance prediction will be easy to implement.
Data on pavement stiffness is not commonly collected, but in this case one may find proxy variables, such as a distinction between classes of pavements (cement concrete, asphalt concrete, non-paved surfaces, new and old pavements, temperature, etc).
In the future, it is recommended to develop an enveloping procedure that can be used inter-nationally to calculate more appropriate and relevant MPD values for rolling resistance purposes. The RRT enveloping procedure constitutes a good start.
The work with the rolling resistance property of pavements has only just started. It is a very young discipline and a lot more research is needed in the near future; not the least about measurement methods.
In the special chapter about Recommendations, several suggestions for urgent and important future research are presented.
1 INTRODUCTION
Rolling resistance is a form of energy loss caused by the interaction between a rolling tyre and the road surface. This functional property of road surfaces and also of tyres is one of the most important from both an economical and environmental point of view; something which is acknowledged widely with regard to tyres but which is most often totally neglected with regard to road surfaces. There seems to be the misconception that rolling resistance is a property of tyres alone, rather than an interaction in which both components are equally “guilty”, just like the cases of skid resistance or tyre/road noise.
Road surfaces are traditionally selected essentially based on properties such as skid resistance, durability and cost; sometimes also ride comfort and tyre/road noise emission are considered. But rolling resistance is practically never considered.
One reason why rolling resistance properties of road surfaces are hardly ever given any importance is the lack of practical measurement methods and thus a lack of data. Rolling resistance of tyres is measured on laboratory drums using ISO and SAE methods but to take these methods out on the road is virtually impossible. The lack of proper measurements has resulted in ignorance about the effect of road surface on rolling resistance.
In order to develop and study measurement methods, there must be a basic understanding of the influencing parameters as well as what energy losses that should be included in the concept of rolling resistance. A report which intended to provide basic knowledge about the influence on rolling resistance of various parameters, suggest a definition of rolling resistance and provide some detailed state-of-the-art knowledge about the measurement methods and equipment that are useful for collecting rolling resistance data is already published within project MIRIAM [Sandberg (ed), 2011].
This report presents earlier as well as recent measurements of rolling resistance on a number of road surface types in various countries. Based on these data a relation between rolling resistance, as measured by the special trailers used in this project, and road surface parameters is suggested. This relation may be seen as a kind of source model; explaining the sources of the energy losses and its effects on rolling resistance.
2 PURPOSE, LIMITATIONS AND CONCEPT
The overall purpose of project MIRIAM is to study the potential for saving energy and CO2 emissions by adding rolling resistance data in road surface management systems.
The particular purpose of this report is to provide basic and up-to-date knowledge about the influence on tyre/road rolling resistance of various functional parameters of road surfaces.
The concept behind this report is the following:
• Rolling resistance is one of the most important functional properties of road pave-ments, applicable to the entire road network, which means that road authorities need to have information about it and be able to control it
• The direct measurement of rolling resistance is very difficult and requires the use of rather advanced equipment and methodology, operated by very skilled and experienced staff. Consequently, direct measurement of rolling resistance is possible only on a very small part of the road network
• A more practical way of controlling rolling resistance for road management purposes than directly measuring it, is to predict it from road pavement parameters that are already collected for most of the road network, such as texture, unevenness, stiffness and road topography
• Therefore, this report has a focus on modelling the relation between rolling resistance and road pavement parameters, based on the present availability of relevant data.
With regard to limitations, it is important to note the following:
• Rolling resistance is an interaction between tyre and road, although for the purpose of serving MIRIAM, this project has its focus on the road surface contribution
• It is important to understand that the energy losses in other vehicle components than the tyres, mainly the tyre suspension system, may not be well measured by the trailer equipment used so far, although they may be due to road surface properties
• Air resistance of the tyres is not a parameter intended to be included in the relations studied here as it is not a road-related property.
3 TEXTURE AND ROAD UNEVENNESS RANGES AND COMMONLY
USED PARAMETERS
3.1 Texture and road unevenness ranges
The basis for description of road roughness (texture and unevenness) is the profile of the surface along lines (in this case) representing the rolling paths of vehicle tyres.
The profile of the surface is described by two coordinates: one in the surface plane, called distance (the abscissa), and the other in a direction normal to the surface plane, called vertical displacement (the ordinate). The distance may be in the longitudinal or lateral (transverse) directions in relation to the travel direction on a pavement, or any direction between these extremes; although for rolling resistance, the longitudinal profile is the most important one. The transverse profile may have an influence on rolling resistance by the side-forces created when tyres roll on the slopes of a rut.
“Texture wavelength" is a descriptor of the wavelength components of the profile and is related to the concept of the Fourier Transform of a time series.
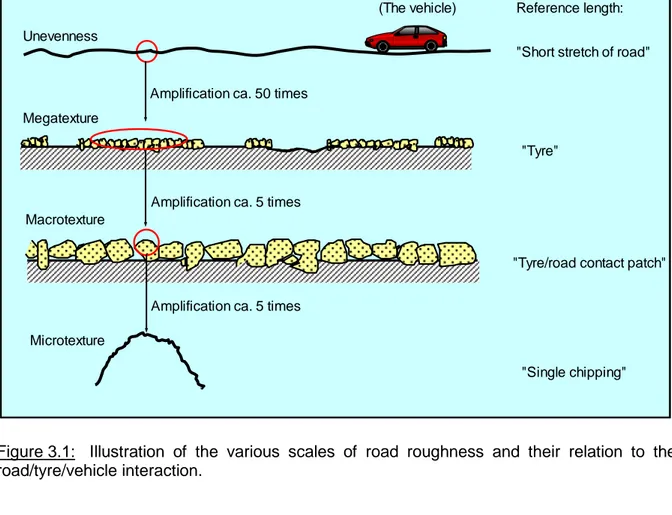
The profile may be studied in more or less detail, and the features of these will have different influences on the road/tyre/vehicle interaction. Figure 3.1 attempts to illustrate this.
(The vehicle)
"Single chipping" Unevenness
Amplification ca. 50 times
Macrotexture
"Tyre/road contact patch"
Microtexture
Reference length:
"Short stretch of road"
Megatexture
"Tyre"
Amplification ca. 5 times Amplification ca. 5 times
Figure 3.1: Illustration of the various scales of road roughness and their relation to the road/tyre/vehicle interaction.
As appears later, the texture and road unevenness are road surface properties that have major influences on rolling resistance. Therefore it is justified to examine these associated terms a little closer. The following is an adaptation from ISO 13473-5:2009.
Texture, or pavement texture, is the deviation of a pavement surface from a true planar surface, with a texture wavelength less than 0.5 m. It is divided into the sub-ranges micro-, macro- and megatexture; see Figure 3.2.
Figure 3.2: Ranges in terms of texture wavelength and spatial frequency of texture and unevenness and their most significant, anticipated effects; from [Sandberg & Ejsmont, 2002]. Note that the figure and especially the range for rolling resistance is an estimation made approx. 10 years ago, well before this report was written. See the Conclusions chapter for a possible update of this range.
.
Microtexture is the deviation of a pavement surface from a true planar surface with the characteristic dimensions along the surface of less than 0.5 mm, corresponding to texture wavelengths up to 0.5 mm expressed as one-third-octave centre wavelengths.
Macrotexture is the deviation of a pavement surface from a true planar surface with the characteristic dimensions along the surface of 0.5 mm to 50 mm, corresponding to texture wavelengths with one-third-octave bands including the range 0.63 mm to 50 mm of centre wavelengths.
Megatexture is the corresponding deviations with the characteristic dimensions along the surface of 50 mm to 500 mm, corresponding to texture wavelengths with one-third-octave bands including the range 63 mm to 500 mm of centre wavelengths.
Unevenness is the corresponding deviations with the characteristic dimensions along the surface of 0.5 m to 50 m, corresponding to wavelengths with one-third-octave bands including the range 0.63 m to 50 m of centre wavelengths.
3.2 Commonly used measures describing the road surface
A common way to quantify texture and unevenness is to filter the profile curve through different bandpass filters having passbands corresponding to the texture wavelengths shown in Figure 3.2 and defined in the text of the previous chapter and then to measure the rms (root-mean-square) output value of the filtered profile curve, using the unit [mm]. The measures in the various ranges may be distinguished by using the symbol aMi for micro-texture, aMa for macrotexture and aMe for megatexture, with values expressed in mm rms. The symbol "a" denotes "amplitude".
However, it has been preferred in especially noise-related studies to calculate and use the logarithms of these linear measures, then labelled LMi, LMa and LMe, expressed in dB relative to 1 μm rms. One advantage of this is that in most practical studies, this will result in a statistical distribution of the values which is more normal (Gaussian) than when using the corresponding linear measures. Thus, here we have the following measures:
• Microtexture level, LMi • Microtexture level, LMa • Microtexture level, LMe
For the unevenness range, there is no special symbol commonly used, corresponding to aMa and aMe and the logarithm conversion is seldom used.
For the very commonly used ranges macrotexture and unevenness, special measures have been standardised and are commonly used. For macrotexture we have two measures which are commonly used: Mean Texture Depth (MTD) and Mean Profile Depth (MPD).
MTD is a measure developed in the middle of the 20th century, where a certain volume of sand (later replaced by glass spheres of 0.17-0.25 mm diameter) is spread out with a tool (a rubber pad, often an ice hockey puck) flush with the peaks in the surface into a circular patch on the road surface, the diameter of which is measured. From the patch diameter and the sand volume, the mean depth of the texture over this patch is calculated. This is called the "volumetric patch method", earlier known as the "sand patch method".
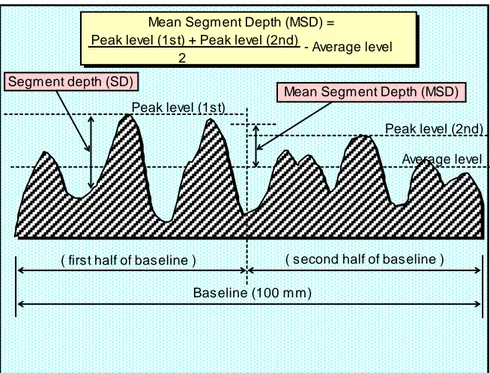
MPD is a measured developed in the 1980's and 1990's with the intention to become a replacement of the MTD which could be measured by moving vehicles using lasers and laser sensors to record the profile curve, from which a two-dimensional representative of the three-dimensional patch may be calculated. The corresponding standard, ISO 13473-1, is currently being revised, and the new calculation procedure is illustrated in Figure 3.2. From two halves of a 100 mm long profile (two 50 mm long segments), the so-called Mean Segment Depth (MSD) is calculated. By averaging several such MSD values over a certain road section, the MPD is obtained. The actual calculation is more complex than this description says, so the ISO 13473-1 should be consulted if actual measurements are planned.
Sometimes, the term Estimated Texture Depth (ETD) is seen. This is an estimation of the MTD from a measurement of the MPD, with a conversion equation appearing in ISO 13473-1.
In the unevenness range, a special measure is the International Roughness Index (IRI). It is calculated using a quarter-car vehicle mathematical model, supposed to be driven at 80 km/h (50 mph), whose response is accumulated to yield a roughness index which is the accumulated slope of the profile curve per km of road, be it negative or positive, expressed in mm/km or m/km. Since its introduction in the 1980's IRI has become the road unevenness index most commonly used worldwide for evaluating and managing road systems. IRI is specified in the international standard ASTM E1926 – 08.
Peak level (2nd) Mean Segment Depth (MSD) =
Peak level (1st) + Peak level (2nd) 2
Segment depth (SD)
Baseline (100 mm)
Average level
( first half of baseline ) ( second half of baseline ) Peak level (1st)
Mean Segment Depth (MSD) - Average level
Figure 3.3: Illustration of the terms Segment, Baseline, Segment Depth (SD), and Mean Segment Depth (MSD) (SD and MSD are expressed in millimetres).
In analogy with the macro- and megatexture levels mentioned above, one may filter the profile curve with narrower filters and calculate "spectral levels" in the corresponding pass-bands. The most common bandpass filters are one-third-octave pass-bands. By using such filters one obtains a texture spectrum. A typical texture spectrum (in one-third-octave bands) is shown in Figure 3.4, also including two special octave band levels..
20 30 40 50 60 315 160 80 40 20 10 5 2,5 Texture wavelength [mm] T ex tur e pr of ile l ev el r el . 1 m ic rom et re [ dB ] Fig 4-1 in 13473-5 630 LTX63 LTX500 LMe = 44,6 dB LTX63 = 41,5 dB LTX500 = 41,6 dB
Figure 3.4: Example of one-third-octave band texture spectrum with indication also of the texture levels of the octave bands LTX500 and LTX63.
-10 -5 0 5 10 15 1,2 1,3 1,4 Distance (m) P rof il e he ight ( m m ) 9 9,5 10 10,5 11 11,5 0,6 0,7 0,8 Distance (m) P rof il e H e ight ( m m )
The level of each of the two octave bands is indicated by the level of the top line of each rectangle. Note also that the presented spectrum represents a pavement having a relatively low megatexture; in this case a dense asphalt concrete with maximum 10 mm chippings, in near new condition.
3.3 Positive and negative textures (skewness)
A possible asymmetry of the profile, see Figure 3.5, should potentially have significant influence on the rolling resistance. A 'positive' texture (exhibiting protrusions) should show a significantly different behaviour in functional qualities, like skid resistance or noise genera-tion, than a negative texture (exhibiting depressions). To quantify such asymmetry, one may apply an analysis of the skewness, i.e. the third statistical moment of the quantity, to reveal this aspect of the profile.
Skewness of the profile, rsk, is defined in ISO 13473-2 as the quotient of the mean cube value of the ordinate values Z(x) and the cube of the rms value, within an evaluation length ℓ, according to the equation:
( )
=∫
0 d 1 1 sk Z x x rms r 3 3Skewness is dimensionless. Skewness (or just "skew") is a measure of assymmetry of the amplitude distribution (in this case of the ordinate values). This indicates whether the profile curve exhibits a majority of peaks directed upward (positive skew) or downward (negative skew). For a normal distribution rsk is zero.
Much more on this is presented in Annex A of this report.
Figure 3.5: Examples of surface profiles of positive macrotexture (left) and negative macrotexture (right). Skewness of the left profile would be positive (somewhat > 0) while it
would be substantially negative for the right profile (<< 0).
3.4 Tyre tread enveloping of texture
When a tyre runs on a textured road surface, it does not necessarily make contact with all points on the surface in its wheel path. This is, e.g., the case when the texture shows deep and irregular “valleys” (such as on porous asphalt) or deep and relatively regular “grooves" (such as on transversally grooved concrete). The tyre is said to be "enveloping" the part of the surface with which it is in contact.
It has been known already since the beginning of the 1990's that the fact that a tyre envelops only part of the surface of the pavement plays an important role for the prediction of tyre/road noise. As it is related with the way how the road texture deforms the tyre rolling over it, it should also be important for the aspect of rolling resistance.
More or less complex ways of tyre enveloping of road surface texture have been developed and tried in various projects. In the so-called RRT study in MIRIAM, reported in [Bergiers et al, 2011], a simplistic enveloping procedure was tried, with substantial success. The effect of this procedure on a profile curve with a high negative skew is shown in Figure 3.6, as an example. 55 56 57 58 59 60 61 62 63 0,5 0,51 0,52 0,53 0,54 0,55 0,56 0,57 0,58 0,59 0,6 Distance [m] V er ti cal d isp lacem en t [ m m ]
Original profile curve
Enveloping with d* = 0,054 [1/m]
Figure 3.6: Example of an original profile curve and the resulting profile curve when the enveloping procedure used in the RRT has been applied. The pavement was porous asphalt with max. 6 mm chippings.
Much more on the enveloping principle is presented in Annex A of this report.
3.5 Other road parameters having a potential influence on rolling resistance
Other road parameters which potentially may influence rolling resistance include pavement stiffness, microtexture, road condition, and rutting. For these, please refer to Chapter 4 of [Sandberg (ed), 2011].
In this report pavement stiffness is not quantified; it is just explained as a difference due to the binder used (bitumen or cement). Road condition and rutting, as well as microtexture, are not addressed.
4 RESULTS OF MEASUREMENTS BEFORE 2000
4.1 Swedish measurements of texture effects
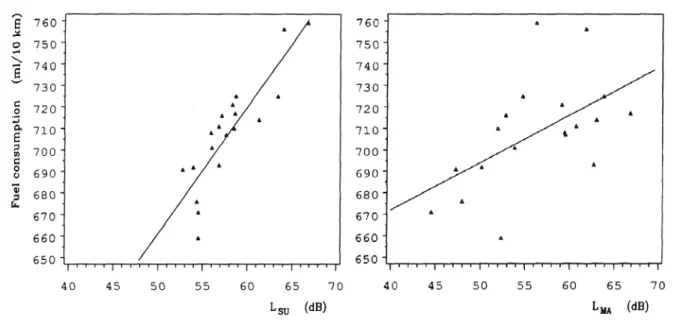
In 1983, Sandberg at VTI and his colleagues made measurements of fuel consumption of a Volvo 240 car on 20 road surfaces, cruising at 50, 60 and 70 km/h, with a variation in surface type and texture that covered most of the Swedish range by that time. He considered the fuel consumption differences as approx ¼ of corresponding rolling resistance differences when transforming results to rolling resistance. Texture and "shortwave unevenness" (wavelengths 0.5 – 3.5 m) were measured by means of a mobile laser profilometer mounted in an exceptionally soft-suspended luxury car. The tyres were Pirelli Cinturato C3 175SR14. Results were published no earlier than in 1990 [Sandberg, 1990].
When correlating fuel consumption (FC) with macrotexture level in the wavelength range 2-100 mm, Sandberg obtained the results shown in the right part of Figure 4.1. However, results were better correlated when plotting FC versus shortwave unevenness; see the left part of the figure.
Figure 4.1: Relation between fuel consumption (FC) at 60 km/h and shortwave unevenness in the 0.6-3.5 m roughness wavelength range (at the left) and between FC and macrotexture level LMA in the 2-100 mm texture wavelength range (at the right). Diagrams scanned from [Sandberg, 1990].
The correlation coefficient between FC values averaged for the three speeds 50, 60 and 70 km/h and shortwave unevenness level LSU was 0.91 while it was 0.60 when correlating with macrotexture level LMA. The LMA values can be transformed to MPD by using the equation:
MPD = 5·10-9·LMA4.762
based on later studies of the relation between MPD and LMA, and relative FC differences can be transformed to relative RRC differences by multiplying by 4. In this way one may deduce a relation between RRC and MPD of
One shall be aware of that when this study was made, standardised texture and unevenness measures did not exist. MPD was not yet known. Thus, measures chosen were "homemade".
As mentioned, the best correlation of FC was obtained with the shortwave unevenness (R = 0.91). Megatexture level came second (R = 0.83) and macrotexture third (R = 0.60). This was further illustrated when correlation between FC and road roughness/texture level as a function of texture wavelength was calculated; see Figure 4.2.
Figure 4.2: Correlation between fuel consumption per km and road roughness/texture level as a function of texture wavelength [Sandberg, 1990].
When making fuel consumption measurements, in contrast to trailer measurements, the suspension losses are clearly present and they should peak in the area where Sandberg's data peak. It was assumed that the suspension system of the test car was in excellent condition, but it was not tested.
The IRI is sensitive to wavelengths between approximately 1.2 and 30 m, with a maximum response at around 2.4 m wavelength [Sayers & Karamihas, 1998]. This is perfectly located in the "shortwave unevenness" range of the presented study. Therefore, one may say that IRI came out as a very influential parameter in this study.
4.2 Swedish measurements of road condition effects
There are a few reports about the effect of snow on rolling resistance [Kihlgren, 1977] [Lidström, 1979] [van Es, 1999], but they were made with aircraft tyres in mind and are a little difficult to assess for road conditions and road tyres. However, there is no doubt that the effects of snow are large. In fact, the model suggested in [Lidström, 1979] is presently imple-mented in VTI's VETO model, although the implementation is not easy since for an articu-lated truck (for example) there are many tyres, some rolling in different lateral positions, where snow conditions differ, some rolling in the same track with different snow compaction. An effect which is mostly forgotten in studies of texture influence on fuel consumption is the tyre drag effect on surfaces partly covered with water. The water level in ruts and pools (the latter is often an effect of megatexture) will be partly influenced by the macrotexture.
Non-uniform water depth may cause vehicle instability [Hight et al, 1993] but also increased fuel consumption. The water depth influences fuel consumption by at least about 10 % according to [Sävenhed, 1986]. A model developed in an MSc Thesis is presently implemented in the VETO model for calculating the effect of water on the pavement [Olsson, 1984].
4.3 Belgian measurements of texture and unevenness effects
Some groundbreaking work on rolling resistance and fuel consumption related to road sur-face properties were made in Belgium, France and Sweden in the 1980's.
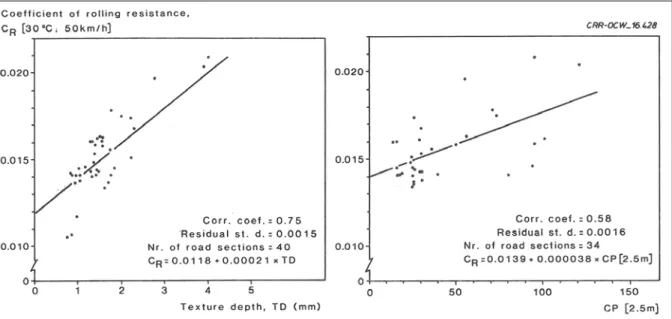
Using a special RR trailer (see [Sandberg (ed), 2011]), as well as a profilometer for the texture range and another one for the unevenness range, Descornet at BRRC analysed the relation between RRC and unevenness, megatexture and macrotexture [Descornet, 1990]. The test tyre was a pattern-less Michelin SB 14" tyre. Figure 4.3 shows the relations he recorded in terms of RRC (Cr) plotted against (M)TD in the left diagram and against the unevenness amplitude at 2.5 m wavelength in the right diagram. There is in the original article also a corresponding diagram for the unevenness wavelength of 10 m, showing essentially the same results as for 2.5 m.
Figure 4.3: Relation between Cr and (mean) texture depth (at the left) and between Cr and unevenness amplitude at 2.5 m texture wavelength (at the right). Diagrams scanned from [Descornet, 1990].
One should be aware that there might have been a correlation between the (M)TD and the unevenness, and that this may partly be reflected in the result in the right diagram. Note also that the slope in the left diagram is 0.0021 (Descornet is obviously wrong by one decimal in the printed Cr equation), which means that RRC increases by 0.0021 for each mm of texture depth increase. This may be compared with the 0.0016 obtained by Sandberg. As will be shown later, these values are fairly consistent with modern results.
Furthermore, Descornet found that the most sensitive spectral range was the megatexture range [Descornet, 1990]. See Fig. 4.4. It appeared that the most sensitive range is mega-texture, but that macrotexture is also very influential, at least when disregarding the 6 sections that were transversely grooved.
Descornet also recorded an interesting relation between Cr and tyre internal temperature, but this is reported in [Sandberg et al, 2011].
Figure 4.4: Correlation between RRC (Cr) and road roughness/texture level as a function of texture wavelength [Descornet, 1990]. The dashed line is the result when the 6 (concrete) pavements that had transverse textures (out of 37 pavements) were neglected.
The diagrams of Figures 4.2 and 4.4 look quite differently. However, in a way, the difference is logical, since when making fuel consumption measurements, in contrast to trailer measure-ments, the suspension losses are present and they should peak in the area where Sandberg's data peak. It may be noticed that in the megatexture and macrotexture areas Descornet's and Sandberg's data are not very different.
4.4 French measurements
By fuel consumption measurements using a passenger car on roads representative of the French network and by assessment of heat emission related to the conversion of mechanical energy in dampers during tests on a vibration bench, a French study in the 1980's gave some insight into the relation between fuel consumption (FC) and road texture and unevenness, reported as both [Laganier & Lucas, 1990] and [Delanne, 1994]. In fact, these tests also included pure rolling resistance measurements on the wheel of a car driving on 5 surfaces on the Nantes test track; the same test track as now is managed under IFSTTAR. To begin with the rolling resistance measurements on the test track, it appeared that over the range of MTD from approx. 0 to 5 mm, RRC increased from 0.018 to 0.024. This would correspond to a slope in RRC versus macrotexture (MPD) of 0.00125; which was a bit lower than the Belgian and Swedish results. FC measurements gave approx. the same value if an FC difference is assumed to correspond to 1/3 of an RRC difference.
FC measurements on the roads showed an "overconsumption" of fuel of up to 6 % for a car which had an average fuel consumption of 7 litres/10 km as influenced by unevenness and 5 % as influenced by macrotexture (MTD variation was 0.5-2.5 mm). The results in terms of extra FC versus unevenness are illustrated in Figure 4.5 (note that unevenness is not an IRI scale).
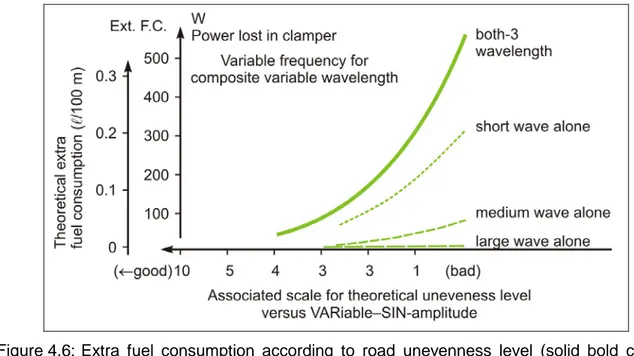
Figure 4.5: Extra fuel consumption according to road unevenness level. See text for explanations. Diagram adapted by the authors from [Laganier & Lucas, 1990].
Results of measurements and calculations of power lost in shock absorbers (dampers) as a function of roughness level are shown in Figure 4.6. This is made for three wavelength ranges, namely small (1 m < λ < 3.3 m), medium (3.3 m < λ < 13 m) and longer than 13 m road roughness wavelengths (λ). Note that the "small" wavelength range, which includes the most sensitive IRI range and is close to the megatexture range, was by far the most important one for suspension losses. Laganier and Lucas considered the effects of unevenness and macrotexture as additional.
Figure 4.6: Extra fuel consumption according to road unevenness level (solid bold curve). The consumption is also presented as contributions within three roughness wavelength ranges. Based on measurements of power loss in suspension when tested in a test bench. See text for explanations. Diagram adapted by the authors from [Laganier & Lucas, 1990].
4.5 German measurements in the 1990’s
An early version of the BASt trailer for rolling resistance, see description in [Sandberg (ed); 2011], was used in the 1990's to make measurements on 10 surfaces on the German motorway A555 [Ullrich et al, 1996]. These included the use of 4 different (car) test tyres. Results were presented as "normalized Cr at 25 oC". Probably, "normalized" just referred to temperature correction according to ISO to a reference temperature of 25 oC. Measurement of the textures of the same surfaces was made by means of a laser profilometer. The results were presented as rms values of the profile curves, filtered in three different texture wavelength ranges:
0.3 – 10 mm "fine texture" 10 – 100 mm "coarse texture" 10 – 500 mm "megatexture"
However, the texture rms values were normalized to proportions relative to one surface and that surface was given the value 1.0 mm. Therefore, all texture values are just relative to this surface. They cannot be compared to any "modern" standardized measures.
Figure 4.7 shows the result for the case of texture in the 10-100 mm texture wavelength range, which was the range that gave the best correlation between Cr and texture. Diagrams for the other two texture ranges show similar results (correlation coeff. 0.71 for "fine texture" and 0.67 for "megatexture"). Despite the higher correlation for "coarse texture", 0.75 versus 0.67 for "megatexture", this main author thinks that one should not conclude that mega-texture is less important than "coarse mega-texture" (macromega-texture) since the poorer correlation is entirely due to the two smooth surfaces not being so extremely smooth in the megatexture range as they are in the two macrotexture ranges.
Figure 4.7: Relation between rolling resistance coefficient (probably average of 4 car tyres) and rms value of "coarse texture" for the 10 tested road sections. Texture values are given as a proportion of the texture of one of the surfaces (the rightmost data point, which is set as 1.0 mm). From [Ullrich et al, 1996].
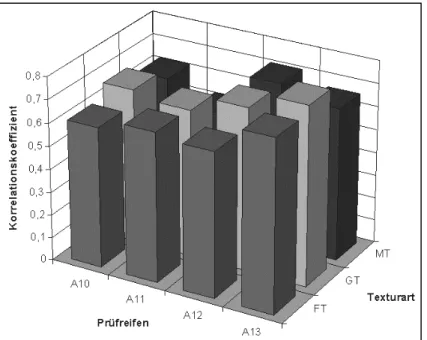
These German measurements also showed that the four car tyres had approximately equal correlations to the rms texture in the three texture ranges; see Figure 4.8.
Figure 4.8: Relation between rolling resistance coefficient for the four car tyres A10-A13 and rms value of the three texture ranges for the 10 tested road sections. FT = fine texture, GT = coarse texture and MT = megatexture. From [Ullrich et al, 1996].
See further presentations of this research in the chapter about drum measurements.
4.6 New Zealand measurements in the 1990’s
In New Zealand a special measurement method was developed in the late 1980's and early 1990's, called the steady state torque method [Cenek, 1994]. It essentially involves a test vehicle (both a car and a truck have been used) being driven at steady speeds between 20 and 75 km/h. At each speed, the driving torque of one (driven) tyre, together with the relative wind speed and direction are continuously measured. The latter are parts of an on-board anemometry system by which air resistance is controlled. The driving torque is divided by the dynamic tyre radius (1.03 x Static Radius) and corrected for ambient wind to obtain the driving force required to overcome all resistive forces with the exception of driveline losses. It should be noted that this method measures rolling resistance including the contribution by suspension losses.
Using this method, comprehensive work was conducted in New Zealand in 1988-1992 to determine the influence of NZ pavements on rolling resistance. The most important document is probably [Cenek, 1994]. The results indicated a rolling resistance range of 55 % between the best and the worst pavement, with MTD values ("sand circle" equal to "sand patch") varying from 0.6 to 2.7 mm and unevenness varying between 37 and 59 NAASRA counts/km (corresponding to IRI of 1.4 to 2.3).
The result according to [Cenek, 1994] was expressed as the following equation (in this case C0 can be considered equal to Cr):
C0 = 0.0102 + 8.35·10-4·MTD2 + 1.05·10-3·IRI
The authors of this report have made some calculations from the equation. For example, if we assume that IRI is 1.0, an MTD of 0.5 mm will give C0 = 0.01146, while MTD of 2.5 mm will give C0 = 0.0165. This is an increase in rolling resistance of 44 % for 2 mm MTD increase. If we assume that MTD = MPD (they are usually rather close) and neglects the nonlinearity of the equation above, this would correspond to a slope of 0.0022 in the equation of Cr versus MPD, as discussed earlier.
In another example, if we assume that MTD is 1.0 mm, an IRI of 0.5 will give C0 = 0.0115, while an IRI of 2.5 will give C0 = 0.0136. This is an increase in rolling resistance of 18 % for an IRI increase from 0.5 to 2.5.
This may suggest that the influence over the range of IRI on a common paved road network would amount to approximately half that of the range of macrotexture. Again, this shows the importance of macrotexture and that unevenness is a parameter that shall not be neglected.
Another study in New Zealand; a follow-up regarding the rolling resistance and fuel con-sumption of heavy trucks [Jamieson & Cenek, 2002], concluded that the two most important pavement variables for rolling resistance were:
• Average Rebound Deflection (RD), expressed in mm (this is a measure of the pave-ment stiffness)
• Short Wavelength Roughness (SWR) in the wavelength range 0.5 – 5 m, expressed as band-filtered RMS value in mm
Macrotexture was not very important, and even had a negative relation to FC, despite a rather large range. This indicates what is already known for heavy truck tyres and noise emission: macrotexture has rather small influence, and sometimes even a negative corre-lation with noise [Sandberg & Ejsmont, 2002].
Two medium commercial vehicles, and three tyre sizes commonly found on New Zealand commercial vehicles were selected for the test programme. Each of the trucks was instru-mented to allow determination of component vehicular drag forces using the steady state wheel torque method.
The most interesting thing of this study is that for trucks, the shortwave unevenness is the most important range, plus that pavement stiffness is important, while macrotexture is less important. However, one should bear in mind that this probably depends partly on the tyres chosen (drive tyre treads versus steer axle treads).
4.7 Other early measurements
A review of early data on the relation between rolling resistance and road surface texture should not miss to mention the work of DeRaad in the 1970's [DeRaad, 1978]. Apart from making indoor drum tests he measured rolling resistance by means of a 5th wheel attached to a light truck. Testing included 10 car tyres run at 30 mph on 6 pavements covering a large range of textures.
The results indicated, as a percentage relative to the Cr of a new cement concrete surface, that Cr varied between 88 and 133 %; i.e. a very large range. However, the polished concrete (88 %) seemed to be an extremely smooth pavement not normally accepted on highways.
Unfortunately, the texture was never quantified and therefore the study by DeRaad has only historical interest to project MIRIAM.
It shall also be mentioned that in the literature one may find several documents reporting rolling resistance or FC measurements on various pavements, where the pavements have been poorly described and surface properties rarely quantified, except that often some kind of unevenness values (only) are reported. These studies are not mentioned here as they would not provide much help in determining a quantified relation between rolling resistance and surface properties.
4.8 Discussion
The following conclusions are drawn from the data of these older measurements:
Over the range of road surfaces tested, the surface properties seem to influence car fuel consumption by approx 10 % (the worst – the best), while rolling resistance would be influenced by as much as 40-55 %.
When fuel consumption of a full car has been measured, the highest correlations between Cr and road surface texture and unevenness are obtained for "shortwave unevenness", in a wavelength range which seems to be where IRI values would be most sensitive (although IRI was not a known measure when the measurements were made). It is assumed that for the unevenness range, the energy losses occur in the suspension of the cars and not in the tyres; albeit they may be considered as being related to rolling resistance.
When trailers have been used, the macrotexture and megatexture ranges come out as the most important ones. The same applies to the static wheel torque method involving a full car. The relation between Cr and macrotexture seems to lie in the range of 0.0016 (and the French study as low as 0.00125) and 0.0022 expressed as the slope coefficient in the regression of macrotexture (in mm texture depth) upon (the dimensionless) Cr.
The main value of these data is that they suggest that one shall measure both the tyre rolling resistance and the suspension losses if one wants to measure the full influence of the road surface properties, and that the megatexture and shortwave unevenness ranges are very important, beside macrotexture.
It will be a challenge to rolling resistance trailers to take suspension losses into consideration in future studies.
5 RESULTS OF LABORATORY DRUM MEASUREMENTS
5.1 Measurements at Dunlop in the UK around 1980
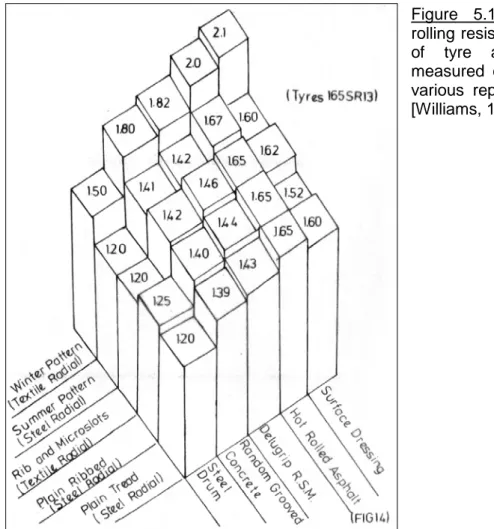
Work at Dunlop tyres in the U.K. to reduce rolling resistance of tyres around 1980 was reported by [Williams, 1981]. The experiments involved the use of a drum facility on which replica road surfaces were fitted (one by one). In total 5 tyres and 5 replica surfaces were tested. The results are summarized in Figure 5.1. It can be seen that the range is almost 100 % increase from smooth steel to a rough-textured surface dressing. If the steel surface is excluded, the range shrinks to 50 %. This approximately corresponded to the texture range of common UK surfaces by that time.
Figure 5.1: Relationship between rolling resistance coefficient and type of tyre and road surface, as measured on a drum facility having various replica road surfaces. From [Williams, 1981].
5.2 Measurements at BASt in Germany in the 1990's
Related to the measurements reported in Chapter 4.5, BASt in Germany used their drum facility PFF (PFF = Prüfstand Fahrzeug Fahrbahn, see description in [Sandberg (ed); 2011]), to make measurements on 11 surfaces mounted successively on the drum [Ullrich et al, 1996][Sander, 1996]. Of the surfaces which were examined, three were produced as close replicas of real road surfaces and two surfaces were constructed as “ISO surfaces”; however, becoming much too smooth according to this author. The remaining ones were sandpaper-like surfaces with various grit sizes.
The rolling resistance measurements included the use of four different (car) tyres. Results were presented as "normalized Cr at 25 oC". Probably, "normalized" just referred to
temperature correction according to ISO to a reference temperature of 25 oC. Measurement of the textures of the drum surfaces was made by means of a laser profilometer. The results were presented as RMS values of the profile curves, filtered in three different texture wavelength ranges:
0.3 – 10 mm "fine texture" 10 – 100 mm "coarse texture" 10 – 500 mm "megatexture"
Figure 5.2 shows the average Cr for the tyres, distinguishing between the four dimensions used, over 10 of the 11 drum surfaces. In the figure the three rightmost surfaces were asphalt concrete with gradations indicated and the four in the middle were asphalt surfaces with chippings spread on the surface of various indicated gradations. The two rougher of these should be possible to use on real roads. The three surfaces at the left were various sandpaper-type surfaces. 30 40 50 60 70 0,6-1,0 P24 0,7-1,2 P20 1,0-1,7 P16 1,0-1,7 Kunstharz 0,7-1,4 2,0-2,8 4,0-5,6 8,0-11,0 0/8 ISO unbeh. 0/8 ISO beh. 0/11 S beh. M it tl. Rollw ide rs ta nd R 25 / [ N] 195/65 R15 H 205/60 R15 V 175/70 R13 T 155/70 R13 T Korn/ mm:
Art/ Träger: Korund/ Schmirgelleinen Splitt/ Kunstharz Asphaltbeton
Figure 5.2: Average rolling resistance (Cr) values from drum tests - two runs for each of four tyres at three different speeds (50/90/120 km/h) on 10 of the 11 drum surfaces.
Figure 5.2 shows that the four tyres ranked the surfaces in a very similar way; there is just a certain bias between the four curves.
Figure 5.3 shows the relation between the average Cr values and the macrotexture, the latter expressed as RMS value of the profile within the texture wavelength band 0.3 – 10 mm. Similar diagrams were reported also for the other two texture ranges, but as they gave lower correlations they are not reproduced here.
It is interesting to note that the highest correlations here were obtained for the “fine macro-texture”. This is opposite to all other studies. Probably, it has to do with the selection of the surfaces in the test program, since 7 of the 10 surfaces were too smooth or had too small chippings to be realistic on real roads. Nevertheless, it is notable that the relation appears to be rather linear even down to the very smooth textures in this test program.
A compilation of the correlation coefficients between rolling resistance and texture in the three bands, for both the drum and the trailer measurements (see Chapter 4.5) is shown in Table 5.1.
Figure 5.3: Relation of rolling resistance to fine macrotexture (0.3 - 10 mm) for drum tests (using tyre 175/70 R13T).
Table 5.1: The correlation coefficients between rolling resistance and texture in the three bands, for both the drum and the trailer measurements.
Texture parameter Drum Trailer Fine texture 0.3 - 10 mm 0.97 0.71 Coarse texture 10 - 100 mm 0.89 0.75 Megatexture 100 - 500 mm 0.74 0.67
A compilation of the rolling resistance coefficients measured on four tyres, both on the drum and on the road (a very smooth surface) is shown in Table 5.2.
Table 5.2: Average rolling resistance coefficient values (temperature corrected) in %, measured on the drum and compared with trailer measurements on a road surface.
Tyre type Drum (PFF) Trailer (A555/H)
A10 0.802 0.794
A11 1.051 1.178
A12 0.826 0.962
5.3 Measurements at TUG in Poland around year 2000
Results of tests made on the rolling resistance drum facility at TUG in Gdansk in a VTI-TUG project including measurements of Cr (RRC) on approx 100 car tyres, are shown in Figure 5.4. The tests were made on the TUG drum facility for car tyres (drum diameter 1.7 m), having two very different drum surfaces, one smooth sandpaper (brand name "Safety Walk") and one surface dressing with max. 11 mm chippings. The latter is a commercial product labelled APS-4 and produced by a French company as a carpet with embedded chippings.
Fig. 4.5: RRC versus speed, tested for approx. 100 car tyres of various brands and dimen-sions. Unpublished data from TUG/VTI.
The sandpaper surface had an estimated MPD of 0.12 mm and the surface dressing an estimated MPD of 2.4 mm. Assuming a linear relationship, from the MPD values and the difference in RRC, one may calculate the slope of the RRC versus MPD as 0.0021. Note that this is for approx. 100 car tyres.
An important issue is whether the effect of MPD on RR depends on the speed. The measurements were actually made at the three speeds 80, 100 and 120 km/h. A multiple regression analysis indicated the following relation between RRC, the road surface parameter MPD and speed:
RRC = 0,01065 + 0,002012·MPD + 0,0000064·MPD·(V-20) where MPD is in mm and V (speed) in m/s.
The combined term MPD(V-20) has a very small coefficient, which is not significantly different from zero for the data available. RRC versus speed data indicates that RRC slightly depends on the speed. However, this dependence does not necessarily have to be coupled to MPD. A conclusion from this is that the MPD effect is either independent of the speed or depends very weakly on it, at least in the speed range 80-120 km/h
Another set of car tyres was measured a few years later in the EU project SILENCE [Sandberg et al, 2008]. The surfaces were the same, but the tyres were 6 tyres chosen to be representative of popular market tyres. They were tested in new condition and at various state of wear (8, 6, 4 and 2 mm tread depth); i.e. for 24 tyre/tread depth combinations. The result was a slope coefficient of 0.0020 as an average for all tread depths, and 0.0021 for full tread depth and 0.0018 for 2 mm tread depth. It suggests that worn-out tyres are a little less sensitive to texture than new ones.
10 11 12 13 14 15 16 80 100 120
Tyre rolling speed [km/h]
R R C [ k g/ ton]
Smooth drum surface (sandpaper) Rough drum surface (surface dressing)
6 RESULTS OF TRAILER MEASUREMENTS IN SWEDEN 2007-2011
6.1 Introduction
The Technical University of Gdansk (TUG) in Poland, under the leadership of Prof Jerzy A. Ejsmont, 5-8 years ago produced an improved version of the Belgian trailer used by Descornet; the results of which are summarized in Chapter 4.3. VTI ordered the first measurements by this trailer in 2005 while it still was not validated and used the results (see below) to increase the interest in the subject at the Swedish Road Administration.
After it became evident that Swedish roads had very unfavourable textures for rolling resistance, and thus creating extra fuel consumption and CO2 emissions from traffic, the interest in the subject has been steadily increasing in Sweden and the intention is that models for selection of pavements and their maintenance shall include a rolling resistance parameter in the near future.
The measurements in 2005 have been followed by more and more extensive measurements, made by improved versions of the TUG trailer until the present time. In most cases also noise and texture measurements have been made on the same surfaces. The latter have been made by the VTI mobile laser profilometer. The following sub-chapters will present the essential results of these measurements; however, excluding the noise properties.
The measurement instruments are presented in [Sandberg (ed), 2011]. However, a picture of the TUG trailer appears in Figure 6.1.
Figure 6.1: The tyre/road rolling resistance measurement trailer from TUG in the shape and condition of 2010 (before 2009 the test tyre was not enclosed).
6.2 Test (reference) tyres
As it is very impractical to measure rolling resistance using a great number of tyres representing the tyre market, when classifying or ranking pavement properties for rolling resistance, it is practical if not necessary to use reference tyres. The purpose of these is to be representative of the category of tyres that they are intended to represent and to provide stable and repeatable conditions. A common reference tyre concept is that one tyre shall represent the fleet of automobile tyres on the roads (tyre category C1), and another tyre shall represent the fleet of heavy truck tyres (C3). One might also want to have a tyre representing the middle range; van tyres (C2). Reference tyres must be available for a long time.
This concept is already implemented in the drafts ISO/DIS 11819-2 and ISO/TS 11819-3 which are two documents specifying the so-called CPX method for classification of noise properties of pavements. A draft for an ASTM method for a "Standard Test Method for Measurement of Tire-Pavement Noise Using the On-Board Sound Intensity (OBSI) Method" specifies the use of one reference tyre (the SRTT). The tyres used in the CPX method by ISO are shown on the left (SRTT) and in the middle (AAV4) in Figure 6.2. The tyre on the right is an extra tyre used by TUG from the time when they started to make RR ments, and has been kept since then for the purpose of providing a link to old measure-ments.
Figure 6.2: Reference tyres used in the tests reported in this article. Refer to the text for more information.
The SRTT ("Standard Reference Test Tire") is a tyre specified in ASTM F2393 as a reference tyre for various purposes. The Avon AV4 tyre (designated "AAV4") is a tyre tested and found to classify pavements (for noise) in roughly the same way as a selection of regular heavy truck tyres do. It is in fact a light truck tyre, but as the smallest dimension for this series of tyres is used, the AAV4 fits on large passenger cars, as does the SRTT.
The SRTT and the AAV4 are tyres considered in the MIRIAM project to become reference tyres also for rolling resistance, and will be tested for this purpose in MIRIAM.
As it is a reference tyre specified by ASTM, the SRTT is likely to be available for several decades in the future. The AAV4 tyre will not be manufactured in the future unless the users of CPX tyres orders a full batch of 100 or more tyres simultaneously, which is indeed the plan.
6.3 Tested road surfaces
On behalf of VTI, TUG has measured RRC on a number of road surfaces in Sweden and Denmark in the past 5 years using the TUG "R2 trailer". The tested pavements in this time period, 2005-2010, include the following numbers and types:
11 Dense asphalt concrete, max. aggr. sizes 6, 8, 11, 16 mm 9 SMA (stone matrix asphalt), max. aggr. sizes 6, 8, 11, 16 mm 1 Hot rolled asphalt (HRA), UK type, max. aggr. size 16 mm
3 Dense-graded asphalt rubber (Arizona type adapted to Sweden), max. aggr. sizes 11, 16 mm
1 Open-graded asphalt rubber (Arizona type adapted to Sweden), max. aggr. size 11 mm 3 Porous asphalt concrete, single-layer, max. aggr. sizes in top layer 8, 11 mm
3 Porous asphalt concrete, double-layer, max. aggr. sizes in top layer 8, 11 mm 2 Chip seals (surface dressings), single layer, max. aggr. size 11 mm
6 Thin asphalt layers (dense), max. aggr. sizes 6, 8, 16 mm 1 Exposed aggregate cement concrete, max aggr. size 16 mm 1 SMA, max. aggr. size 16 mm, medium texture but very uneven
These have been in various conditions; including both new pavements and a few near the end of life. Some of the pavements have been tested in Denmark (on the other side of the Oresund, close to southern Sweden) but most of them are Swedish pavements.
6.4 Pilot tests with RR trailer
In this chapter, the results will not be listed in tables for each test condition, tyre and pavement. It would be a huge table difficult to evaluate. Instead, the RRC data will be plotted against the MPD data in regression diagrams.
The first diagram shows results measured in 2005 and 2007, at a time when the test tyre was not yet protected from the air flow by an enclosure. Figure 6.3 shows results corrected for the air flow effect (by testing at various speeds and deducting the speed effect), where RRC has been plotted against MPD values for the same pavements, at 80 km/h. These measurements were made by using four automobile tyres, including one SRTT. The round (grey) symbols are for dense asphalt and SMA pavements having max. aggr. sizes 8, 11 and 16 mm, and an extremely rough-textured chip seal at the top; while the square (red) symbol is for an exposed aggregate cement concrete (EACC) with max. aggr. size 16 mm.
Apart from a correlation so high that it is probably just by chance, it may be noted from this diagram that the EACC pavement follows the same RRC-MPD trend as the asphaltic pavements. It is claimed by the cement concrete industry in North America that such rigid pavements have lower RRC than flexible pavements but our measurements could not verify this. Note also the very large range of RRC: over the measured MPD range, the highest RRC on the regression line is 45 % higher than the lowest RRC on the same regression line. One may say that this MPD range covers the macrotexture range of Swedish paved roads; if one excludes pavements with faults such as bleeding asphalt and pavements with lots of ravelling and pot-holes.
6.5 Further tests with RR trailer – Macrotexture influence
When measurements were made after 2008, TUG had fitted an enclosure over the test tire; more or less eliminating the air flow resistance around the tire adding to the rolling resistance. In the years 2009-2010 a number of series of rolling resistance measurements were made in Sweden (and one in Denmark). A compilation of such RRC data, plotted as a function of Mean Profile Depth (MPD), the latter measured according to ISO 13473-1, appears in Figure 6.4.
y = 0,0024x + 0,0082 R2 = 0,9853 0,008 0,009 0,010 0,011 0,012 0,013 0,014 0 0,5 1 1,5 2 2,5 MPD in mm (ISO 13473-1) R R C aver . f o r 4 t yr es
Figure 6.3: Rolling resistance coefficient plotted against macrotexture (MPD) for measure-ments 2005 and 2007. The round (grey) symbols are for dense asphalt, and SMA pavemeasure-ments and an extremely rough-textured chip seal (the highest point); while the square (red) symbol is for an EACC (cement concrete). Note that, opposed to what is written in 6.2, these measurements were made with four tyres (RRC averaged), of which one was the SRTT; the others were regular market automobile tyres.
The figure includes only the results at 80 km/h. The reason is that it appeared that the RRC data measured at 50 km/h correlated almost perfectly to those at 80 km/h. Thus; adding more speeds does not add more information. This also shows that the measurements were repeatable (within the day) and subject to only small disturbances. But due to this, in this report, for the Swedish 2009-2010 data, only the results for 80 km/h are displayed.
In Figure 6.4, all measurements in 2009-2010 are put into the same diagram without distinction. R2 which shows the variance explained by the RRC-MPD regression as part of the total variance in this set of data, is only 0.26. This is statistically significant on the 95 % level, but it is very disappointing compared to the earlier results plotted in Figure 6.3. One may therefore suspect that there is one variable (or more) out of control in this scenario which ruins the correlation.
All series merged into one y = 0,0017x + 0,0088 R2 = 0,2626 0,007 0,008 0,009 0,010 0,011 0,012 0,013 0,014 0,015 0,0 0,1 0,2 0,3 0,4 0,5 0,6 0,7 0,8 0,9 1,0 1,1 1,2 1,3 1,4 1,5 1,6 1,7 1,8 1,9 2,0 MPD [mm] R R C f o r aver ag e o f t h e t h ree t est t ir es
Figure 6.4: Rolling resistance coefficient RRC plotted against macrotexture (MPD) for measurements in 2009 and 2010. All data for 80 km/h and averaged for all three test tires (Figure 6.2) have been put together without distinction.
The next figure (Figure 6.5) reveals at least part of the problem. In this diagram, data have been analyzed and plotted separately for each measurement series. By a measurement series is meant a set of measurements at similar temperatures covering one or two consecutive days. In such cases calibrations are the same for all measurements within the series. Note that the two points in the upper right corner are for a chip seal (in two different tracks) which had some potholes and were measured at temperatures near freezing point. It appears that there is an excellent and reproducible relation between RRC and MPD; i.e. that the rolling resistance pavement effect is largely caused by macrotexture, and/or perhaps something which is very closely correlated with macrotexture. The latter may be mega-texture.
Another observation is that the measurements are influenced by a biasing factor with high influence, related to something which is unique for the series of measurements. One such parameter may be ambient temperature (or pavement or tire temperatures, but they have been shown to be highly correlated with each other). There are some temperature diffe-rences here which can explain some of the bias, but not all of it. These results are not shown here as it is yet not known what appropriate RRC-temperature relations might be and not all data have been analyzed in this way yet. Future analyses and planned measurements will hopefully shed some light on this.
![Figure 3.2: Ranges in terms of texture wavelength and spatial frequency of texture and unevenness and their most significant, anticipated effects; from [Sandberg & Ejsmont, 2002]](https://thumb-eu.123doks.com/thumbv2/5dokorg/4931433.135754/12.892.154.738.274.650/figure-wavelength-frequency-unevenness-significant-anticipated-sandberg-ejsmont.webp)
![Figure 4.2: Correlation between fuel consumption per km and road roughness/texture level as a function of texture wavelength [Sandberg, 1990]](https://thumb-eu.123doks.com/thumbv2/5dokorg/4931433.135754/18.892.144.724.275.616/figure-correlation-consumption-roughness-texture-function-wavelength-sandberg.webp)
![Figure 4.4: Correlation between RRC (C r ) and road roughness/texture level as a function of texture wavelength [Descornet, 1990]](https://thumb-eu.123doks.com/thumbv2/5dokorg/4931433.135754/20.892.145.741.191.619/figure-correlation-roughness-texture-function-texture-wavelength-descornet.webp)