Till min älsklingar
Abdul Rahim, Sarah och Nurin
List of Papers
This thesis is based on the following papers, which are referred to in the text by their Roman numerals.
I N. Azlinda Ahmad, M. Fernando, Z.A.Baharudin, M. Rahman,
V.Cooray, Ziad Saleh, Joseph R. Dwyer, Hamid K. Rassoul, (2010).The first electric field pulse of cloud and cloud-to-ground lightning discharges. Journal of Atmospheric and Solar Terrestrial Physics, 72, 143 – 150, 2010.
II N. Azlinda Ahmad, Z.A. Baharudin , M.Fernando, V.Cooray.
Radiation field spectra of long-duration cloud flashes. Submit-ted to IEEE Transaction on Electromagnetic Compatibility (EMC), March 2011.
III N. Azlinda Ahmad, M. Fernando, Z.A.Baharudin, V.Cooray,
Ahmad. H., Abdul Malek , Z., The characteristics of Narrow Bipolar Pulses in Malaysia. Journal of Atmospheric and Solar Terrestrial Physics, 72, 534 – 540, 2010.
IV N. Azlinda Ahmad, Z.A.Baharudin, M. Fernando, V.Cooray,
Some Features of Electric Field Waveform of Narrow Bipolar Pulses. Submitted to Special Issue, Journal of Atmospheric Discharge, January 2011. Part of this work has been presented in the International Conference of Lightning Protection (ICLP), Cagliary, Italy, 2010.
Other contributions of the author, not included in this thesis
V N. Azlinda Ahmad, M. Fernando, V. Cooray. On the
deriva-tives of Narrow Bipolar Pulses. In: Proc. International Confer-ence of Lightning Protection (ICLP), Cagliari, Italy, 2010. VI Z.A. Baharudin, N. Azlinda Ahmad, M. Fernando, V. Cooray,
J.S.Mäkelä, Comparative study on preliminary breakdown pulse trains observe in Malaysia and Florida. Submitted to Special Is-sue, Journal of Atmospheric Discharge, January 2011.
VII Z.A.Baharudin, N. Azlinda Ahmad, M. Rahman, V. Cooray, M. Fernando, J.S.Mäkelä, H. Ahmad, Z.A. Malek. Features of lightning flashes observed in Malaysia. Submitted to Journal of Atmospheric and Solar Terrestrial Physics.
VIII Z.A.Baharudin, N. Azlinda Ahmad, M. Rahman, V. Cooray, M. Fernando, J.S.Mäkelä, H. Ahmad, Z.A. Malek. Negative cloud to ground lightning flashes in Malaysia. In manuscript. IX Mahbubur Rahman, Vernon Cooray, N. Azlinda Ahmad, Johan
Nyberg, Vladimir A. Rakov and Sriram Sharma, 2008. X rays from 80-cm long sparks in air, Geophysical Research Letters, vol. 35, L06805, doi: 10.1029/2007GL032678.
X Z.A. Baharudin, M. Fernando, N. Azlinda Ahmad, M. Rah-man, V. Cooray, J.S. Mäkelä, Slow field changes features prior the first return stroke observed in Malaysia. Submitted to Jour-nal of Atmospheric and Solar Terrestrial Physics.
XI M.A. Salam, Hussein B. Ahmad, N. Azlinda Ahmad, Ngai Jien Sien, 2010. Characteristics of Electric and Magnetic Fields in the vicinity of a quadruple Electric Power, International Journal of Emerging Electric Power Systems, 11 (2), art. 8, doi: 10.2202/1553-779X.2301.
Contents
Outline of the thesis ...10
1. Introduction...11
1.1 Types of lightning ...13
1.2 Objectives of the thesis ...14
2. Data and measurement...16
2.1 Parallel flat plate antenna ...16
2.2 Electronic circuit ...18
2.3 High Frequency antenna...20
2.3.1 3 MHz tuned circuit ...20
2.3.2 30 MHz tuned circuit ...22
2.4 Measuring sites...25
2.4.1 Vero Beach, Florida ...25
2.4.2 Universiti Teknologi Malaysia, Johor, Malaysia ...26
2.4.3 Uppsala, Sweden...28
2.4.4 Colombo, Sri Lanka ...31
3. Types of cloud processes ...32
3.1 Cloud flashes (ICs)...32
3.2 Narrow Bipolar Pulses (NBPs)...34
4. High frequency radiation from lightning ...37
4.1 Overview ...37
4.2 Frequency spectrum of lightning electromagnetic fields ...41
4.3 Possible causes of HF radiation from lightning ...43
5. Results and discussions...44
Paper I ...44 Paper II ...45 Paper III...47 Paper IV ...49 6. Concluding Remarks...51 Svensk sammanfattning ...53 Acknowledgements...55
Bibliography ...57 Appendix A...62 Appendix B ...64
Abbreviations
CGs Cloud to ground flashes
FWHM Full Width at Half Maximums
dE / dt Electric field time derivatives
HF High frequency
ICs Cloud flashes
kHz Kilo Hertz
MHz Mega Hertz
NBPs Narrow Bipolar Pulses
NNBPs Narrow Negative Bipolar Pulses
NPBPs Narrow Positive Bipolar Pulses
RF Radio frequency
RS Return strokes
RT Rise time
UHF Ultra high frequency
UTM Universiti Teknologi Malaysia
VHF Very high frequency
Outline of the thesis
The thesis is based on four papers and divided into six chapters. The first chapter (Chapter 1) gives an overview of the lightning process, the objec-tives and outline of the thesis.
Chapter 2 deals with the data and measurement set up.
Chapter 3 provides some theoretical background of cloud flashes. A general overview of the NBPs is discussed under different subsections in Chapter 3. Chapter 4 deals with the high frequency radiation from lightning. The main objective in Chapter 4 is to provide some ideas of how lightning radiates at high frequency (HF) and what could be the possible HF sources.
Chapter 5 summarizes the papers which this thesis is based on. The conclu-sion of this thesis work is addressed in Chapter 6.
Nomenclature: In this thesis and in Papers I and II, the positive electric field change at ground level is defined in terms of the displacement of negative charges downward and positive charges being raised upward, similar to the electric field change of negative return strokes. For Papers III and IV, the definition is the opposite. Further the word ‘discharges’ and ‘flashes’ will be used interchangeably to address the lightning process.
1. Introduction
Lightning is perhaps the most powerful display of electrostatics in nature and is inescapable from humankind's attention. They are never invited, never been planned for and have never gone unnoticed. The rage of a lightning strike will wake a person in the middle of the night. The fury of a lightning strike is capable of interrupting midday conversations and activities. People will crowd around windows to watch the lightning displays in the sky, stand-ing in awe with the power of static discharges.
Figure 1 Benjamin Franklin’s kite experiment proved the electrical nature of
light-ning (Adapted froma)
More than 250 years ago, Benjamin Franklin’s idea that lightning is an elec-trical discharge in nature has opened a pioneering research field in lightning. Since then, our knowledge of the lightning phenomena has advanced greatly. Among the remarkable breakthroughs of lightning research are the electro-static field measurements from lightning, which has confirmed the appear-ance of positive electric dipole inside the thunderclouds77 and the use of
cathode–ray oscillographs to record and investigate lightning discharges49.
Furthermore, the invention of the streak camera8 which was used extensively in the lightning study by B.J.F Scholand, D.J Malan and their colleagues in South Africa in 1930s, has contributed significantly to our understanding of lightning. It is often believed that the revolution of lightning research began in the early nineteenth century although some significant work has been carried out in the latter half of the nineteenth century65. Modern
measure-ments of lightning research can be divided into five categories65: i) spectroscopic measurement
ii) electric current measurement iii) photographic
iv) electric and magnetic field measurement v) acoustic measurement
Tremendous advancements in instruments and measuring techniques have helped in comprehending the characteristics of lightning. Lightning can be detected either from the ground or space. Examples of lightning detection from the ground are Time of Arrival (TOA), magnetic direction finding and interferometry. The interferometry technique introduced by Proctor50 is
pref-erably used to achieve higher resolution observations and has been widely employed in lightning observations and detections 2, 20, 58, 60, 64. From space,
lightning can be detected by using satellites or imaging sensors (LIS). How-ever, no differences between the lightning types (cloud or ground dis-charges) can be distinguished.
Even though lightning measurement spans a wide range of studies, the main objective of this thesis work is to focus only on remotely measured electric field from lightning. This is mainly due to the practical limitations of other techniques and the random nature of lightning. A great deal of useful infor-mation can be obtained by analyzing the broad band and narrow band radia-tion fields generated by lightning. In this thesis, features of broad band elec-tric field radiation of cloud flashes and narrow bipolar events together with the associated HF radiation at 3 MHz and 30 MHz are studied. The data were recorded in the temperate, tropical and subtropical regions.
1.1 Types of lightning
Lightning can be divided mainly into two types namely, cloud to ground discharges (CGs) and cloud flashes (ICs). Rare forms of lightning such as blue jets, red sprites and elves have been also documented. When lightning strikes the ground or a grounded object, it is called a ground discharges (CGs). There are four types of CGs:
i) Upward negative lightning ii) Upward positive lightning iii) Downward negative lightning iv) Downward positive lightning
The downward negative lightning transports negative charges from the main negative charge center to ground and account for 90 % of ground dis-charges51. The other 10 % of ground discharges are downward positive
lightning which transport positive charges to ground from the main positive charge center. Even though positive CGs constitute only 10 % of the dis-charges, they are always associated with the highest peak current (~300 kA) and largest charge transfers to ground (hundreds of Coulombs)53. Upward
lightning, as opposed to the downward lightning typically occur due to the presence of tall objects or structures (more than 150 m) and hence can be considered to be initiated by the object itself. According to Berger, (1978, in Rakov and Uman53) this type of flashes has been observed to transport more
often negative charges than positive charges to ground.
Figure 2 Electric charges distribution inside a thundercloud and the location of
where lightning can occur (Adapted from Brittanica onlineb).
If the discharges happen inside a thundercloud or between thunderclouds, the terms intracloud flashes or cloud flashes (ICs) are typically used. Cloud dis-charge is the most common of all types of lightnings. Further explanation of cloud discharge is given in Chapter 3 and is also discussed in Paper I and Paper II. Despite ordinary cloud flashes, there is another type of cloud dis-charge known as Narrow Bipolar Pulses (NBPs). Narrow bipolar pulses (NBPs) are intracloud events with higher peak amplitude and strong high frequency emission compared to the first return strokes and other intracloud discharges. Among their main features are:-
a) High altitude discharges~ Their main location is at 15 km to 20 km altitude for NNBPs and at 7 km to 14 km altitude for NPBPs38,47,80 b) Shorter pulse duration typically within 10 µs to 30 µs34, 44, 57. c) Accompanied by powerful radio frequency (RF) emission27,38,47, 62 d) Emit weak or almost no optical emission27
Even though some studies attempted to explain the NBPs discharge using the runaway breakdown mechanism24, 25 the knowledge on the physical
mecha-nism of NBPs is still limited and remains unsolved to the lightning commu-nity. Details of these pulses are given in Chapter 3 and also discussed in Paper III and Paper IV.
1.2 Objectives of the thesis
Lightning is known as the most fascinating natural discharge on earth. Great advances in our modern communication systems (for instance wireless, sat-ellite, antenna, radio transmission), avionics and electronics industries, has raised a demand for progressive lightning research work. While some parts of this discharge processes have been successfully understood, scientists are still struggling to find the answer to the question, ‘What initiates lightning?’ This is an interesting question as the mechanism and initiation processes themselves remain popular subjects of debate. It is thus essential to have a good knowledge regarding the initiation process of the lightning.
The main objectives of this thesis work are:
1) To study the initiation process of cloud flashes (ICs), ground flashes (CGs) and narrow bipolar pulses (NBPs) by analyzing the broadband electric field radiations. Understanding the initiation mechanism of the in-cloud process is vital considering that this is the part which has been a subject of debate for years. In addition to this, the study
of the initiation process is essential in order to understand the phys-ics behind in-cloud discharges.
2) To study the radiated high frequency (HF) emission at 3 MHz and 30 MHz associated with ICs and NBPs. Having both, the knowledge and the understanding, of how ICs and NBPs radiate at HF and how this HF radiation coupled with the electronics systems are important. This is because our communications, radio and TV broadcasting, satellites, avionics systems and some microelectronics integrated component systems are working in this HF range. Using the infor-mation from the HF radiation from lightning discharges, better lightning protection for the above systems can be developed.
2. Data and measurement
This chapter describes the experimental setup, devices, location and measur-ing techniques. For this thesis work, data was based on the measurements carried out at four different locations: Vero Beach in Florida, Uppsala in Sweden, Colombo in Sri Lanka and Johor in Malaysia.
2.1 Parallel flat plate antenna
Figure 3 Illustration of the ground based electric field measurement set up.
Electric field intensity at the ground can be measured as a function of time by measuring the voltage between the upper plate of the antenna and the ground. In the case of parallel flat plate antenna systems, as shown in Figure 3, the wavelength of the electric field is much larger than the dimension of the antenna. This condition is necessary otherwise the current induced in different parts of the antenna will reach the electronic circuitry at different times12. By considering that there are no other metallic objects that might
influence the electric field to be measured, the voltage that drives the an-tenna is given by:
)
(
)
(
t
h
E
t
V
eff [1]where heff is the effective height of the antenna and E(t) is the electric field
to be measured. The effective height depends on the antenna geometry and its physical height. The effective height of the antenna is approximately 0.25 m and the physical height is 1.5 m.
Figure 4 Flat plate antenna with associated electronic circuits used for the electric
field measurement (Adapted from Uman64).
When the measuring circuit is attached to the antenna, the output voltage, v as depicted in Figure 4 will depend on the decay time constant, RC of the circuit. If RC = then the output voltage corresponds exactly with the driv-ing voltage. In this case the output voltage has the same temporal develop-ment as the background electric field. The antenna circuitry used is similar to those described and used previously by Cooray and Lundquist16, 17, Cooray and Pérez15, Arthuro and Fernando3, Sharma et al.56 and Sonnadara et al.64.
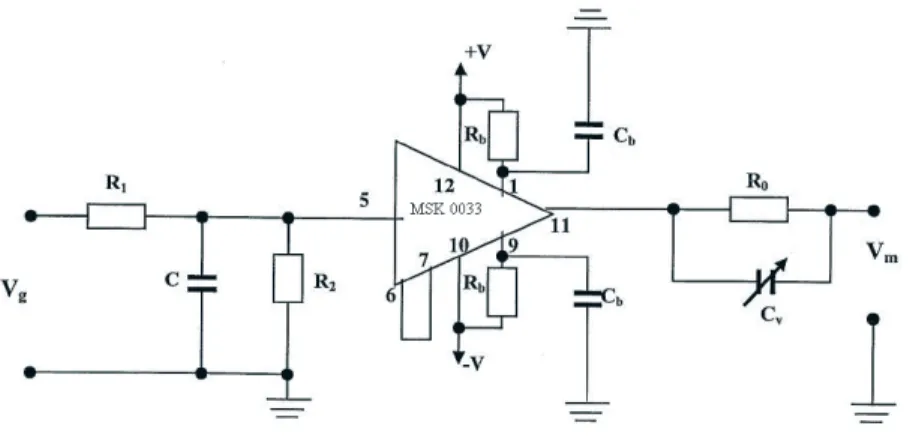
2.2 Electronic circuit
The electric circuit attached to the antenna system consists of an MSK 0033 buffer amplifier, capacitors and resistors. The purpose of using a buffer am-plifier is to isolate the high input impedance of the antenna and offer enough power to drive the signal from antenna to the oscilloscope through the coax-ial cable. The input impedance of MSK0033 is 1012 .
Figure 5 Circuit diagram of buffer amplifier (Adapted from Cooray12)
The components used in the electronic circuit of Figure 6 above are the fol-lowing:
R1 = 50 , C = 15 pF – 10 nF (depends on the fast or slow field
require-ment), R2 = 100 M , Cb = 0.1 pF, Cv = 10 pF – 60 pF and Ro = 43 . The
output resistance of the buffer amplifier is 7 , therefore the total output resistance, ROT is 50 (Ro + 7 ).
The antenna capacitance, Cg was in the range of 58 pF to 60 pF. However, a
value of 59 pF has been used as the standard value of the antenna capaci-tance and in decay time calculation. Cc is the capacitance of the RG 58
coax-ial cable (100 pF for 1 meter length coaxcoax-ial cable). The value of Cc may vary
according to the length of the coaxial cable used to connect the lower plate of the antenna to the input of the electronic circuit. Also, Cc is one of the
parameters responsible for controlling the magnitude of the measured volt-age. The high resistance, R2 is used to control the decay time constant of the
circuit, d according to the equation below: C C C R g c d 2 [2]
The value of R2 was selected such that the decay time constant of the
meas-uring system was large enough to record the impulse signal generated by cloud and ground discharges. Typically the value of d is 10 ms for the ra-diation field measurement and 1 s or more for the static (slow) field meas-urement.
In order to determine the measured voltage of the antenna system, some factors of the electronic circuit from the capacitive divider and the resistive divider has to be considered. Therefore equation [1] is modified like so:
m oT T o c g g eff m
R
R
R
C
C
C
C
t
E
h
V
(
)
[3])
22
.
0
)(
(
50
50
50
15
60
59
59
)
(
h
E
t
pF
pF
pF
pF
t
E
h
V
m eff eff [4] where:Rm (matching resistor for coaxial cable connection) = 50
Vm = measured voltage
(Nomenclature: The antenna has been calibrated by applying a known verti-cal electric field to the antenna. Then, the output voltage between parallel
plates and the effective height of the antenna were measured taking into ac-count the electronic circuit attached to the antenna.)
2.3 High Frequency antenna
2.3.1 3 MHz tuned circuit
An inductance of 47 µH connected in series with the antenna capacitor and 50 ohm termination formed a simple RLC circuit. The resonance frequency is 3 MHz with the experimental bandwidth of 264 kHz. An equivalent circuit of the 30 MHz resonator is shown in Figure 7, while the experimental results of the circuit’s response are shown in Figure 8 and Figure 9, respectively. See Appendix A for details of series RLC circuit.
Figure 7 The equivalent circuit of 3 MHz tuned circuit
Figure 8 Output response of 3 MHz resonator circuit when 5 Vp-p input pulse
volt-age (from signal generator) was applied.
2.3.2 30 MHz tuned circuit
The electronic circuit of 30 MHz circuit, the diagram and the circuit’s re-sponse are shown in Figure 10, 11, 12 and 13 respectively. The components used in the circuit are: high speed buffer LHM6609, operational amplifier LHM6599, R1 = 1 k , R2 = 18 , R3 = 27 k , C1 – C4 = 6 pF, C5 and C6 =
10 pF.
Similar to the antenna system, the high speed buffer LHM6559 is used in this circuit to isolate the high input impedance of the antenna and to deliver a stable signal to the filter circuit. The input resistance is 200 k while the output resistance is only 1.2 . The output of the high speed buffer is con-nected to the input of voltage feedback operational amplifier. The purpose of operational amplifier (op-amp) used in the 30 MHz circuit is to amplify (in-crease) the weak input signal. LHM6609 is a type of operational amplifier used in this 30 MHz band pass filter circuit. See Appendix B for circuit’s detail.
Figure 11 An equivalent band-pass filter circuit for 30 MHz resonator
Figure 12 Output response of 30 MHz resonator circuit when 5 Vp-p pulse voltage
(from signal generator) was applied.
LHM6609
V
oFigure 13 The output response of 30 MHz tuned circuit as a function of frequency
In order to check the output response from the resonator circuit (for both 3 MHz and 30 MHz), a 5 Vp-p input voltage from the signal generator was applied. The antenna capacitance was replaced by a 59 pF capacitor. The theoretical, experimental and simulation values of 3 MHz and 30 MHz are tabulated in Table 1.
Table 1 Theoretical and experimental values for the oscillator circuit at 3 MHz and
30 MHz
Tuned Frequency (MHz) Bandwidth (kHz)
Theory Experi-mental
Simulation Theory Experi-mental Simulation 3 3 3.02 169 264 170 30 31 33.14 1965 2020 1900
Frequency (Hz)
Amplitud
e (
dB)
fo = 33.14 MHz
2.4 Measuring sites
Figure 14 Measuring sites located in Malaysia (Johor), Sri Lanka (Colombo),
Flor-ida (Vero Beach) and Sweden (Uppsala).
2.4.1 Vero Beach, Florida
The measurement was done at the premises of Vero Beach Marine Labora-tory, Florida (27°N, 80°W), owned by the Florida Institute of Technology. The measuring site is located close to the sea and antennas were placed about 200 m from the sea wall. Data obtained in Florida were presented in Paper I. Vero Beach Florida Colombo Sri Lanka Johor Malaysia Uppsala, Sweden Measuring sites
Figure 15 Measurement site in Vero Beach Marine Laboratory, Florida.
A flat plate antenna was used to sense the signal from the vertical electric field. The output signal was fed into four channel digital transient recorders (Yokogawa DL1640L) operating at 12-bit using 25 m long coaxial cable (RG 58) and properly terminated to avoid reflections. Antenna and measur-ing systems were distanced from each other to avoid disturbances. Addition-ally, all measuring equipment was kept in a control room. The decay time constant of the fast field antenna system was adjusted to 10 ms. Data cap-tured was 160 ms in length with 40 ms pre-triggered mode and the distance of events was estimated based on time to thunder.
2.4.2 Universiti Teknologi Malaysia, Johor, Malaysia
Data published in Papers III and IV were obtained during a lightning meas-urement campaign from April to June 2009 in Johor, Malaysia. The state of Johor is located at the southern tip of Peninsular Malaysia (1°N, 103°E), close to the equator. The measuring site was situated on top of a hill, in the vicinity of the observatory building, a premise belonging to Universiti Teknologi Malaysia (UTM). The site is 132 m above sea level and approxi-mately 30 km away from the Tebrau Straits. Since the measuring site is lo-cated rather close (2 km) to the wireless communication tower, there were significant disturbances between the range of 500 kHz to 1500 kHz, corre-sponding to AM broadcasting in the medium wave radio band. Moreover,
disturbances may also arise from multiple stations transmitting in Malaysia, Singapore and Indonesia, since they are in proximity to each other. In order to minimize the effect of background noise, all data were first passed through the third order high pass filter using a MATLAB@ computer
simula-tion before conducting any further analysis. No addisimula-tional filter circuit was connected to the antenna system. Three flat plate antennas were used to sense the vertical electric field, 3 MHz and 30 MHz signal. All antennas were placed side by side to each other, with the distance between antenna being 1 m each, and were set 8 m from the control room where the recording systems were kept. The decay time constant of the fast field antenna system was adjusted to 500 µs. The data were captured with 10 ns sampling time with a total record length of 250 ms. Moreover, each record contained a 100 ms pre trigger delay.
Infra-red images (IR) from the multifunction transport satellite (MTSAT), together with the accumulated rainfall data from radar observations provided by the Malaysian Meteorological Department (MMD), were used in Papers III and IV to estimate a rough distance to the flashes. Even though informa-tion on the locainforma-tion of lightning could not be obtained from the IR images, they could at least provide the study with a clue to the location of the thun-dercloud. For measurement in Malaysia, only flashes recorded on the 19th and 28th of April 2009 were selected for analysis as they were emitted by a very isolated thundercloud located 50 km (inland) from the measuring site. Therefore it was assumed that flashes on these days came from a range of 50 km.
Figure 16 Measurement site close to the observatory building
2.4.3 Uppsala, Sweden
In Sweden, the measurements were performed during the summer from June to August, 2010 in the vicinity of the Ångström Laboratory, Uppsala Univer-sity, Sweden (59° N, 17°E). The measuring base station was located about 100 km inland from the Baltic Sea. All the measuring equipment was placed inside a stationary van, ten meters away from the High Voltage Laboratory. The inner body of the van was half-covered with an aluminum metal plate and was fully grounded. Two parallel plate antennas used to measure the 3 and 30 MHz radiation were symmetrically installed on the roof of the van while another parallel flat plate antenna used to sense the vertical electric field radiation (far field) was placed approximately 2 meters away from the van. Disturbances from the electronic devices and recording apparatus placed inside the van were minimized since all the measuring equipments were battery-powered. A long vertical antenna was used to measure the slow field signal and placed equally about 2 meters away from both the van and the radiation field antenna. Signals from flat plate antennas were fed into a four-channel, 12-bit resolution digital transient recorder (Yokogawa SL1000 equipped with DAQ modules 720210). The transient recorder was operating at either a 50 ms or 100 ms pre-trigger delay with a 100 MHz or 50 MHz sampling rate. The measuring window was adjusted to record signals at ei-ther 250 ms or 500 ms, depending on the sampling rate chosen.
Plate antennas
Vertical antenna
The distance for data collected in Uppsala was estimated based on time to thunder. Based on this estimation, it was found that the distance to flashes in Paper II was in the range of less than 20 km where the shortest distance was approximately 1.4 km while the maximum distance was 16.4 km.
Figure 17 Measurement set up in Uppsala, Sweden showing a stationary van with
two parallel plate antennas mounted on it. The recording apparatus are placed inside the van
Figure 18 Parallel plate antenna with buffer amplifier circuit attached to record
vertical radiation field
2.4.4 Colombo, Sri Lanka
In Sri Lanka, the measurement was performed during the monsoon period in April, 2010 in the campus of Colombo University (6°54 N 79°54 E). The vertical electric field and dE / dt of lightning were measured using two paral-lel flat plate antennas.All antennas were placed side by side, with a distance of 1 meter, and approximately 20 meters from the control room where the recording systems were kept. A 60 cm long coaxial cable (RG 58) was used to connect the antenna and electronic buffer circuit. The rise time of the fast antenna system for step input pulses was less than 30 ns while the decaying time constant was 13 ms. Signals from flat-plate antennas were fed into two four channel digital transient recorders (12-bit Yokogawa DL1640L) using 25 m long RG 58 coaxial cable and properly terminated to avoid reflections. The oscilloscope operated at a sampling rate of 100 MS/s has been set to work at either 50 or 125 ms pre-trigger with window triggering mode, so that flashes with both polarities will be captured. Unfortunately no reliable in-formation of the distance was available. Data recorded in Sri Lanka is pre-sented in Paper IV.
In all measuring sites, the wide-band electric field recording system was operated at a -3 dB bandwidth of 33 MHz, while the oscillators tuned to 3 MHz and 30 MHz were operating at a -3 dB bandwidth of 264 kHz and 2020 kHz, respectively.
3. Types of cloud processes
In this chapter, an overview of cloud flashes (ICs) and Narrow Bipolar Puls-es (NBPs) with the possible mechanism are discussed.
Nomenclature: The ‘physics’ sign convention is used in this chapter where the electric field change at ground level due to downward displacement of negative charges is considered positive. It has to be noted that the sign con-vention used in this chapter is not the same as the sign concon-vention used in Papers III and IV.
3.1 Cloud flashes (ICs)
Almost three quarters of lightning flashes do not involve ground strikes52. They merely redistribute charges between charge centers within the cloud. In general, this type of lightning flashes is known as cloud flashes (ICs) and they can be divided into three categories:
(a) Intracloud discharges - occurs within the confines of thunderclouds; (b) Intercloud discharges – occurs between one thundercloud and another; and
(c) Air discharges – occurs between thundercloud and air.
However, the characteristics of these three types of lightning flashes cannot be distinguished. As a result, the above three types are commonly recognized as cloud flashes. Unlike CGs, they were considered to be of no direct harm to the human beings and animals on ground or to other structures52.
Never-theless, even though they are of minimal danger to ground based objects and systems, ICs are of much concern for the avionic industries. The interference of HF and VHF radiation with ICs and other sophisticated solid state devices are also of great concern in lightning protection.
The breakdown process in ICs has been studied since the early 1930s in or-der to unor-derstand the lightning initiation mechanism. Even though over 90% of lightnings account for ICs, they are not well-studied like their counterpart,
CGs. Difficulty of visual observations, inability to measure the ground based current and difficulty in locating the flashes are several reasons as to why ICs are less studied. Considering this, remote measurements of electric field radiation serve as a good tool for studying ICs.
ICs are most likely to be initiated near the upper and lower boundary of the main negative charge center and often in the former case bridge the main negative and main positive charge regions in the thundercloud. A classical work pertaining to cloud flashes was carried out by Kitagawa and Brook31.
By analyzing electric field variations from ICs, they concluded that ICs con-sist of three stages: initial, very active and junction. Later, studies conducted by numerous authors 5, 16, 17, 34, 59, 67, 70 showed that ICs consist of only two
stages: an early (active) stage and a later stage. The early stage takes place during the first 40-ms of the flash67, while the remainder of the flash
consti-tutes the later stage. As has been reported by Cooray12, the typical duration
of ICs may range from 200 ms to 500 ms. Examples of radiation fields from ICs are shown in Figures 20 and 21. Further discussions on ICs can be found in Paper I and Paper II.
(b)
Figure 21 The electric field radiation from positive polarity cloud flashes
3.2 Narrow Bipolar Pulses (NBPs)
Narrow Bipolar Pulses (NBPs) or also known as compact intracloud dis-charges (CIDs) 62 can be singled out from other lightning processes due to
their association with strong radio frequency (RF) radiation. They have also attracted considerable attention because they are a primary candidate for proposed satellite-based VHF global lightning monitors69. They have been reported with positive and negative polarity, namely, Narrow Positive Bipo-lar Pulses (NPBPs) and Narrow Negative BipoBipo-lar Pulses (NNBPs).
Figure 22 Example of a typical electric field of narrow positive bipolar pulses
(NPBP – according to physics sign convention) observed in this thesis work.
NBPs were first reported by Le Vine34 and later, various studies of these
distinct pulses were conducted either by using broadband electric field 43, 44, 57,74 or satellite based measuring systems 18, 27, 28, 62, 69. In most cases, they
were reported as isolated events without being preceded or followed by other known lightning activity within a time frame of tens of milliseconds57, 62.
However, some studies found that NBPs are associated with the initiation of other intracloud discharges 27, 28, 44, 54. As reported by Jacobson27, other
activi-ties may occur before, during or after NBPs within a fraction of the time interval. Electric field waveforms similar to those of Le Vine34 have also
been observed by Weidman and Krider70, Cooray and Lundquist17, Bils et
al.5 and Villanueva et al.67. However, their findings showed wider duration
bipolar pulses than that observed by Le Vine34. LeVine34 in his measurement
used RF radiation at 3 MHz and 300 MHz as a triggering source with the bandwidth set to 300 kHz. Bils et al.5 reported a bandwidth from 3 Hz to 4
MHz with a recorded distance of 10 km while Cooray and Lundquist17
re-ported a bandwidth between 10 kHz to 600 kHz. It is possible that the differ-ence observed is due to the different nature of the experiment and methods of observations used in different studies. In addition, the result reported by Cooray and Lundquist17 might have been attenuated since the signals were
NBPs were commonly observed in the tropical region compared to the tem-perate region. Sharma et al.57 failed to record any narrow bipolar activities in
Sweden whereas the same experimental set up carried out in Sri Lanka, a tropical region, recorded numerous records of positive bipolar events. Simi-larly, as reported in Paper III of this thesis work, NBPs were frequent during our measurement in Johor, Malaysia. Even though it was speculated that meteorological conditions57 might influence the presence of NBPs in tem-perate regions, one has to carry out further investigations to confirm their existences. This is because it is not known with certainty whether the ab-sence is due to the atmospheric condition or the properties of thunderclouds analyzed in earlier studies. Therefore, until a specific measurement for NBPs is executed, we are not in the position to comment on the absence of NBPs in the temperate region.
In addition to this, positive NBPs were reported to occur at an altitude of 6 km – 15 km and at a higher altitude which is 15 km – 21 km for negative NBPs 38, 47, 80. In most cases NBPs were reported to occur singly, without being preceded or succeeded by any other known lightning activity within a time frame of tens of milliseconds57, 62. However, in present study they were observed to be associated with the initiation of intra-cloud discharges. Un-like other lightning processes, they were also reported to occur without the formation of leaders18.
Further results and discussions on NBPs are presented in Paper III and Paper IV. It should be noted that even though NBPs were suggested as probably being initiated by a runaway breakdown mechanism23 and it has been
specu-lated as a bouncing wave phenomenon45, at present the mechanism of these
4. High frequency radiation from lightning
This chapter covers some previously published works on HF and VHF from ICs. It is composed into 3 main sub sections: general overview of HF radia-tion from lightning discussed in 4.1, frequency spectrum of lightning elec-tromagnetic fields discussed in 4.2 and possible causes of HF radiation from lightning discussed in 4.3.
4.1 Overview
Electromagnetic radiation from lightning is characterized by a broadband frequency in the range of kHz to GHz. It is essential to study the high fre-quency radiation from lightning due to its adverse interference with ad-vanced electronics devices during thunderstorms. Recently, there has been a lot of interest in the strong emissions produced by lightning at UHF and VHF frequencies. This is because lightning emission is impulsive and the large amplitude represents a potential hazard to any system which is sensi-tive to a transient field7.
Many studies have been performed to understand the temporal HF
radiation from lightning.
Le Vine and Krider36 reported the temporalvaria-tion of HF from the first and subsequent return strokes at several selected frequencies which are 3, 30, 129 and 295 MHz. Krider et al.32 show the
tem-poral variation of HF radiation at 3, 69, 139 and 295 MHz for large ampli-tude intra-cloud pulses. Clegg and Thomson10 reported the HF radiation at
10 MHz that is associated with cloud and ground flashes in Suva Fiji. Simi-lar HF radiation at 10 MHz was also documented by Hayenga26 using
inter-ferometric technique and the data were recorded within a distance of 3 km to 10 km. Cooray11 reported the temporal variation of HF radiation at 3 MHz, near the time of the first return strokes. Data were recorded within a 50 km to 100 km distance and propagating over sea water. The HF radiation at 3 MHz during the leader and return strokes process has been studied by Jayaratne and Cooray30. Data were collected in Sri Lanka at a distance of
approximately 40 km over sea water. The stepping process preceding the first return strokes was observed to be responsible for the strong HF emis-sion at 3 MHz while similar HF radiation was absent during the subsequent return strokes process. Cooray and Perez15 observed longer duration of 3
MHz radiation associated with positive return strokes than that of negative return strokes. Shao et al.61 have further investigated the HF radiation from
the positive return strokes. Their study which was extended up to the UHF region showed that the positive ground flash emits less or no radiation par-ticularly at the VHF region. Direct measurement by using narrow band tech-niques was reported by Mäkelä et al.40. The narrow band receiver tuned to 10
MHz to capture radiation from chaotic pulses associated with subsequent return strokes. Leaders preceding first return strokes emit substantially less HF radiation than during the first return strokes (return strokes are however the most prominent HF emitter) while the leader preceding subsequent return strokes emit weak or no HF radiation at all. Also, it was observed that the radiation intensity will increase with the presence of chaotic pulses that are typically observed preceding the subsequent return strokes.
There are only few observations and studies of HF radiation from NBPs compared to cloud discharges and return strokes. According to Smith et al.62 the mean duration of HF emission (3 MHz to 30 MHz) associated with NPBPs is 2.8 µs and the amplitudes 10 times larger than emissions from ordinary cloud flashes or return strokes. Furthermore, observations by Ri-son52 have confirmed that the strong emission produced by NPBPs was 30 dB stronger than that of other lightning processes such as ICs and CGs with-in the same storm. Examples of broadband radiation field of cloud flashes with corresponding 30 MHz and 3 MHz radiation measured in this study are shown in Figures 23, 24 and 25, respectively. Meanwhile examples of broadband radiation field of NBPs with corresponding 30 MHz and 3 MHz radiation are shown in Figures 26 and 27.
Figure 23 Typical electric field waveform of ICs obtained from broadband electric
Figure 24 Typical electric field waveform of ICs obtained from broadband electric
field measured simultaneously with 3 MHz and 30 MHz within 40 to 80 ms interval.
Figure 25 Typical electric field waveform of ICs obtained from broadband electric
field measured simultaneously with 3 MHz and 30 MHz within 80 to 120 ms inter-val.
Figure 26 An NPBP with the corresponding 30 MHz radiation shown in (a) and (b),
respectively. Similarly, an additional NNBP with its corresponding 30 MHz radia-tion is shown in (c) and (d), respectively.
Figure 27 An NPBP and its associated HF radiation at 3 MHz is shown in (a) and
(b), respectively, while an additional NNBP and its associated HF radiation at 3 MHz is shown in (c) and (d), respectively.
4.2 Frequency spectrum of lightning electromagnetic
fields
In order to analyze the effects of lightning on modern avionic and communi-cation systems, it is necessary to know the properties of the various individ-ual processes during the flash in order to determine how these signals couple with digital circuits48. For that reason, investigation on frequency spectrum of lightning electromagnetic fields has been carried out. Le Vine35 defines “spectrum” as “the magnitude of the Fourier transform of the electric field E (t) radiated during the discharge”. Traditionally, there are two methods used to study the frequency spectrum of lightning flashes. Narrowband oscillators tuned to any interested frequency can be used to directly measure the energy radiated by lightning in that frequency. To obtain the average frequency variation over a large range, one needs a large number of such oscillators tuned to different frequencies. The second method is to obtain the frequency spectrum by Fourier transforming the broadband electric field waveform. This technique was used in Paper II to obtain the frequency spectrum of ICs within the interested frequency range.
Figure 28 Examples of spectral amplitude of the first return strokes using Fourier
transformation technique adapted from Le Vine35.
The broadband frequency spectrum of the first and subsequent return strokes from frequency interval of 1 kHz to 1 MHz was shown by Serhan et al.55.
– 1 within 10 kHz to 100 kHz. Above 100 kHz, the amplitude spectra of the
strokes degrade rapidly with increasing frequency due to the propagation effect. Weidman et al.72 have studied the radiation spectra of return strokes,
stepped leaders and intra-cloud discharges in the frequency range of 100 kHz to 20 MHz. Similar to Serhan et al.55, their result shows that the amplitude
spectra falls off as f -1 for frequency up to 2 MHz and decrease as f – 2 up to
10 MHz. At beyond 10 MHz, the frequency falls off rapidly as f -5. The
fre-quency spectrum of cloud flashes which is closely related to the one de-scribed in Paper II was charted by Sonnadara et al.64. Sonnadara et al.64
ana-lyzed the spectrum of the first 10 ms of ICs, which is the most active stage of cloud flashes67. Their results showed that for frequencies up to 2 MHz, the
spectra follows f -1 frequency dependence and continues with f -2 or higher
for frequencies above 2 MHz.
Figure 29 The amplitude spectra of lightning obtained from direct
meas-urement (narrow band systems) adapted from Le Vine35.
In addition to the spectral amplitude of lightning, some studies have calcu-lated the energy spectral density (ESD) of lightning. ESD is basically the square of the spectra amplitude. Energy spectral density from Narrow Bipo-lar Pulses was reported by Willet et al.74. Being known as the possible source
of the strongest HF radiation from lightning, sources of these pulses radiate much stronger than the first-return strokes at frequencies from 10 MHz to at
least 50 MHz. Also, Willet et al.75 reported the ESD for first, subsequent,
step and dart stepped leaders, chaotic process and characteristic cloud pulses.
4.3 Possible causes of HF radiation from lightning
There are many possible causes of HF radiation from lightning. In an earlier study, Brook and Kitagawa9 suggested that the radiation from lightning is
associated with the formation of streamers. This suggestion was due to their observation of a 60 µs to 100 µs delay between the beginning of the return strokes and the appearance of the strong HF radiation, which are roughly the times required for the current pulses to propagate from ground to cloud. Measurements made by Le Vine and Krider36 confirmed the delay as
ob-served previously by Brook and Kitagawa9. However, they found that the
delay was too short, typically 20 µs, which led them to suggest that branches in the main channel were the primary sources of HF radiation. Later, Coo-ray11 reported that there was actually no such delay and what had been
ob-served previously was due to the propagation effect when electric fields propagate over finitely conducting ground. This report was based on data obtained from measurements close to the sea (200 m from the sea) where the propagation path was entirely over the sea water thus eliminating the possi-ble propagation effect.
On the other hand, calculations done by Le Vine and Meneghini37 inferred that the channel tortuosity of lightning has a significant effect on the high frequency domain compared to the equivalent straight conducting channel and this was later supported by Le Vine33. Cooray and Pérez15 suggested the
ionization of virgin air or the re-ionization of an old channel as a possible significant source of HF radiation. Further, as shown by Cooray and Fer-nando14, charge irregularities and micro scale branches are probably the
source of HF radiation while the channel tortuosity can lead to HF emissions but confined only to the first few microseconds of the return strokes.
5. Results and discussions
The research work presented in the following papers cover different areas of the physics of cloud discharges. The study of the initiation of ICs and NBPs is presented, and the HF radiation associated with them is also discussed.
Paper I
The first electric field pulse of cloud and cloud-to-ground lightning dis-charges
Despite the advancement in lightning research field, there is still little under-standing of the in-cloud process by which lightning is initiated. In general, the initiation of lightning evolves three stages63: (1) the build-up of in-cloud
electric fields on large spatial scales, (2) local enhancement of the electric field to produce regions in which ionizing collisions between accelerated electrons and air molecules result in propagating corona streamers and (3) propagation of sufficient electric current through and beyond the region of very high local fields to form the hot, completely ionized lightning channel (leader stage). There are two possible candidates for which lightning is initi-ated; conventional and runaway breakdown mechanisms. In both hypothe-ses, the process begins with accelerated electrons which lead to electron avalanched through the ionization process.
The electric field intensity needed for the breakdown to occur between paral-lel plate electrodes is approximately 3 MV/m, measured in dry air (760 Torr, 273 k or 0˚C). However, this critical electric field intensity will decrease with decreasing pressure (increasing cloud altitude) and also with the pres-ence of hydrometeors. In situ measurement of electric field sounding inside the thundercloud using aircrafts21, balloons 41, 68, 79 and rocket78 showed that
the maximum electric field inside the thundercloud is always less than the required electric field breakdown in the air. In the runaway breakdown mechanism, the thunderstorm electric fields accelerate the relativistic elec-trons generated by cosmic ray showers to generate relativistic avalanches causing runaway breakdown. It was suggested that the runaway breakdown are responsible for triggering the lightning22. According to Solomon63, the
conventional breakdown mechanism alone cannot trigger the initiation proc-ess, while the runaway breakdown appears to be a likely candidate.
The purpose of this study is to understand the initiation mechanism of cloud and ground flashes. Since the visual observation of cloud flashes is difficult, remote sensing of electric fields provides some valuable information on the initiation of the in-cloud process. A few analyses have been reported by nu-merous authors5, 16, 17, 67, 70 on lightning cloud discharges. From their
analy-ses, it was found that large microsecond scale pulses were typically present at the beginning of the cloud flashes that could be related to the initiation of the breakdown process. Detail analyses of microsecond scale pulses in the first 10 ms of cloud flashes were done by Sharma et al.56 and Bodhika et al.6.
A study by Nag et al.46 on microsecond and sub microsecond scale pulses of ground flashes found that over 70 % of the flashes have pulse durations of less than 4 µs, with 87 % of them being bipolar. Another 22 % have pulse durations less of than 1 µs. Beasly et al.4 showed a significant VHF radiation
at the preliminary variations of electric field records of ground discharges. In all of the above studies no detailed analyses of the initial electric field pulse of cloud and ground flashes were discussed.
On the basis of the broadband electric field measurements, the characteristics of initial pulses from 38 cloud flashes and 101 ground flashes have been analyzed. Our results show that the characteristics of field parameters such as pulse duration, rise time, zero crossing time and full width at half maxi-mum (FWHMs) of the first pulse of cloud and ground flashes are similar. These results were also compared to the microsecond and sub-microsecond scale pulses observed at the later stage of the cloud flashes. It was found that the field characteristics of microsecond scale and sub-microsecond scale pulses were similar to those of the initial pulse of cloud and ground flashes. Hence, it is suggested that a) the mechanism process of the first pulse of cloud flashes is similar to those of at the later stage of the flash and b) cloud and ground flashes are probably initiated by the same mechanism.
Paper II
Radiation Field Spectra of long-duration cloud flashes
Even though cloud flashes pose no threat to human, animals and other struc-tures on the ground, the understanding of HF emission produced by cloud flashes is essential, both for scientific investigation and for engineering as-sessment. Since the intensities of HF radiation from lightning vary consid-erably with frequency, the magnitudes are conveniently decided upon by consulting their spectral amplitude51. However, the study of frequency
spec-trum obtained from cloud flashes is scarcely found in the literature. To date, only a few series of studies on lightning cloud flash spectrum have been published64, 72, 73. Weidman et al.72 reported the amplitude spectra of
individ-ual intracloud pulses in the range of 100 kHz to 20 MHz. Weidman and Krider73 calculated the spectral amplitude of individual intra-cloud pulses from derived electric field time derivatives (dE / dt) of the ground-based electric field measurements while Sonnadara et al.64 have analyzed the spec-trum of electric fields of the initial 10 ms of cloud flashes. Apparently, no study has been conducted to investigate the frequency spectrum of the elec-tromagnetic field produce by a one complete cloud flash and thus, the objec-tive of this study.
For this study, the average spectral amplitudes of cloud flashes have been evaluated using long records of broadband radiation fields. A sample of 22 electric field variations of 180 ms of cloud flashes has been Fourier analyzed to determine their spectrum in the frequency range of 1 kHz to 10 MHz. The result shows that the spectrum decreases with a f -1 dependence within the
entire frequency interval. It was found that at a high frequency band, particu-larly above 2 MHz, the f -1 decrement observed in this study is less steep than
the f – 2 decrement of other lightning processes such as return strokes,
stepped leaders, subsequent return strokes and individual intra-cloud pulses. In fact, our spectrum is inconsistent with the frequency spectrum of the 10 ms active stage of cloud flashes.
According to Nanevics et al.48 and Le Vine35, large pulses such as return
strokes and pulses with abrupt changes such as K changes are dominant at low frequencies. At a high frequency band, probing discharges are dominant. It seems that the result of this study is in line with their suggestions since long duration cloud flashes are characterized by many microseconds scale pulses embedded intermittently on the electric field waveform. In addition, the f -1 dependency matches the f - 1 decrease in spectral amplitude using
direct measurement (narrow band) systems, particularly at high frequency. In the narrow band system, the resonator circuit is tuned to the interested fre-quency and the frefre-quency response is measured directly. However, with this technique it is difficult to determine which lightning event corresponds to the interested frequency. This is because depending on the bandwidth of the oscillator system, the oscillations corresponding to an event may continue for some time, resulting in an overlap with oscillations that correspond to another event.
It is essential to consider how the signal propagation could affect the ampli-tude of the lightning frequency spectrum. Signal attenuation depends on several factors such as the frequency content (high frequency attenuate more than lower frequency), channel height, ground conductivity, earth terrain,
roughness and curvature of the propagation path. Waves from the signals propagation path that follows the earth curvature are called ground waves. If the signals propagate through the ionospheric reflection, those signals are known as skywaves. At low frequencies (30 kHz – 300 kHz), the attenuation of ground wave is low. Absorption of the skywave is high especially in day-light, particularly in the summer, but low absorption during the night. At medium frequencies (300 kHz – 3 MHz), the ground wave will be affected significantly by poor ground conductivity. The skywave is completely ab-sorbed by the ionospheric layer during the daytime. At high frequencies (3 MHz – 30 MHz), ground wave is severely attenuated over short distance. As reported by Lin et al.39, the normalized field peaks suffer 10 % attenuation
when propagated at a distance of 50 km. Since all signals in this study were recorded within a distance of 20 km, it is expected that the propagation ef-fect (especially from the ground wave) is lesser and can be neglected. More-over, it has been shown by Cooray13 that the propagation effects on the
elec-tric field generated by cloud flashes are less severe than that of return strokes since significant portion of its total radiation field is contributed mostly by the sky wave.
Paper III
Characteristics of Narrow Bipolar Pulses observed in Malaysia
Narrow Bipolar Pulses (NBPs) is a type of discharge that occurs inside thun-derclouds. Because of this, they are considered as intra-cloud discharges. In some studies, they are also known as Narrow Bipolar Events (NBEs) 18, 69, 80
or Compact Intra-cloud Discharges (CIDs)62. Owing to their origin at
alti-tude between 6 km to 21 km, (where most commercial planes fly) and ac-companied by strong HF – VHF radiation emission, the understanding of the physical process of these events is thus vital especially from an engineering point of view. They have been reported to occur in the tropic and sub-tropical regions but none have been observed in the temperate region. Dur-ing our three months’ measurement campaign in Sweden (June to August 2010), no NBPs was ever recorded. It is possible that the difference in thun-derstorm types is responsible for the absence of NBPs in the temperate re-gion. Due to the absence of NBPs in Sweden, we have chosen to study the characteristics of NBPs recorded in the tropical region.
Data analyzed in this study were obtained from our measurement in the vi-cinity of the Universiti Teknologi Malaysia (UTM) campus, Johor, Malay-sia. In Malaysia, NBPs were observed to occur very frequently; most of the time during the pre-thunderstorm stage. However, some of the NBPs were also recorded during the active stage of thunderstorm, and relatively less NBPs were recorded during the later stage of thunderstorm. Both polarities
of NBPs, namely Narrow Negative Bipolar Pulses (NNBPs) and Narrow Positive Bipolar Pulses (NPBPs) have been recorded. It should be noted that in this study, the sign convention used to describe the electric field change at ground level corresponds to the atmospheric electricity. According to the sign convention, the positive field change at ground level is produced by a movement of negative charge downwards, which is similar to the process taking place in a negative ground flash. Thus an initially negative peak fol-lowed by a positive overshoot is termed as Narrow Positive Bipolar Pulses (NPBPs), whereas the opposite is termed as Narrow Negative Bipolar Pulses (NNBPs). The characteristics of NBPs from other tropical region have also been reported by Sharma et al.57 and Cooray and Lundquist17. However, only
positive bipolar pulses were recorded in their study. Furthermore, it was observed from their study that NBPs occurred separately, without being companied by other lightning processes i.e., cloud flash or ground flash ac-tivities.
In this study, the radiation field parameter of NBPs such as the pulse dura-tions, peaks amplitude and full width at half maximum (FWHM) were stud-ied. The information is essential especially for those working with the math-ematical modeling of NBPs. It was found that the mean peak amplitude of narrow positive bipolar pulses (NPBPs) normalized to 100 km was 22.7 V/m, a factor of 1.3 higher than that of narrow negative bipolar pulses (NNBPs) which is 17.6 V/m. It was observed that the pulse duration in our study is approximately two times longer than the one recorded by Sharma et al.57 but three times shorter than Cooray and Lundquist17. We suggest that
the difference between the pulse duration measured in Malaysia and Sri Lanka could be attributed to the propagation effect. This is because our data were recorded from a distance of 50 km inland, while in Cooray and Lundquist’s work the data were recorded at a distance of 100 km to 200 km. It has to be noted that NBPs of both polarities were observed in Malaysia. Similarly, NBPs of both polarities were also observed from the measure-ments in New Mexico18, 69 and Shanghai, China80.However, from the electric
field measurement in Colombo, Sri Lanka17, 15 and Gainsville, Florida47 only NPBPs were recorded. Sri Lanka is a small island located in the warm tropi-cal Indian Ocean, while Florida is surrounded by the Atlantic Ocean in the sub-tropical region. In fact both of the measuring stations in Sri Lanka and Florida were located at areas close to the open sea. It was reported that the sea breeze circulation is one of the most prominent mesoscale in Sri Lanka1
while in Florida the air mass due to the thermal instabilities and sea breeze convergence are the primary types of thunderstorm19. According to
Jaya-maha29 the warm sea surface around the island will cause tropical air masses to spread over the country. According to Williams and Stanfill76 there was
land lightning activities. Since land is much hotter than sea, the updraft strength is stronger over the land than over the ocean. Meanwhile, the meas-uring site in Malaysia was located several tens of kilometers inland from the Tebrau and Malacca Straits and more than 100 km inland from the open South China Sea (in the east). During the southwest monsoon period, the thundercloud formation was greatly affected by the wind blowing from the Indian Oceanc. However, since Peninsular Malaysia is bounded by Singapore
in the south and Sumatra Island in the west, the geographical location of Peninsular Malaysia is that the frontal sea breeze circulation is not as strong as those in the open coastal area (such as Florida) or the open island (such as Sri Lanka) because it is been shielded mainly by the Sumatra Island. There-fore it is possible that the meteorological conditions may favor the produc-tion of both NPBPs and NNBPs.
Paper IV
Some features of electric field waveform of narrow bipolar pulses
In Paper IV, we observed that NBPs are characterized by many small peaks superimposed on the rising and decaying edge of radiation field waveform and the appearance has never been reported elsewhere. Since in previous studies16, 34 ,74, NBPs were reported to be characterized by smooth, fast rising
pulses similar to those of return strokes, we are thus interested in further deepening our investigation on the small peaks occurrence in our present study. We have investigated data recorded from Malaysia and Sri Lanka, and the small peaks were observed in data from both locations. Overall, the peaks are narrow, with nanoseconds scale pulse duration and time separation between each successive pulse having the order of few tens of nanoseconds. All data were recorded using a 12 bit resolution recording unit and this has allowed us to observe the small peaks very clearly. It is possible that the absence of these peaks in previous studies was due to the limitation of the digitizer resolution. The appearance of small peaks on the electric field waveform of NBPs is in line with the noisy features of NBPs electric field time derivatives (dE /dt). We have performed several statistical analyses on the subsidiary peaks of dE / dt. It was found that the separation between these peaks (40 ns) is approximately equal to the time separation between small peaks found on the electric field waveform of NBPs. This observation led us to speculate that NBPs were produced as a result of frequent small scale discharges.
c http://www.met.gov.my
Following this, the HF radiation at 30 MHz associated with NBPs has also been studied and discussed. There are few studies that have been published showing the temporal variation of HF radiation associated with NBPs45, 62.
However, none of the studies focus on the temporal HF radiation that ac-companies NBPs. Our observation found that the
burst
of the HF noise be-gins simultaneously with the onset of the NBP electric field, but not preced-ing the electric field change. There are some records showpreced-ing the HF radia-tion prior to NBPs. However in these cases, NBPs were observed as being accompanied by some in-cloud processes, which may be responsible for the HF emission prior to NBPs. Our observation thus confirms the absence of leader process during the formation of NBPs.We also observed a slight delay of less than 1 µs between the onsets of NPBPs to the beginning of HF radiation. An even longer delay (approxi-mately 3 µs) was observed from the onset of NNBP to the beginning of HF radiation. It is expected that the delays were a results of the propagation ef-fect since data were recorded from a distance of 50 km. We could not find any possible explanation as to why there was a longer delay with the NNBPs. It is suggested that the responsible process that emits the 30 MHz radiation from NBPs of both polarities could be the same since the duration of the 30 MHz radiations are similar. The mean duration of the 30 MHz ra-diation is about 10 µs which implies that the processes which produce long-lasting noise have no effect when the channel is formed.
On the basis of our analysis, we conclude that:
(a) No streamers or leader process took place before the initiation of NBPs. (b) Some small scale discharges were involved during the formation of NBPs and these discharges could be responsible for the intense HF radiation from NBPs.
6. Concluding Remarks
Electric fields generated by lightning can be used to understand the physics behind lightning initiation mechanisms. Even though 90% of lightning flash-es are cloud flashflash-es, due to various reasons work on cloud flashflash-es are rela-tively scarce. Thus the objective of this work is to reveal new knowledge on cloud discharges. Compared to CG flashes, cloud flashes do not pose a direct threat to human life and properties. However, HF radiation associated with ICs may interfere with sophisticated electronic systems widely used in mod-ern avionic and health systems. Therefore, the knowledge on HF radiation associated with ICs is of importance to evaluate the threat on electronic sys-tems. In this study investigation was carried out on the HF radiation gener-ated by ICs and NBPs. The results discussed in this work are based on the measurement performed in different geographical locations—subtropical, tropical and temperate regions. For example, data for Paper I was obtained from measurements done in Vero Beach, Florida in the subtropical region. Data for Paper II and Paper III were obtained from Sweden and Malaysia, respectively. Results discussed in Paper IV were based on data obtained from Malaysia and Sri Lanka, both in the tropical region.
Even though ICs and CGs are two different lightning activities, it is sug-gested that their initiation processes which takes place inside the thunder-cloud could be the same, depending upon the differences between the initial pulses of these discharges. Interestingly, it was found that small pulses which typically appear in the later stage of ICs also have similar characteris-tics to the initial pulse of CGs. Further investigation on cloud flashes re-vealed that their spectral amplitudes peak at approximately 20 kHz and con-tinue to decrease as f -1 to the high frequency at 10 MHz. The result was in
contrast to the typical distribution of CGs frequency spectrum, stepped lead-ers and intra-cloud pulses, where the curve will decrease further as f -2 or
more at high frequency region (particularly above 2 MHz). Our result also produced some inconsistency with the f -2 decrement in the first 10 ms
spec-trum of cloud flashes. It is expected that the increase in pulse rates of cloud flashes contributes significantly to the increment of spectral amplitudes at high frequency.
Since NBPs appeared to be associated with ICs we have conducted a study to further investigate this phenomenon. A measurement conducted during
the southwest monsoon period in Malaysia in the tropics observed numerous records of NBPs from both polarities. Apparently, NBPs appear similar to the characteristic pulses and large bipolar pulses typically observed in the preliminary breakdown and active stage of CGs and ICs, respectively. How-ever distinct features of the narrow pulse duration (typically in the range of less than 30 µs), larger peak amplitude than ICs and CGs and its association with intense HF – VHF radiation are those that characterize NBPs from oth-ers. In general, it was observed that the characteristics of NBPs observed in Malaysia are similar to those recorded in other geographical regions such as in Sri Lanka and Florida. Being known to mostly occur singly, it is evident from our study that NBPs were not isolated phenomenon but occur simulta-neously with ordinary lightning. Indeed, a majority of NBPs (63 %) recorded in this thesis work was observed to initiate cloud discharges or to be accom-panied by other lightning activities such as return strokes, within few tens of milliseconds before and after the pulses. It is also shown from our studies that no stepped-leaders processes were involved during the formation of NBPs. A slight delay of less than 1 µs was observed between the onsets of NPBPs to the beginning of HF radiation while a longer delay (approximately 3 µs) was observed from the onset of NNBP to the beginning of HF radia-tion. Further investigation on the electric field waveform of NBPs has led us to observe many small peaks embedded in the envelope of the electric field change of NBPs. This observation is indeed in line with the noisiness feature of the electric field time derivatives of (dE /dt) of NBPs. We have shown that the time separation between each successive small peaks is in the order of few tens of nanoseconds, similar to the time separation of subsidiary peaks embedded in dE / dt. On the basis of our observations, it is proposed that NBPs were produced as a result of many small scale discharges which were mostly responsible for the intense burst of 30 MHz emission.