Fractional enrichment of proteins using
[2-C-13]-glycerol as the carbon source facilitates
measurement of excited state C-13 alpha
chemical shifts with improved sensitivity
Alexandra Ahlner, Cecilia Andrésen, Shahid N. Khan, Lewis E. Kay and Patrik Lundström
Linköping University Post Print
N.B.: When citing this work, cite the original article.
The original publication is available at www.springerlink.com:
Alexandra Ahlner, Cecilia Andrésen, Shahid N. Khan, Lewis E. Kay and Patrik Lundström, Fractional enrichment of proteins using [2-C-13]-glycerol as the carbon source facilitates measurement of excited state C-13 alpha chemical shifts with improved sensitivity, 2015, Journal of Biomolecular NMR, (62), 3, 341-351.
http://dx.doi.org/10.1007/s10858-015-9948-1
Copyright: Springer Verlag (Germany)
http://www.springerlink.com/?MUD=MP
Postprint available at: Linköping University Electronic Press
Fractional enrichment of proteins using [2-
13C]-glycerol as the
carbon source facilitates measurement of excited state
13C
chemical shifts with improved sensitivity
Alexandra Ahlner1, Cecilia Andresen1, Shahid N. Khan1, Lewis E. Kay2,3 and Patrik Lundström1,*
1Division of Molecular Biotechnology, Department of Physics, Chemistry and Biology,
Linköping University, SE-58183 Linköping, Sweden
2Departments of Molecular Genetics, Biochemistry and Chemistry, The University of
Toronto, One King’s College Circle, Toronto, Ontario M5S 1A8, Canada
3Hospital for Sick Children, Program in Molecular Structure and Function, 555 University
Avenue, Toronto, Ontario, M5G 1X8, Canada
*To whom correspondence should be addressed, e-mail: patlu@ifm.liu.se, phone: +46-13-286650, fax: +46-13-137568
Abstract
A selective isotope labeling scheme based on the utilization of [2-13C]-glycerol as the carbon source during protein overexpression has been evaluated for the measurement of excited state
13Cα chemical shifts using Carr-Purcell-Meiboom-Gill (CPMG) relaxation dispersion (RD)
experiments. As expected, the fractional incorporation of label at the Cα positions is increased two-fold relative to labeling schemes based on [2-13C]-glucose, effectively doubling the
sensitivity of NMR experiments. Applications to a binding reaction involving an SH3 domain from the protein Abp1p and a peptide from the protein Ark1p establish that accurate excited state 13Cα chemical shifts can be obtained from RD experiments, with errors on the order of
0.06 ppm for exchange rates ranging from 100 s-1 - 1000 s-1, despite the small fraction of
13Cα-13Cβ spin-pairs that are present for many residue types. The labeling approach described
Introduction
Recent developments in NMR methodology have facilitated structure calculations of small proteins using 13Cα, 13Cβ, 13CO, 1Hα, 1HN and 15N chemical shift restraints (Cavalli et al. 2007; Shen et al. 2008). This is an important advance since of all NMR parameters, chemical shifts are the most easily and accurately measured and they are available at an early stage in any analysis of NMR data. It was soon realized that this methodology could also be used to obtain structural models for ‘invisible’, transiently and sparsely populated protein states, once chemical shifts were available. New approaches have also been developed for measurement of such shifts (Hansen et al. 2008; Ishima et al. 2004; Ishima and Torchia 2003; Loria et al. 1999; Lundström et al. 2009a; Lundström et al. 2009b), focusing on CPMG RD experiments (Carr and Purcell 1954; Meiboom and Gill 1958). Analysis of CPMG RD profiles allows the determination of the magnitude of the difference in chemical shifts, |Δϖ|, between NMR spins in exchanging ground (‘visible’) and excited (‘invisible’) states so long as the excited conformer is populated to at least 0.5% with a millisecond lifetime (Palmer et al. 2001). Signs of Δϖ values can be determined by additional experiments (Auer et al. 2009; Skrynnikov et al. 2002), so that chemical shift assignments can be obtained for the excited state conformer. Atomic resolution structural models have now been reported for a number of such states (Bouvignies et al. 2011; Korzhnev et al. 2010; Neudecker et al. 2012; Vallurupalli et al. 2008) and the methodology has been extended further to include rare conformers of nucleic acids as well (Dethoff et al. 2012; Kimsey et al. 2015).
Key to the success of the CPMG-based structure approach has been the development of robust selective labeling schemes that significantly reduce problems associated with homonuclear scalar couplings (Lundström et al. 2009c). In this regard it has recently been shown that saturation transfer (CEST) methodology (Forsén and Hoffman 1963) is robust to such couplings (Bouvignies et al. 2014; Vallurupalli et al. 2013), however the exchange window for which CEST is of utility has a relatively low upper limit, typically (kex ≈ 20 – 500 s-1), and
CPMG RD remains the method of choice for studying conformational transitions that are faster (kex up to ≈ 2000 s-1).
Most of the selective labeling strategies that have been employed in the production of protein samples for CPMG RD studies are based on the use of suitably labeled glucose as the sole carbon source (Lundström et al. 2009c). For example, it has been shown that the use of
[2-13C]-glucose during protein overexpression leads to 13C enrichment levels at C positions of
between 17% and 45%, essentially without concomitant 13C labeling of Cβ, for 17 residue
types (Lundström et al. 2007). Accurate 13Cα chemical shifts of sparsely populated protein conformations can be readily obtained using such labeled protein samples along with pulse schemes that have been designed with the labeling scheme in mind (Hansen et al. 2008). The principal weakness of this labeling method is that the theoretical maximum enrichment at Cis only 50%, reducing the sensitivity of the NMR experiments accordingly.
A carbon source that has already been used for other purposes in NMR protein applications (Castellani et al. 2002; LeMaster and Kushlan 1996) is [2-13C]-glycerol and it is expected that this precursor would lead to a doubling of the fractional incorporation of 13C label at C. Moreover, this sensitivity gain would not be incurred at extra cost since the prices of [2-13 C]-glycerol and [2-13C]-glucose are similar. The purpose of the present study is to investigate the use of [2-13C]-glycerol as the carbon source in protein overexpression to establish (i) whether
13C incorporation levels are as expected, (ii) whether isolated 13Cα positions can be obtained
and (iii) whether accurate 13Cα chemical shifts of protein excited states can be determined
from CPMG RD experiments. As we show below, the incorporation level is indeed doubled compared to the use of [2-13C]-glucose and the fraction of undesired 13Cα-13Cβ spin-pairs is
sufficiently low so as not to interfere with accurate measurement of 13Cα chemical shifts by
CPMG RD.
Materials and Methods
Protein samples
An SH3 domain from the yeast protein Abp1p (Drubin et al. 1990; Lila and Drubin 1997; Rath and Davidson 2000) was prepared by overexpression in BL21(DE3) cells. Freshly transformed colonies were transferred to 30 ml LB supplemented with 100 mg/l ampicillin and grown to OD600 = 1.0 at 37C in a shaking incubator. Cells were then pelleted and a
fraction resuspended in 50 ml M9 medium supplemented with 0.5 g/l 15NH4Cl, 3 g/l[2-13
C]-glycerol and 100 mg/l ampicillin to give a starting OD600 = 0.15. The cells were grown to
OD600 = 0.8 (5 h) and this culture was subsequently poured into 450 ml of M9 medium of the
identical composition and grown to OD600 = 0.55 (6h). Overexpression was induced by
addition of 1 mM isopropyl-β-D-1-thiogalactopyranoside (IPTG) and continued for 12 h at 16
previously (Vallurupalli et al. 2007). The resulting NMR sample was 0.55 mM in protein, 50 mM NaPi, pH 7.0, 100 mM NaCl, 1 mM EDTA and 200 M NaN3. The solvent was 90%
H2O / 10% D2O, 100% D2O for 15N-1H and 13C-1H correlation experiments, respectively.
NMR spectroscopy
NMR experiments were performed using Varian INOVA spectrometers operating at 14.1 T, 18.8 T and 21.2 T, equipped with cryogenically cooled (14.1 T) or room-temperature (18.8 T and 21.1 T) probe-heads. All measurements were performed at 25C. To determine the fractional 13C incorporation at C positions, constant-time 13C-1H correlation spectra (Santoro and King 1992; Vuister and Bax 1992) were recorded for samples prepared with 15N, [2-13 C]-glycerol (referred to as selectively labeled sample in what follows) and 15N, U-13C-glucose. The fraction of isolated 13C nuclei for each amino acid was estimated by recording a
non-constant-time 13C-1H HSQC with t1,max = 80 ms for the selectively labeled sample.
A 17-residue fragment (KKTKPTPPPKPSHLKPK) from the protein Ark1p (Haynes et al. 2007), purchased from EZBiolab, was titrated into the selectively labeled Abp1p SH3 domain sample and the populations of free and bound states monitored by recording 15N CPMG relaxation dispersion experiments at 14.1 T. The titration was stopped once a population of the bound state of approximately 8% was reached. 13C RD experiments were performed at 14.1 T and 18.8 T using a pulse sequence described previously (Hansen et al. 2008). For the experiment at 14.1 T the constant-time CPMG relaxation delay was 16 ms and datasets with effective fields of 62.5, 125, 187.5, 250, 312.5, 375, 437.5, 500, 625, 750, 875, 1000 Hz were recorded while for the measurements at 18.8 T a relaxation delay of 20 ms and effective fields of 50, 100, 150, 200, 250, 300, 400, 500, 600, 700, 800, 1000 Hz were used. After initial 13C RD experiments were completed, additional Ark1p peptide was titrated into the sample and the 13Cα CPMG experiments were repeated (14.1 T and 21.1 T) using a constant-time relaxation delay of 16 ms and effective fields as above. Uncertainties were estimated from duplicate data points (Korzhnev et al. 2004).
Data analysis
All data were processed with NMRpipe (Delaglio et al. 1995) and visualized with Sparky (T. D. Goddard and D. G. Kneller, SPARKY 3, University of California, San Francisco). Peak integration was performed using the software PINT (Ahlner et al. 2013). For every peak, the
fractional incorporation of 13C label at each Cα position, f, was calculated as 𝑓 = (𝐼𝑆𝐶/𝐼 𝑈𝐶) 𝑎, 𝑎 = (< 𝐼𝑆 𝑁 𝐼𝑈𝑁>) ⁄ , where 𝐼𝑆𝐶 and 𝐼
𝑈𝐶 are the intensities of cross peaks in constant-time 13C-1H correlation spectra recorded on the selectively and uniformly labeled samples,
respectively, and a was calculated by summing intensity ratios of corresponding peaks in both samples over all peaks in the spectra. The fraction of 13Cα-13Cβ spin-pairs at a given site was
estimated by the ratio Id/(Is+Id), where Is and Id are the intensities of singlet and doublet
components for a correlation in a non-constant-time 13C-1H correlation spectrum recorded on the selectively 13C labeled sample.
Intensities in CPMG spectra were converted into effective transverse relaxation rates, as 𝑅2,𝑒𝑓𝑓(𝜈𝑐𝑝𝑚𝑔) = 1 𝑇⁄ ln(𝐼0⁄𝐼(𝜈𝑐𝑝𝑚𝑔)) where 𝐼(𝜈𝑐𝑝𝑚𝑔) is the intensity in spectra that include
the constant-time delay of duration T, 𝜈𝑐𝑝𝑚𝑔 = 1/(2 ∙ 𝜏𝑐𝑝), where 𝜏𝑐𝑝 is the delay between successive refocusing pulses in the CPMG train, and 𝐼0 is the intensity when the relaxation
delay is omitted. Dispersions were fitted to a two-state exchange model using the software CATIA (http://pound.med.utoronto.ca/software.html). The data were initially fitted on a per-residue basis and t-tests (details are given in the Results and Discussion section) performed to establish the presence of chemical exchange. A value of p<0.01 was considered significant. RD profiles for residues showing chemical exchange via the above criteria were fitted to a global two-state process to extract exchange parameters and values of |Δϖ|.
Results and discussion
The fractional incorporation of 13C at Cα is doubled compared with [2-13C]-glucose
The biosynthesis of amino acids using [2-13C]-glucose as the sole carbon source has been described before, in particular with respect to 13C labeling at C positions in proteins (Lundström et al. 2007). The principal weakness of the [2-13C]-glucose approach is that one
of the two glyceraldehyde-3-phosphate molecules generated in glycolysis is unlabeled, thereby diluting the 13C label that eventually ends up on C by a factor of two. By contrast, [2-13C]-glycerol can be converted to glyceraldehyde-3-phosphate that is 100% labeled at position 2. For residue types derived from glycolytic intermediates, the maximum incorporation at Cα positions is thus increased from 50% to 100%. Similarly, oxaloacetate and acetyl-S-CoA that enter the TCA cycle are twice as enriched in 13C (see Figure 1 of Lundström et al, 2007). Thus, residues derived from the TCA cycle intermediates
oxaloacetate and -ketoglutarate (AKG) are expected to be twice as enriched with 13C at Cα positions as well. The only amino acid for which the Cα position is not derived from glycolytic or TCA cycle intermediates is histidine. If [2-13C]-glucose is used as the carbon source we have found that the fractional 13C incorporation at C is 30% (Lundström et al. 2007). In contrast, if [2-13C]-glycerol is used, fusion of two such molecules leads to glucose that is labeled at position 5. Glucose labeled in this manner is converted to ribose-5-phosphate (R5P) via the pentose phosphate pathway, that is 100% 13C labeled at position 5. Since R5P is the precursor of the aliphatic backbone of histidine with C5 becoming C, histidine -carbons are expected to be labeled close to 100% if [2-13C]-glycerol is used as the carbon source.
We have determined the fractional incorporation of 13C at Cα positions by comparing peak intensities in 13C-1H correlation maps of selectively and uniformly 13C enriched Abp1p SH3 domain samples (see Materials and Methods). The results are presented in Table 1 where the amino acids have been grouped based on the precursor(s) they are derived from. For comparison, the results obtained previously using [2-13C]-glucose (Lundström et al. 2007) are also shown.
Table 1. Fractional incorporation of 13C label at protein C positions using [2-13C]-glycerol and [2-13C]-glucose.
1For an SH3 domain from yeast Abp1p (this work). 2For ubiquitin and an FF domain from human HYPA/FBP11
(Lundström et al. 2007). 3Not present in the SH3 domain from Abp1p. 4Too low to be quantitated accurately.
As expected, the fractional incorporation is almost exactly doubled for most residue types compared to the previous case where [2-13C]-glucose was used. Since the expression levels
Precursor Residue type(s) Fractional incorporation [2-13C]-glycerol1 Fractional incorporation [2-13C]-glucose2 pyruvate, phosphoenolpyruvate, 3-phosphoglycerate
Ala, Cys, Gly, Phe, Ser, Trp, Tyr, Val
0.94 0.18 (9) 0.45 +/- 0.04 (23)
oxaloacetate Asn, Asp, Ile, Met, Thr
0.66 0.25 (5) 0.28 +/- 0.02 (21)
-ketoglutarate Arg, Gln, Glu, Pro 0.31 0.08 (6) 0.17 +/- 0.02 (17) oxaloacetate or pyruvate Lys 0.77 n.a. (1) 0.38 +/- 0.03 (11)
ribose-5-phosphate His n.a.3 0.30 +/- n.a. (1)
are similar for both [2-13C]-glucose and [2-13C]-glycerol (Lundström et al. 2009c), the
sensitivity in NMR experiments per unit weight carbon source is doubled if [2-13C]-glycerol
is chosen as the carbon source. In our analysis (Table 1) we obtained reliable results for 15 of the 16 residue types present in the Abp1p SH3 domain, with the exception being Leu for which the fractional incorporation of 13C was too low to quantitate accurately. For the residues not present in the domain (Arg, Cys, Gln and His), the incorporation level at Cα is expected to be very similar to that of other amino acids derived from AKG (Arg, Gln, ~ 30%) or from pyruvate, phosphoenolpyruvate or 3-phosphoglycerate (Cys, ~ 90%). As described above, the Cα position of His is expected to be labeled to almost 100%.
It is also interesting to compare with previous results using similar labeling schemes. LeMaster and Kushlan used [2-13C]-glycerol in combination with NaH13CO3 to express
thioredoxin in cells with a disrupted TCA cycle (LeMaster and Kushlan 1996). The most striking difference is that Arg, Gln, Glu and Pro, are not labeled at all at Cα using their approach. This is entirely due to the lesion in the TCA cycle since only AKG produced in the second round of the cycle will produce residues labeled at Cα. A second difference is that Asn, Asp, Ile, Lys, Met and Thr are labeled >90% at Cα compared to 66% (77% for Lys) here. Also in this case, the disrupted TCA cycle explains the differences as all oxaloacetate (OA) that is the precursor for these residue types must be derived from carboxylation of phosphoenolpyruvate and will be enriched for 13C close to 100% at the position
corresponding to Cα if [2-13C]-glycerol is used as the carbon source (Lundström et al. 2009b).
Although cells with a disrupted TCA cycle increases the sensitivity slightly for six residue type this is offset by the loss of four potential probes for dynamics. In addition, cells with a disrupted TCA cycle are expected to grow slower and perhaps produce less protein. The use of NaH13CO3 by LeMaster and Kushlan is not expected to have any impact on labeling at Cα
although it is beneficial for enrichment at other positions.
Key to the success of using [2-13C]-glucose as the carbon source is the very low (in fact undetectable) fraction of 13Cα-13Cβ spin pairs for all residue types except isoleucine and valine (Lundström et al. 2007). The reason for the need for isolated 13Cα moieties is that the 35 Hz scalar coupling to Cβ during the constant time relaxation delay of a CPMG RD experiment will evolve differently depending on the repetition rate of the refocusing pulses. In the slow pulsing limit, the weak form of the scalar coupling applies and the scalar evolution
of an operator 𝐼𝑌𝛼 is 𝐼
𝑌𝛼→ 𝐼𝑌𝛼cos(𝜋𝐽𝑇) − 2𝐼𝑋𝛼𝐼𝑍𝛽sin(𝜋𝐽𝑇) where 𝐼𝛽 is the coupled spin, J is the
coupling constant and T is the duration of the relaxation delay. In the fast pulsing limit, the evolution is instead 𝐼𝑌𝛼→ 𝐼𝑌𝛼cos2(𝜋𝐽𝑇) + 𝐼𝑌𝛽sin2(𝜋𝐽𝑇) + (𝐼𝑍𝛼𝐼𝑋𝛽− 𝐼𝑋𝛼𝐼𝑍𝛽) sin(2𝜋𝐽𝑇) . The evolution is thus modulated by the pulsing rate even in the absence of chemical exchange, leading to artifacts in RD profiles as has been reported before (Ishima and Torchia 2003).
Non constant-time 13C-1H HSQC spectra of the Abp1p SH3 domain generated using [2-13
C]-glycerol (Figure 1) clearly show that there are additional residue types that are fractionally
13Cα-13Cβ labeled as can be seen from peaks that comprise a superposition of a singlet
(corresponding to an isolated 13Cα moiety) and a doublet (corresponding to a 13Cα-13Cβ spin pair). We quantified the percentage of 13Cα-13Cβ spin pairs (see Materials and Methods) and found that, as before, Cα and Cβ are simultaneously 13C labeled in Ile and Val to approximately 85%. For Ser and Trp (and we anticipate Cys) we quantify 9% while for Ala, Glu and Asp, values of 8%, 6% and 6% are measured, respectively. Since the doublet components were often not well resolved from the center line the results must be interpreted as approximate. Moreover, only a subset of residues could be quantified, however, it is clear that a low, but measurable, level of spin pairs is produced.
Figure 1. Selected regions of non-constant-time 13C-1H HSQC spectra. Highlighted are a number of cross-peaks
that show evidence of simultaneous 13C labeling at Cα and Cβ positions, to an extent that varies with residue
type. a) Residue types for which 13Cα-13Cβ spin pairs are not predicted from the major biosynthetic pathways in
isolation. b) Residue types for which they can be predicted.
A thorough analysis of the interplay between different metabolic pathways readily explains the results for many amino acids. If [2-13C]-glycerol is used as the carbon source, two
products of the pentose phosphate pathway are [1,5-13C
2]-fructose-6-phosphate and [1,3,5-13C
3]-fructose-6-phosphate, Figure 2a. Subsequently, when these molecules enter glycolysis,
Figure 2b, the resulting three-carbon amino acids, such as serine, can be labeled at Cβ but not at Cα. The 13Cβ of serine can then be transferred to tetrahydrofolate (THF) to yield N5,N10
-methylene-THF and glycine, Figure 2c. When the 13C labeled methylene group of N5,N10 -methylene-THF is transferred back to glycine, labeled with 13C at the α-position, serine that is simultaneously labeled with 13C at Cα and Cβ results. Since cysteine and tryptophan are derived from serine the same labeling pattern results for these amino acids. [1,5-13C2
]-fructose-6-phosphate and [1,3,5-13C3]-fructose-6-phosphate are the source of [1-13
C]-acetyl-CoA (Figure 2a) that can combine with [2-13C]-oxaloacetate and enter the TCA cycle, Figure 2d (Pass 1). The result is production of oxaloacetate (OA) 13C labeled at C2 and C3 that in turn leads to 13Cα-13Cβ spin pairs for OA precursor amino acids Asn, Asp, Ile, Leu, Met and Thr. In a second round of the TCA cycle (Figure 2d, Pass 2) OA labeled at C2 and C3 produces 2,3,4-13C AKG that is the source of Arg, Gln, Glu and Pro, 13C labeled at C and
C. Finally, the small amount of fractional 13Cα-13Cβ labeling for alanine can be understood
from the fact that this residue can be formed as a degradation product of tryptophan (Voet and Voet 1995). Although similar possibilities for 13Cα-13Cβ labeling are expected when [2-13
C]-glucose is used as the carbon source during protein overexpression, it is clear that such effects are smaller and they were not detected in our previous analysis (Lundström et al. 2007).
In addition to scalar couplings to Cβ, also the effect of long range couplings must be considered. Although they are smaller they could still manifest as artifacts in RD experiments if the positions are sufficiently enriched for 13C. We have not attempted to quantitate simultaneous labeling at Cα and other carbon positions with 13C but Figure 2d predicts simultaneous labeling at Cγ for residue types derived from OA and AKG. In addition, other positions, such as Cγ for aromatic residue types, are also predicted to be simultaneously labeled (Lundström et al. 2007). In many of these cases, the coupled nuclei resonate sufficiently far from 13Cα so that couplings can be refocused by substituting band-selective pulses (Geen and Freeman 1991) for hard pulses in the CPMG pulse train. Couplings to aliphatic carbons of residues derived from AKG (Arg, Gln, Glu and Pro) are however hard to refocus this way and may still lead to artifacts.
Figure 2. Interplay of biosynthetic pathways leading to 13Cα-13Cβ spin pairs when [2-13C]-glycerol is the carbon
source during protein overexpression. 13C labeled positions are highlighted in red. Other colors and boxes are
used to track the fate of specific fragments. Amino acids that are simultaneously labeled at Cα and Cβ are shown in red font. Dashed arrows indicate reactions that proceed in several steps. Multiple solid arrows indicate that a number of product molecules are produced that are then used as reactants in different steps along the cycle. For example, 3 molecules of glucose-6-phosphate are converted into 3 molecules of ribulose-5-phosphate (hence 3
solid arrows), one of which is then converted into ribose-5-phosphate and two into xylulose-5-phosphate. a) The pentose phosphate pathway starting from [2-13C]-glycerol leads to the synthesis of [1,5-13C
2]- and [1,3,5-13C3
]-fructose-6-phosphate. b) Fructose-6-phosphate from the pentose phosphate pathway enters glycolysis, producing Ser that is 13C labeled at the CO and Cβ positions, but not at Cα. c) Synthesis of 13Cα-13Cβ labeled serine,
cysteine and tryptophan from fructose-6-phosphate derived from the pentose phosphate pathway and glycine derived from glycolysis. d) Two passes of the TCA cycle, in which oxaloacetate at the start of the first pass is derived from glycolysis and acetyl-S-CoA is derived from fructose-6-phosphate synthesized in the pentose phosphate pathway. The first pass (Pass 1) leads to 13Cα-13Cβ spin pairs in residues derived from oxaloacetate,
while a similar scenario occurs for amino acids from -ketoglutarate in the second pass (Pass 2).
Accurate protein excited state 13Cα chemical shifts can be obtained
As described above, the principle advantage of using [2-13C]-glycerol to produce proteins for
13Cα CPMG RD studies is the two-fold increase in fractional incorporation of 13C at C
relative to what is obtained when [2-13C]-glucose is used as the carbon source. This gain is offset to some extent by the increase in 13Cα-13Cβ spin pairs that, in turn, compromises the utility of RD profiles due to magnetization interchange between the coupled 13Cα,13Cβ spins during application of the CPMG pulse train (Ishima et al. 2004; Lundström et al. 2008; Lundström et al. 2009a). We have therefore extensively evaluated the utility of the [2-13 C]-glycerol labeling scheme in 13Cα RD studies. This was achieved by using an exchanging system described previously (Hansen et al. 2008; Vallurupalli et al. 2007) involving an SH3 domain from the yeast protein Abp1p (Drubin et al. 1990; Lila and Drubin 1997; Rath and Davidson 2000) and a peptide from the protein Ark1p (Haynes et al. 2007),
SH3 + Ark1p peptide ⇄ SH3–peptide
The dissociation constant for the complex is 0.55 M, 25°C (Vallurupalli et al. 2007) and the exchange kinetics are such that the pseudo first-order rate constant, 𝑘𝑒𝑥= 𝑘𝑜𝑛[𝐿] + 𝑘𝑜𝑓𝑓
where [L] is the concentration of free Ark1p peptide, can be varied over the range of ‘CPMG sensitive exchange rates’ (approximately 100 s-1 – 2000 s-1) simply through the addition of
different amounts of Ark1p peptide. Further, when only a small amount of peptide is added, the major conformation in solution is the unbound SH3 domain (‘ground state’), while the minor conformer (‘excited state’) is the bound domain. The situation is reversed through the addition of close to stoichiometric amounts of peptide. Because it is possible to prepare samples of free and fully bound SH3 domain, the chemical shifts of both states can be
determined using conventional NMR methods to high accuracy, providing a benchmark for the corresponding values obtained by CPMG RD methods.
Initially, Ark1p peptide was titrated into a solution of free SH3 domain to yield a population of bound SH3 domain, pB, of 8.3 ± 0.3% and kex = 138 ± 9 s-1, as established from 15N CPMG
experiments recorded at 14.1 T. Subsequently, 13C CPMG dispersion profiles were recorded at 14.1 T and 18.8 T, so that absolute values of shift differences obtained either via CPMG (|ΔϖCPMG|) or directly from spectra of bound and free SH3 domain (|ΔϖDirect|) could be
compared. Since many alpha protons resonate close to water the sample was lyophilized and dissolved in 99% D2O prior to recording 13C RD experiments.
Accurate values of |ΔϖCPMG| can be obtained from fits of RD profiles only if pB, kex can be
quantified properly. This is most easily accomplished by initially including only residues in fits (i) for which RD profiles show significant chemical exchange and (ii) where systematic errors are minimal. Thus, we have excluded Ile and Val residues from analysis because of the high fraction of 13Cα-13Cβ spin pairs for these amino acids, as well as Leu because of the low fractional incorporation of 13C label at the Cα position (Figure 1a). RD profiles from Gly have
also been excluded because the methylene spin system at Cα requires a different pulse scheme than the one used here for the methine C positions (Lundström et al. 2009b; Mulder et al. 2001). There are a number of approaches for identifying candidate RD profiles for analysis. The most straightforward method is to use a minimum cut-off for the size of the profiles, as described previously (Choy et al. 2005). Another method is to fit the data on a residue-by-residue basis to models that either include or exclude chemical exchange and then use an F-test statistical analysis to select the appropriate model. Here we have used a simple, alternative method. For chemical exchange on all time-scales the effective transverse relaxation rate, R2,eff, in single quantum CPMG RD profiles is higher in the free precession
limit (CPMG0) than for fast-pulsing (CPMG). Rex(CPMG) = R2,eff(CPMG) –
R2,eff(CPMG) is thus a decaying function and under conditions of intermediate to fast
exchange it decays monotonically and can be approximated by a decaying exponential for which the logarithm is linear in CPMG. Thus, the presence of exchange can be established by
fitting log[Rex(CPMG)] values to a linear function and testing the resulting slopes to see if they
are different from zero. The protocol we have used is thus: i) fit RD curves on a residue-by-residue basis, ii) subtract the exchange-free contribution and calculate the logarithm, iii) fit to
a linear function and iv) perform a t-test to determine whether the slope is different from zero. Using this protocol and considering a significance level of p<0.01 we identified chemical exchange at 13Cα positions for 17 residues. These included all amino acids for which
|ΔϖDirect|>0.2 ppm but not three of the residues with 0.1 ppm < |ΔϖDirect| < 0.2 ppm. In
addition, 13C nuclei for two residues for which |ΔϖDirect| < 0.05 ppm were likely incorrectly
assigned as reporting on chemical exchange.
Rather than fit the resulting RD profiles from the 17 residues that ‘passed’ the chemical exchange criteria listed above to a global two-state exchange model, we first considered a subset of 5 that were the largest as defined as R2,eff(CPMG=50 Hz) – R2,eff(CPMG=1000 Hz) (>
6 s-1, 18.8 T). Extracted values of kex = 160 40 s-1 and pB = 4.9 0.9% were obtained that
can be compared with kex = 138 ± 9 s-1, pB = 8.3 ± 0.3% generated from fits of 15N CPMG
data. The discrepancies no doubt reflect the difficult in obtaining highly accurate exchange parameters when only relatively small RD profiles are considered, as is the case for the 13C
dispersion curves (Figure 3), but also the fact that in this relatively slow exchange regime kex
and pB are partly inversely correlated, which at least to some extent explains the higher
kex/lower pB values for 13C relative to 15N. The extracted values of (kex, pB) obtained in this
manner were subsequently used in global fits of all of the RD profiles to generate |ΔϖCPMG|
values, discussed below. It is worth noting that fixing (kex, pB) did not lead to higher reduced 2 values relative to the case where exchange parameters were allowed to float in fits
involving RD curves from all 17 residues, while the extracted exchange parameters were far more robust.
Figure 3. Representative 13Cα dispersion profiles for residues with significant chemical exchange in an Abp1p
SH3 domain that interconverts between free and Ark1p peptide bound forms (5% bound Ark1p peptide is present). The SH3 domain was produced with [2-13C]-glycerol as the sole carbon source. Red (blue) symbols
denote data points recorded at 14.1 (18.8) T, 25oC, and the solid lines are a global fit to the data, assuming a
model of two-site chemical exchange. See SI Figure S1 for data on all residues.
Figure 4 shows a bar graph of |ΔϖDirect| (red) and |ΔϖCPMG| (black) for all residues for which
RD curves could be measured. Shown in the upper left hand corner is the pairwise root-mean-square-deviation (RMSD) between the two data sets. Note that |ΔϖCPMG| was set to 0 for
residues that were classified as ‘lacking significant chemical exchange’ by the criteria defined above. A good correlation is obtained between the two data sets, RMSD = 0.064 ppm (n=44). The inset to the figure shows a linear correlation plot of |ΔϖCPMG| vs |ΔϖDirect|, including only
those residues with chemical exchange, for which an RMSD of 0.059 ppm was obtained.
Figure 4. Correlation between the absolute values of chemical shift differences between an Abp1p SH3 domain
exchanging between free and Ark1 peptide bound forms, as measured in separate samples of free and fully bound protein (red bars), |ΔϖDirect|, and shift differences obtained from RD experiments measured on an SH3
domain sample with ≈5 % Ark1p peptide, |ΔϖCPMG| (black bars). The pairwise RMSD between the data sets is
indicated in the figure. The positions of Gly, Ile, Leu and Val residues that have been omitted from the analysis are indicated with asterisks. The inset shows the corresponding data for residues with ‘significant’ chemical exchange (see text) and the y=x line is included to guide the eye.
A kex value of »150 s-1, as obtained from analysis of the RD data sets described above, is on
the ‘slow side’ for CPMG applications and we were interested in testing faster exchange regimes. To this end an additional aliquot of Ark1p peptide was titrated into the sample to increase the exchange rate. Values of kex = 1030 ± 50 s-1 and pB = 89.4 ± 0.8% were estimated
from analysis of 15N CPMG RD profiles recorded on the resulting sample, where p
B refers to
experiments were recorded at spectrometer field strengths of 14.1 T and 21.1 T and 18 residues identified for further analysis. Not surprisingly, the residues sensitive to the chemical exchange process were largely the same as before. In general, we find that it is possible to reliably identify conformational dynamics at 13C positions if |Δϖ| > 0.2 ppm and 100 < kex <
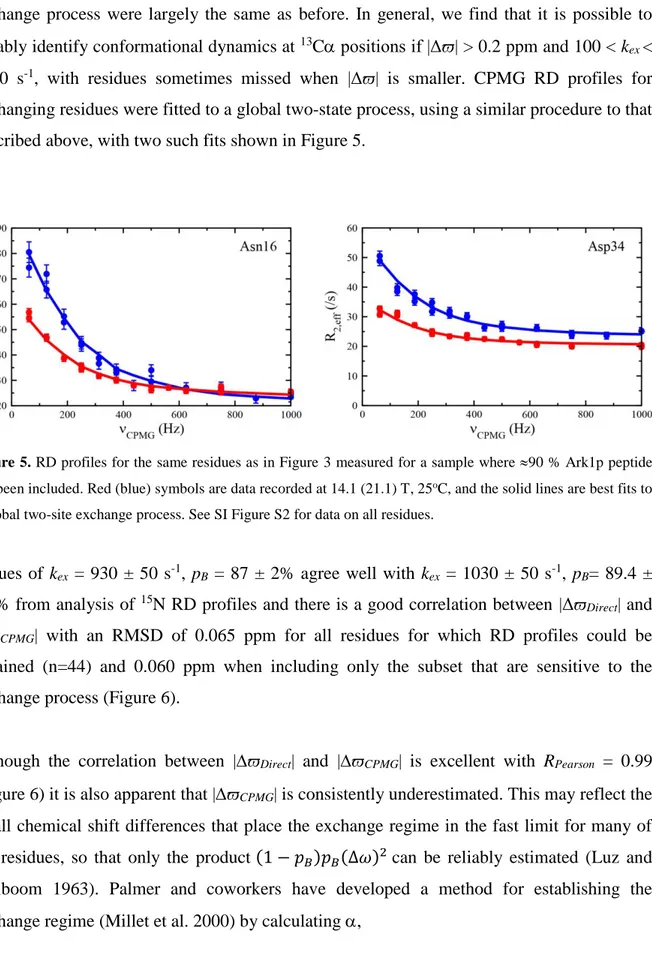
1000 s-1, with residues sometimes missed when |Δϖ| is smaller. CPMG RD profiles for exchanging residues were fitted to a global two-state process, using a similar procedure to that described above, with two such fits shown in Figure 5.
Figure 5. RD profiles for the same residues as in Figure 3 measured for a sample where 90 % Ark1p peptide has been included. Red (blue) symbols are data recorded at 14.1 (21.1) T, 25oC, and the solid lines are best fits to
a global two-site exchange process. See SI Figure S2 for data on all residues.
Values of kex = 930 ± 50 s-1, pB = 87 ± 2% agree well with kex = 1030 ± 50 s-1, pB= 89.4 ±
0.8% from analysis of 15N RD profiles and there is a good correlation between |ΔϖDirect| and
|ΔϖCPMG| with an RMSD of 0.065 ppm for all residues for which RD profiles could be
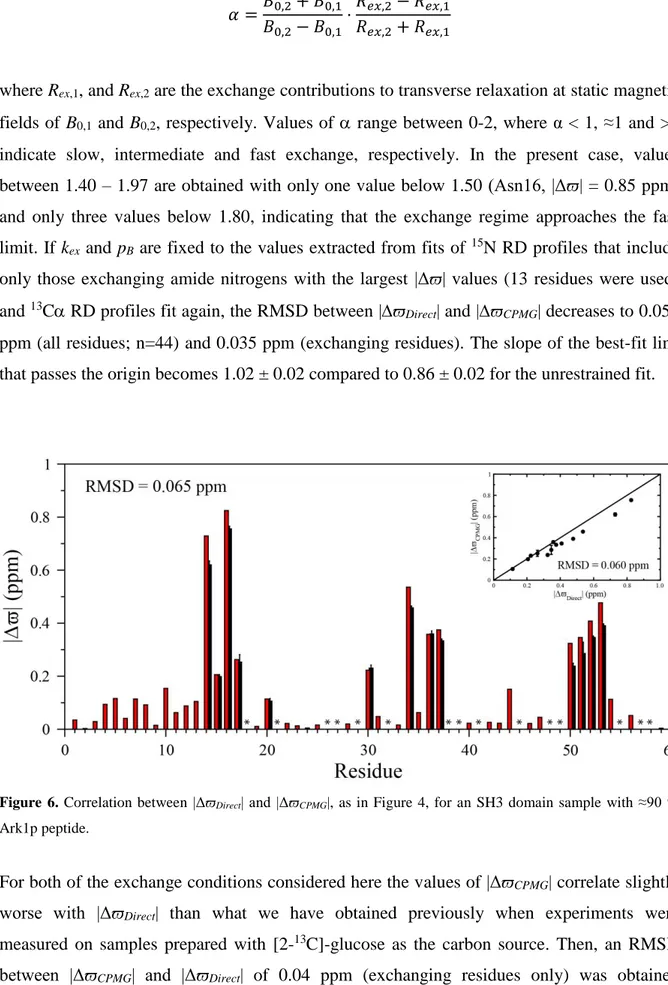
obtained (n=44) and 0.060 ppm when including only the subset that are sensitive to the exchange process (Figure 6).
Although the correlation between |ϖDirect| and |ϖCPMG| is excellent with RPearson = 0.99
(Figure 6) it is also apparent that |ϖCPMG| is consistently underestimated. This may reflect the
small chemical shift differences that place the exchange regime in the fast limit for many of the residues, so that only the product (1 − 𝑝𝐵)𝑝𝐵(Δ𝜔)2 can be reliably estimated (Luz and
Meiboom 1963). Palmer and coworkers have developed a method for establishing the exchange regime (Millet et al. 2000) by calculating ,
𝛼 =𝐵0,2+ 𝐵0,1 𝐵0,2− 𝐵0,1⋅
𝑅𝑒𝑥,2− 𝑅𝑒𝑥,1 𝑅𝑒𝑥,2+ 𝑅𝑒𝑥,1
where Rex,1, and Rex,2 are the exchange contributions to transverse relaxation at static magnetic
fields of B0,1 and B0,2, respectively. Values of range between 0-2, where α < 1, ≈1 and >1
indicate slow, intermediate and fast exchange, respectively. In the present case, values between 1.40 – 1.97 are obtained with only one value below 1.50 (Asn16, |Δϖ| = 0.85 ppm) and only three values below 1.80, indicating that the exchange regime approaches the fast limit. If kex and pB are fixed to the values extracted from fits of 15N RD profiles that include
only those exchanging amide nitrogens with the largest |Δϖ| values (13 residues were used) and 13C RD profiles fit again, the RMSD between |ϖ
Direct| and |ϖCPMG| decreases to 0.059
ppm (all residues; n=44) and 0.035 ppm (exchanging residues). The slope of the best-fit line that passes the origin becomes 1.02 ± 0.02 compared to 0.86 ± 0.02 for the unrestrained fit.
Figure 6. Correlation between |ΔϖDirect| and |ΔϖCPMG|, as in Figure 4, for an SH3 domain sample with ≈90 %
Ark1p peptide.
For both of the exchange conditions considered here the values of |ΔϖCPMG| correlate slightly
worse with |ΔϖDirect| than what we have obtained previously when experiments were
measured on samples prepared with [2-13C]-glucose as the carbon source. Then, an RMSD
between |ΔϖCPMG| and |ΔϖDirect| of 0.04 ppm (exchanging residues only) was obtained
study in comparison to 1.4 mM previously, the factor of two increase in concentration of 13C spins from the present labeling scheme leads to experimental data sets with similar signal-to-noise ratios in both cases. The slight increase in error (corresponding to approximately 0.02 ppm) may well derive from the increase in the fraction of 13Cα-13Cβ spin pairs, leading to artifacts and slightly erroneous values especially when dispersions are small (as in the present application). Nevertheless, in comparison with average Δϖ values for random-coil to α-helix or β-strand transitions, 3.1 ± 0.9 ppm and -0.9 ± 0.4 ppm respectively (Wang and Jardetzky 2002), it is clear that the errors are well within the tolerance level for the reliable analysis of changes in secondary structure. Moreover, they are also within the accuracy of current chemical shift prediction programs (Shen and Bax 2010). Thus, 13C shifts obtained in this manner can be used as restraints in structure calculations.
In summary, we have shown that protein expression using [2-13C]-glycerol as the carbon source doubles the concentration of 13C label at C relative to growths with [2-13C]-glucose.
However, unlike the case for [2-13C]-glucose, there is a detectable fraction of unwanted 13C -13C spin-pairs, especially for serine and residues for which serine is a precursor. Errors in 13C chemical shifts obtained from fits of RD profiles are small compared to tolerance levels
of current shift prediction programs. The present labeling strategy will be particularly useful for applications involving proteins that express poorly or that aggregate, where of necessity concentrations must be kept low and sensitivity, therefore, is limiting.
Acknowledgments
We thank Dr. Martin Singull, Linköping University, for stimulating discussions and SWEDSTRUCT and the Swedish NMR Center for generous access to their high-field spectrometers. This work was supported by a grant from the Swedish Research Council (Dnr. 2012-5136) to P.L. L.E.K holds a Canadian Research Chair in Biochemistry.
References
Ahlner A, Carlsson M, Jonsson BH, Lundström P (2013) PINT – a software for integration of peak volumes and extraction of relaxation rates. J Biomol NMR 56:191-202
Auer R, Neudecker P, Muhandiram DR, Lundström P, Hansen DF, Konrat R, Kay LE (2009) Measuring the signs of 1Ha chemical shift differences between ground and excited
protein states by off-resonance spin-lock R1r NMR spectroscopy. J Am Chem Soc
131:10832-3
Bouvignies G, Vallurupalli P, Hansen DF, Correia BE, Lange O, Bah A, Vernon RM, Dahlquist FW, Baker D, Kay LE (2011) Solution structure of a minor and transiently formed state of a T4 lysozyme mutant. Nature 477:111-U134
Bouvignies G, Vallurupalli P, Kay LE (2014) Visualizing side chains of invisible protein conformers by solution NMR. J Mol Biol 426:763-774
Carr HY, Purcell EM (1954) Effects of diffusion on free precession in nuclear magnetic resonance experiments. Phys Rev 94:630-638
Castellani F, van Rossum B, Diehl A, Schubert M, Rehbein K, Oschkinat H (2002) Structure of a protein determined by solid-state magic-angle-spinning NMR spectroscopy. Nature 420:98-102
Cavalli A, Salvatella X, Dobson CM, Vendruscolo M (2007) Protein structure determination from NMR chemical shifts. Proc Natl Acad Sci USA 104:9615-9620
Choy WY, Zhou Z, Bai YW, Kay LE (2005) An 15N NMR spin relaxation dispersion study of the folding of a pair of engineered mutants of apocytochrome b562. J Am Chem Soc
127:5066-5072
Delaglio F, Grzesiek S, Vuister GW, Zhu G, Pfeifer J, Bax A (1995) NMRPipe - a multidimensional spectral processing system based on unix pipes. J Biomol NMR 6:277-293
Dethoff EA, Petzold K, Chugh J, Casiano-Negroni A, Al-Hashimi HM (2012) Visualizing transient low-populated structures of RNA. Nature 491:724-728
Drubin DG, Mulholland J, Zhu ZM, Botstein D (1990) Homology of a yeast actin-binding protein to signal transduction proteins and myosin-I. Nature 343:288-290
Forsén S, Hoffman RA (1963) Study of moderately rapid chemical exchange reactions by means of nuclear magnetic double resonance. J Chem Phys 39:2892-2901
Geen H, Freeman R (1991) Band-selective radiofrequency pulses. J Magn Reson 93:93-141 Hansen DF, Vallurupalli P, Lundström P, Neudecker P, Kay LE (2008) Probing chemical
shifts of invisible states of proteins with relaxation dispersion NMR spectroscopy: How well can we do? J Am Chem Soc 130:2667-2675
Haynes J, Garcia B, Stollar EJ, Rath A, Andrews BJ, Davidson AR (2007) The biologically relevant targets and binding affinity requirements for the function of the yeast actin-binding protein 1 Src-homology 3 domain vary with genetic context. Genetics 176:193-208
Ishima R, Baber J, Louis JM, Torchia DA (2004) Carbonyl carbon transverse relaxation dispersion measurements and ms-ms timescale motion in a protein hydrogen bond network. J Biomol NMR 29:187-198
Ishima R, Torchia DA (2003) Extending the range of amide proton relaxation dispersion experiments in proteins using a constant-time relaxation-compensated CPMG approach. J Biomol NMR 25:243-248
Kimsey IJ, Petzold K, Sathyamoorthy B, Stein ZW, Al-Hashimi HM (2015) Visualizing transient Watson-Crick-like mispairs in DNA and RNA duplexes. Nature 519:315-320 Korzhnev DM, Religa TL, Banachewicz W, Fersht AR, Kay LE (2010) A transient and
low-populated protein-folding intermediate at atomic resolution. Science 329:1312-1316 Korzhnev DM, Salvatella X, Vendruscolo M, Di Nardo AA, Davidson AR, Dobson CM, Kay
LE (2004) Low-populated folding intermediates of Fyn SH3 characterized by relaxation dispersion NMR. Nature 430:586-590
LeMaster DM, Kushlan DM (1996) Dynamical mapping of E. coli thioredoxin via 13C NMR relaxation analysis. J Am Chem Soc 118:9255-9264
Lila T, Drubin DG (1997) Evidence for physical and functional interactions among two Saccharomyces cerevisiae SH3 domain proteins, an adenylyl cyclase-associated protein and the actin cytoskeleton. Mol Biol Cell 8:367-385
Loria JP, Rance M, Palmer AG, 3rd (1999) A relaxation-compensated Carr-Purcell-Meiboom-Gill sequence for characterizing chemical exchange by NMR spectroscopy. J Am Chem Soc 121:2331-2332
Lundström P, Hansen DF, Kay LE (2008) Measurement of carbonyl chemical shifts of excited protein states by relaxation dispersion NMR spectroscopy: comparison between uniformly and selectively (13)C labeled samples. J Biomol NMR 42:35-47 Lundström P, Hansen DF, Vallurupalli P, Kay LE (2009a) Accurate measurement of alpha
proton chemical shifts of excited protein states by relaxation dispersion NMR spectroscopy. J Am Chem Soc 131:1915-1926
Lundström P, Lin H, Kay LE (2009b) Measuring 13Cb chemical shifts of invisible excited states in proteins by relaxation dispersion NMR spectroscopy. J Biomol NMR 44:139-155
Lundström P, Teilum K, Carstensen T, Bezsonova I, Wiesner S, Hansen DF, Religa TL, Akke M, Kay LE (2007) Fractional 13C enrichment of isolated carbons using [1-13C]- or [2-13C]-glucose facilitates the accurate measurement of dynamics at backbone Ca and
side-chain methyl positions in proteins. J Biomol NMR 38:199-212
Lundström P, Vallurupalli P, Hansen DF, Kay LE (2009c) Isotope labeling methods for studies of excited protein states by relaxation dispersion NMR spectroscopy. Nat Protoc 4:1641-1648
Luz Z, Meiboom S (1963) Nuclear magnetic resonance study of the protolysis of trimethylammonium ion in aqueous solution-order of the reaction with respect to solvent. J Chem Phys 39:366-370
Meiboom S, Gill D (1958) Modified spin-echo method for measuring nuclear relaxation times. Rev Sci Instrum 29:688-691
Millet O, Loria JP, Kroenke CD, Pons M, Palmer AG, 3rd (2000) The static magnetic field dependence of chemical exchange linebroadening defines the NMR chemical shift time scale. J Am Chem Soc 122:2867-2877
Mulder FAA, Skrynnikov NR, Hon B, Dahlquist FW, Kay LE (2001) Measurement of slow (ms-ms) time scale dynamics in protein side chains by 15N relaxation dispersion NMR spectroscopy: Application to Asn and Gln residues in a cavity mutant of T4 lysozyme. J Am Chem Soc 123:967-975
Neudecker P, Robustelli P, Cavalli A, Walsh P, Lundström P, Zarrine-Afsar A, Sharpe S, Vendruscolo M, Kay LE (2012) Structure of an intermediate state in protein folding and aggregation. Science 336:362-366
Palmer AG, 3rd, Kroenke CD, Loria JP (2001) Nuclear magnetic resonance methods for quantifying microsecond-to-millisecond motions in biological macromolecules. Methods Enzymol 339:204-238
Rath A, Davidson AR (2000) The design of a hyperstable mutant of the Abp1p SH3 domain by sequence alignment analysis. Protein Sci 9:2457-2469
Santoro J, King GC (1992) A constant-time 2D Overbodenhausen experiment for inverse correlation of isotopically enriched species. J Magn Reson 97:202-207
Shen Y, Bax A (2010) SPARTA plus : a modest improvement in empirical NMR chemical shift prediction by means of an artificial neural network. J Biomol NMR 48:13-22 Shen Y, Lange O, Delaglio F, Rossi P, Aramini JM, Liu GH, Eletsky A, Wu YB, Singarapu
KK, Lemak A, Ignatchenko A, Arrowsmith CH, Szyperski T, Montelione GT, Baker D, Bax A (2008) Consistent blind protein structure generation from NMR chemical shift data. Proc Natl Acad Sci USA 105:4685-4690
Skrynnikov NR, Dahlquist FW, Kay LE (2002) Reconstructing NMR spectra of "invisible" excited protein states using HSQC and HMQC experiments. J Am Chem Soc 124:12352-12360
Vallurupalli P, Bouvignies G, Kay LE (2013) A computational study of the effects of 13C-13C scalar couplings on 13C CEST NMR spectra: Towards studies on a uniformly 13C labeled protein. Chembiochem 14:1709-1713
Vallurupalli P, Hansen DF, Kay LE (2008) Structures of invisible, excited protein states by relaxation dispersion NMR spectroscopy. Proc Natl Acad Sci USA 105:11766-11771 Vallurupalli P, Hansen DF, Stollar E, Meirovitch E, Kay LE (2007) Measurement of bond
vector orientations in invisible excited states of proteins. Proc Natl Acad Sci USA 104:18473-18477
Wang YJ, Jardetzky O (2002) Probability-based protein secondary structure identification using combined NMR chemical-shift data. Protein Sci 11:852-861
Voet D, Voet JG (1995). Biochemistry, John Wiley & Sons, Inc., Hoboken, p
Vuister GW, Bax A (1992) Resolution enhancement and spectral editing of uniformly 13C enriched proteins by homonuclear broad band 13C decoupling. J Magn Reson 98:428-435
Fractional enrichment of proteins using [2-
13C]-glycerol as the
carbon source facilitates measurement of excited state
13C
chemical shifts with improved sensitivity
Alexandra Ahlner1, Cecilia Andresen1, Shahid N. Khan1, Lewis E. Kay2,3 and Patrik
Lundström1,*
1Division of Molecular Biotechnology, Department of Physics, Chemistry and Biology,
Linköping University, SE-58183 Linköping, Sweden
2Departments of Molecular Genetics, Biochemistry and Chemistry, The University of
Toronto, One King’s College Circle, Toronto, Ontario M5S 1A8, Canada
3Hospital for Sick Children, Program in Molecular Structure and Function, 555
University Avenue, Toronto, Ontario, M5G 1X8, Canada
Figure S1. 13Cα dispersion profiles for all residues with significant chemical exchange in
an Abp1p SH3 domain that interconverts between free and Ark1p peptide bound forms (≈5% bound Ark1p peptide is present). The SH3 domain was produced with [2-13
C]-glycerol as the sole carbon source. Red (blue) symbols denote data points recorded at 14.1 (18.8) T, 25°C, and the solid lines are a global fit to the data, assuming a model of two-site chemical exchange.
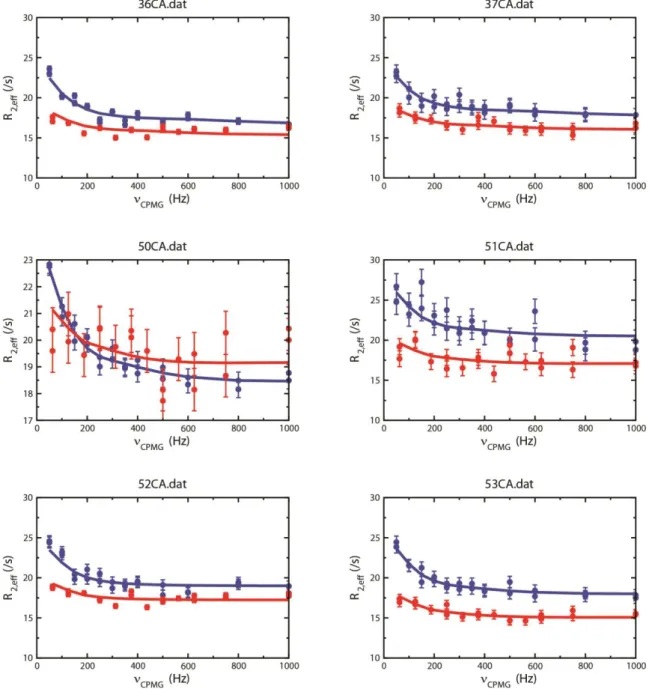
Figure S2. 13Cα dispersion profiles for all residues with significant chemical exchange in
an Abp1p SH3 domain that interconverts between free and Ark1p peptide bound forms (≈90% bound Ark1p peptide is present). The SH3 domain was produced with [2-13
C]-glycerol as the sole carbon source. Red (blue) symbols denote data points recorded at 14.1 (18.8) T, 25°C, and the solid lines are a global fit to the data, assuming a model of two-site chemical exchange.

![Figure 2. Interplay of biosynthetic pathways leading to 13 Cα- 13 Cβ spin pairs when [2- 13 C]-glycerol is the carbon source during protein overexpression](https://thumb-eu.123doks.com/thumbv2/5dokorg/5396598.137956/12.892.116.758.107.1007/figure-interplay-biosynthetic-pathways-leading-glycerol-protein-overexpression.webp)