Rate as the relation of changes
in two quantities
– A variation theory perspective of
learning rate of change
Research Report
Per Håkansson
Jönköping University
School of Education and Communication Research Reports No. 12 • 2020
Rate as the relation of changes
in two quantities
– A variation theory perspective of
learning rate of change
Research Report
Per Håkansson
Jönköping University
School of Education and Communication Research Reports No. 12 • 2020
Licentiate Thesis in Didactics
Rate as the relation of changes in two quantities
– A variation theory perspective of learning rate of change Research Reports No.12
© 2020 Per Håkansson Published by
School of Education and Communication, Jönköping University P.O. Box 1026
SE-551 11 Jönköping Tel. +46 36 10 10 00 www.ju.se
Printed by Stema Specialtryck AB ISBN printed version 978-91-88339-23-2 ISBN online version 978-91-88339-24-9
Trycksak 3041 0234
Rate as the relation of changes in two quantities
A variation theory perspective of learning rate of change
Acknowledgements
Writing this thesis has involved making a lot of decisions, and in many cases I have made them on basis of my experiences from working with other people. In this sense, my work is therefore certainly not one only of my own. A whole bunch of people has been by my side along a sometimes quite bumpy road. Here, I would like to express my gratitude to some of them.
My main supervisor Robert Gunnarsson. You have encouraged me to leave no stone unturned, to always look for what might be revealed underneath. You have helped me to balance my workload and personal well-being, and I am very grateful for that.
My supervisor Ulla Runesson Kempe. During this journey, you have been by my side longer than anyone else. When I am not able to swim, you throw me in the water and force me to float. But you never ever leave me drowning. My fellow doctoral students in the Research school Learning study. You have given me endless input at our seminars. And afterwards.
Ingrid Carlgren and Inger Eriksson. You have both helped me to widen my perspectives of knowledge, teaching and learning.
My teacher colleagues. Without you, this would have been impossible. I love you guys.
The MER group at Jönköping University. Thank you for letting me take part of your gathered competence.
Anne Watson and John Mason. You welcomed me to Oxford with open arms and shared your wise thoughts on mathematics. Many thanks! I will forever remember our coffee break at The Buttery. And a grumpy bus driver.
Eva Carlander. You put a lot of trust in me. You made it possible for me to act on two arenas simultaneously. Thank you.
Andreas Eckert and Martin Hugo. You both contributed with valuable responses on my thesis. Many thanks.
Clare Lindström. You have always responded carefully to my questions about the English language. Thank you.
The Research School in Learning Study at Jönköping University, the Swedish Research Council and the municipality of Skövde. Thank you for your funding support which made it possible for me not only to write this thesis, but also to attend conferences and go to places which I would not otherwise have visited. Last but not least, Jenny, Måns, Malva and Lova. Thank you for allowing me to lose myself in this project. In this thesis, the word ‘change’ appears 174 times. In some of these cases it is preceded by ‘rate of’. In others, it refers to other phenomena. In retrospective, this piece of text has allowed me to discern many ways in which change could be experienced. Change as growing older, becoming wiser. Change as fluctuating between hope and despair. Change as going from appreciating the presence of good friends, to missing them. Change as travelling from grieving, to enjoying memories of, what once was. But most of all, this thesis has allowed me to discern a change in how I experience my experiences of the world. For this I am grateful, and it would not have been possible without you. You have been patient to a degree beyond reason. I love you all.
Skövde, March 2020 Per Håkansson
Abstract
This thesis comprises three original papers about learning rate of change in school mathematics. The overall aim of the thesis is to contribute with knowledge in this particular area of research. Within this aim, each of the original papers contribute with its own perspective. The theoretical framework used in the thesis is variation theory of learning (Marton & Booth, 1997; Marton, 2015), by which learning is seen as experiencing a phenomenon in a new way. This theoretical point of departure is reflected in the research question of the thesis: What is critical to discern to use and express rate as a
measure of the relation of changes in two quantities? The empirical study was
conducted as a learning study (Pang & Marton, 2003). A learning study is an iterative, interventional research arrangement in which teachers and researchers collaboratively explore a specific ability, the object of learning, worthwhile for the students to learn. The object of learning related to this thesis, ‘to express the quantitative rate of change of a linear relation’, was explored in a series of three research lessons at a secondary school. Data consists of students’ responses to written pre- and post-tests, and lesson videos. Some data have been analysed during the on-going empirical study and some data have been analysed after it was concluded. Principles from variation theory have been used as tools for analysis throughout the study. Main results of Paper I demonstrate how two critical aspects are identified and revised through the process of learning study. In Paper II the results indicate that qualitatively different questions in a task may affect students’ ways to relate changes in two quantities. The results of Paper III suggest how different perspectives of slope may promote homogeneity as an aspect of rate. Results also comprise six critical aspects of the object of learning, four of which was identified by revisiting the results of Paper II. In summary, the critical aspects also specify the meaning of a covariational perspective of rate. Results are discussed in relation to previous educational research about rate of change, covariation of quantities and students’ conceptions of rate and slope. Further research directions are suggested.
Keywords: rate of change, slope, covariation, functions, mathematics teaching and learning, variation theory, learning study
Svensk sammanfattning
Den här sammanläggningsuppsatsen omfattar tre artiklar om förändringstakt i matematik. Uppsatsens övergripande syfte är att bidra med kunskap till detta specifika forskningsfält. Inom ramen för detta syfte bidrar var och en av de tre artiklarna med sitt eget perspektiv. Det teoretiska ramverket i uppsatsen är variationsteori (Marton & Booth, 1997; Marton, 2015). Ur detta teoretiska perspektiv ses lärande som ett erfarande av ett fenomen på ett nytt sätt. Denna teoretiska utgångspunkt har färgat uppsatsens övergripande forskningsfråga:
Vad är kritiskt att urskilja för att använda och uttrycka förändringstakt som ett mått på relationen mellan förändringar i två storheter? Den empiriska
studien genomfördes som en learning study (Pang et al., 2003). Learning study är en iterativ, intervenerande forskningsansats där lärare och forskare i samarbete utforskar en specifik förmåga, lärandeobjektet, något som är värdefullt för elever att lära sig. Lärandeobjektet som behandlas i denna uppsats, ’att uttrycka förändringstakten i en linjär relation kvantitativt’, utforskades i en serie av tre lektioner på en högstadieskola. Data består av elevers svar till skriftliga uppgifter i för- och eftertest, samt videoinspelade lektioner. Data har analyserats både under den pågående empiriska studien, och efter att den avslutades. Principer från variationsteori har använts som analysverktyg genom studiens gång. Huvudresultaten av Artikel I visar hur två kritiska aspekter identifieras, revideras och förfinas genom learning study som process. I Artikel II tyder resultaten på att kvalitativt olika frågor i en uppgift påverkade elevernas sätt att relatera förändringar i två storheter. Resultaten i Artikel III visar hur olika perspektiv på lutningen hos en graf kan föra fram homogenitet som en aspekt av förändringstakt. Uppsatsens resultat omfattar framför allt sex aspekter som är kritiska att urskilja för att utveckla förmågan att använda och uttrycka förändringstakt som ett mått på relationen mellan förändringar i två storheter. Fyra av dem identifierades då resultaten av Artikel II tolkades utifrån ett variationsteoretiskt perspektiv. Som helhet specificerar också de kritiska aspekterna innebörden av ett samvarierande perspektiv på förändringstakt. Resultaten diskuteras i förhållande till tidigare forskning om lärande om förändringstakt, samvariation mellan storheter och elevers uppfattningar av lutning. Några vidare forskningsriktningar pekas ut. Nyckelord: förändringstakt, lutning, samvariation, funktioner, matematiklärande, variationsteori, learning study
Appended papers
Paper I
Gunnarsson, R., Runesson, U, & Håkansson, P. (2019). Identifying what is critical for learning ‘rate of change’: Experiences from a learning study in Sweden. In R. Huang, A. Takahashi, & J. P. da Ponte (Eds.), Theory and
practice of lesson study in mathematics: An international perspective (pp.
441-456). Cham: Springer.
Paper II
Håkansson, P. & Gunnarsson, R. (2018). Frågan är vad frågan gör – olika frågeställningars betydelse för hur elever uttrycker och använder förändringstakt i matematik [The question is what the question does – the impact of different types of questions on how students use and express rate in mathematics]. Forskning om undervisning och lärande, 6(2), 44-62.
Paper III
Håkansson, P. (manuscript). Different perspectives of slope and students’ discernment of homogeneity in rate of change. Submitted to Educational
Contents
1 Introduction 1
2 Previous research 3
2.1 Rate and derivative 3
2.2 Covariation and correspondence of quantities 5
2.3 Rate and ratio 7
2.4 Students’ conceptions of rate 9 2.5 Conceptual and procedural approaches to rate of change as slope 10 2.6 The present study in light of previous research 13
3 Aim of the thesis 15
4 Theoretical and methodological frameworks 16 4.1 Variation theory of learning 16 4.1.1 Object of learning and critical aspects 17 4.1.2 Identifying critical aspects 18
4.2 Learning study 19
4.2.1 Learning study as research approach 20 4.2.2 Learning study as research arrangement 21
5 Methods 24
5.1 Design of the learning study 24 5.1.1 The object of learning, pre- and post-tests 24 5.1.2 Settings and participants 25
5.1.3 Lesson settings 27
5.2 Overview of data and analysis 28 5.3 Analysis during the learning study 29 5.3.1 Analysis of pre- and post-tests 30 5.3.2 Two tentative critical aspects 30 5.3.3 Analysis of lesson video 33
5.4 Analysis after the learning study 34 5.4.1 Analysis of students’ responses to task 2 in the pre-test 34 5.4.2 Analysis of how students experienced slope as invariant in the
lessons 36
5.5 Ethical considerations 39
6 Results 40
6.1 Paper I 40
6.2 Paper II 42
6.2.1 Students responses to the comparative question 43 6.2.2 Students responses to the evaluative question 44
6.3 Paper III 45
6.4 Revisiting the results of Paper II 46 6.5 Summary of the results in terms of critical aspects 50
7 Conclusions and discussion 52
7.1 Critical aspects identified in a diagram context 53 7.1.1 Critical aspect 1: to discern slope as invariant from a both visual and analytic perspective simultaneously 53 7.1.2 Critical aspect 2: to separate changes starting in origin from other
changes 54
7.2 Critical aspects identified in a non-diagram context 55 7.3 Differentiation of rate and ratio 57 7.4 Implications for teaching 60 7.5 Implications for research 60
7.6 Validity of the results 61
8 Summary of appended papers 64
8.1 Summary of Paper I 64
8.2 Summary of Paper II 64
8.3 Summary of Paper III 65
9 References 66
1
1 Introduction
In this thesis, I explore students’ learning of rate of change in contexts with, and without graphs. I adopt the perspective of variation theory, in which learning is seen as experiencing a phenomenon in a new way (Marton & Booth, 1997; Marton, 2015). With this as a theoretical departure, I study what must be discerned to calculate the rate of change as the difference quotient from a linear graph. In situations without graphs, I focus on what is critical to use and express rate of change as a single intensive quantity. Regardless of context, at the centre of the thesis lies the meaning of the ability to use and express the rate of change as a description of how one quantity changes in relation to another.
While other theoretical approaches dominate in previous research on rate, principles from variation theory have here been used to investigate students’ learning of rate of change. In this thesis, two concepts are therefore central:
critical aspects and discernment. Critical aspects are aspects which, if they are
discerned by the learner, qualitatively change the learners experience of what is to be learned (Marton & Booth, 1997). This perspective implies that to learn something, one must discern new aspects of it.
Although there are several different conceptual views of rate in mathematics education research, the connection between rate of change and covariation of two quantities has been emphasised since the mid 1990’s. For example, rate of change is involved in a five-level framework of covariational reasoning suggested by Carlson, Jacobs, Coe, Larsen, and Hsu (2002). Since then, students’ conceptualizing of rate of change has also been distanced from their covariational reasoning, on basis that it would require also additional concepts, such as ratio, quotient and proportionality (Thompson & Carlson, 2017). The connections between students’ conceptions of rate of change and their reasoning about covarying quantities has been further explored by Johnson (2012, 2015a, 2015b). The theoretical points of departure in this line of research mainly connects to a constructivist view of learning. As such, it has been focused on students’ conceiving of, and mental operations related to, rate, ratio and other concepts.
2
In contrast, I suggest that students’ experiences of rate as a description of how two quantities change together can be explored from a perspective focusing on students’ discernment. I do not intend to investigate students’ conceptualization of rate ‘as is’, but instead what must be discerned to experience rate as a meaningful description of how one quantity change in relation to another.
The rationale for this thesis is the need for research on students’ difficulties to use and express rate of change in a mathematically consistent and meaningful way. Rate has many relations to other concepts in mathematics and previous findings suggest that the conceptual knowledge of rate may be poor, not only among students in secondary school, but also among calculus students (Carlson et al., 2002; Teuscher & Reys, 2012; Oehrtman, Carlson & Thompson, 2008). Although research about students’ different conceptions of rate and covarying quantities have contributed with useful theoretical descriptions (see, e.g. Carlson et al., 2002; Johnson, 2015a; Thompson et al., 2017), frameworks of this kind are not explicitly related to learning situations. In contrast, variation theory can be used to explore how students discern certain aspects of what is to be learned in a classroom situation.
The thesis is framed within an interventional study, which was conducted by me as a teacher-researcher and two other mathematics teachers. The intervention was arranged as a learning study (Pang et al., 2003) with a series of three lessons. Collaboratively, we investigated what is critical for students to discern to develop their ability to quantitatively express the rate of change of a linear relation. Hence, our approach allowed us to study what was possible for the students to discern during lessons, and how specific aspects discerned by the students might be critical.
In this compilation thesis, three appended papers (see appendices 1-3) each contribute with a different perspective of rate of change in mathematics education research. Paper I describes how two critical aspects were identified and refined through the learning study. Paper II investigates the impact of qualitatively different questions on students’ ways to relate changes in two quantities. In Paper III, students’ possibilities to discern homogeneity in rate through the use of different perspectives of slope is explored.
3
2 Previous research
Previous educational research on rate of change is very tightly related to research on other concepts, such as derivative, covariation, ratio and slope. This chapter is organized accordingly. It is aimed to present a picture of the field, relevant for the direction of the thesis.
2.1 Rate and derivative
The transition from school algebra to calculus typically involves the introduction of concepts like limit and derivative. Understanding rate of change has been acknowledged as central for learning these and other calculus concepts, such as accumulation and the fundamental theorem of calculus, (Thompson, 1994a: Thompson & Silverman, 2008; Weber, Tallman, Byerley & Thompson, 2012).
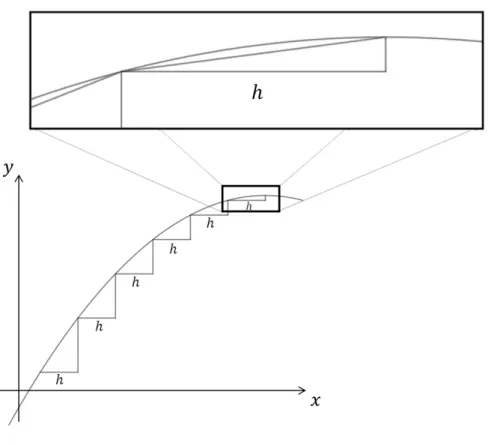
The limit concept is foundational to the formal definition of derivative, (see, e.g. Adams & Essex, 2017). However, the relevance and usefulness of limit ideas in students’ initial learning about derivatives has been called into question. Consequently, ways to introduce derivatives without the explicit notion of limit have been proposed. Tall (1992) argues that what is required to achieve progress in mathematics itself (mathematical foundations), is not necessarily what is required to make progress in the learning of mathematics (cognitive roots). Claiming that the concept of limit is a poor cognitive root for introducing differentiation, instead magnifying non-linear graphs until they locally ‘look straight’, has been suggested (Tall, 1992). Similarly, Weber et al. (2012) advocates for an introduction of derivative in which the concept of limit is deliberately omitted. Relying on previous findings by Tall (1986) and Ubuz (2007), these researchers point to students’ lack of connections between the derivatives they computed and evaluated, and a function’s rate of change at specific points (Weber et al., 2012). In an approach called the ‘calculus triangle’, the idea is that students are introduced to a ‘rate of change-function’ before they encounter the formal definition of derivative. By magnifying the graph of a non-linear function, several small calculus triangles are visualized and their legs consist of two associated intervals of the variables, see Figure 1.
4
Figure 1. Calculus triangles along a non-linear graph.
The slope of the hypotenuse in each calculus triangle approximately resembles the local slope of the original function. More importantly, the slope represents the ratio of the two legs. The (average) rate of change can then be systematically evaluated for each calculus triangle, and a series of outputs is created. Each of these rates is associated to the left endpoint of the corresponding interval of the x-variable as input. Thus, a “rate of change-function” is created, in which values of x are connected to specific rates of change: 𝑟𝑟𝑓𝑓(𝑥𝑥) =𝑓𝑓(𝑥𝑥+ℎ)−𝑓𝑓(𝑥𝑥)ℎ (Weber et al. 2012). Notably, the interval h is kept constant while x is varied. Since x is varied, the behaviour of the function for a continuum of input values can be considered. This directly connects to one of two ‘dynamic reasoning abilities’, suggested to be tightly linked to students’ success in tasks about functions (Oehrtman et al., 2008) Oehrtman et al. (2008) claims that students
5
…must be able to attend to both the changing value of output and rate of its change as the independent variable is varied through an interval in the domain.
(Oehrtman et al., 2008, p. 30)
The rate of change function created in the calculus triangle approach, is an approximation to the derivative function and should be acknowledged as such. Still it has been suggested that its inherent process of varying 𝑥𝑥 should precede the process in which ℎ approaches zero, and thus the limit concept, in the introduction of derivative (Weber et al., 2012; Thompson, Byerley, Hatfield, 2013). This is coherent with the idea of limit as a poor cognitive root for the beginning stages of calculus, although it has been a powerful foundation in the historical development of mathematical concepts (Tall, 1992).
2.2 Covariation and correspondence of quantities
Thompson (1994a) suggests that a mature image of rate involves the idea of covariation of two quantities’ accruals. The importance of covariation to students’ understanding of rate of change, functions and other concepts in calculus has since been supported by considerable research (Thompson et al., 2008; Oehrtman et al., 2008; Thompson et al., 2017). The notion of function as a correspondence between between variables and later as a mapping between sets, developed during the 20th century (Cooney & Wilson, 1993).
But this development was based on reasons originating in the mathematics discipline (Kleiner, 1989; Sfard, 1992; Sierpinska, 1992). While the correspondence meaning of function was convenient to mathematicians, it has also been claimed to bring problems to students in school mathematics (Tall, 1992; Thompson et al., 2017). The instructional use of a function definition which do not involve variable magnitudes has been criticised.
The most fundamental conception of a function is that of a relationship between variable magnitudes. If this is not developed, representations such as equations and graphs lose their meaning and become isolated one from the other. A deviation from the genetic line is made. Introducing functions to young students by their elaborate modern definition is a didactical error – an antididactical inversion (cf. Freudenthal, 1983).
6
The contrast between coordination of particular elements in sets, and that of changes in variables, has further been reflected in research about students’ ways of thinking about functions. A correspondence approach is based on a rule through which a unique y-value can be obtained from any given x-value, hence a correspondence between values is built. In contrast, a covariational approach “entails being able to move operationally from 𝑦𝑦𝑚𝑚 to 𝑦𝑦𝑚𝑚+1 coordinating with movement from 𝑥𝑥𝑚𝑚 to 𝑥𝑥𝑚𝑚+1” (Confrey & Smith, 1994, p. 137). In a table, this would involve the coordination of the variation along each of two or more columns as one moves up or down the table. In contrast with Confrey et al. (1994), a continuous perspective on covariation has been put forth, (see, e.g. Saldanha & Thompson, 1998). From this point of view, the notion of covariation includes the coordination of not only discrete changes between values in two columns in a table, but also of all intermediate values. Similar to these two perspectives on covariation, Castillo-Garsow, Johnson & Moore (2013) use the terms chunky and smooth images of change for how two students envision covariation of two quantities. Castillo-Garsow and colleagues stress that a smooth image of change is not the same as a chunky image cut up in small pieces. Rather, smooth should be interpreted as on-going and continuous.
Carlson et al. (2002) defines covariational reasoning as “the cognitive activities involved in coordinating two varying quantities while attending to the ways in which they change in relation to each other” (p. 354). These authors also propose a covariation framework which describes five levels of covariational reasoning. The second most advanced level in the framework involved the coordination of the average rate of change of the function with uniform increments of change in the input variable. In the most advanced level, the instantaneous rate of change of the function is coordinated with continuous changes in the input variable. Thus, average and instantaneous rate of change was regarded parts of an advanced covariational perspective on functions.
The third level of the covariational framework proposed by Carlson et al. (2002) consists in coordinating an amount of change in one variable with the amount of change in the other variable. However, according to Johnson (2015a), this third level in the framework by Carlson et al. (2002), does not account for certain differences in how students may relate changes in the
7
variables. Students’ may reason in terms of chunky or smooth covariation, compare or coordinate changes in two variables, and quantify rate in terms of extensive or intensive quantities. Still, their reasoning would not necessarily involve either average or instantaneous rate of change and would therefore all be referred to as level 3 covariational reasoning (Johnson, 2015a). In the “Change in covarying quantities framework”, the quantitative operations (Thompson, 1994b) of comparing changes in quantities and coordinating changes in quantities are distinguished from each other (Johnson, 2015a). When a student is comparing changes, she associates a change in one variable with a change in another variable, but in a ‘static’ way as if they were chunky pieces, merely corresponding each other. However, there is no evidence that the student envisions the changes as ‘ongoing’. When a student is coordinating changes, she instead demonstrates a view of the changes as jointed in a dynamic ‘move’. According to Johnson (2015a), comparing changes involves the use of extensive quantities and a chunky image of change, while coordinating quantities affords the use of intensive quantities and a smooth image of change. A significant difference lies in what is central for a student who use comparison or coordination, respectively. When changes are compared, the intervals themselves are central. When changes are coordinated, the relation between the changes are considered (Johnson, 2015a). In the “Change in covarying quantities framework” it is also suggested that a coordination of changes and smooth covariational reasoning is connected to the use of intensive quantities and rates, while comparing changes and chunky covariational reasoning typically involve extensive quantities and ratios (Johnson, 2015a).
2.3 Rate and ratio
In addition to a covariational perspective on the relation between two quantities, understanding rate of change has also been suggested to involve learners’ conceptualisation of ratio (Thompson et al., 2017). However, the difference between rate and ratio have not been unambiguously agreed upon in previous research. Early distinctions involved whether the comparison is made within or across different measure spaces. According to this, the comparison is considered a ratio if the two compared measures are of the same quantity (e.g. distance : distance). If they are not (e.g. weight : distance) the comparison is considered to be a rate. From this distinction, it follows that a
8
ratio cannot have a unit, while a rate must have a unit. Rate has also been distinguished from ratio based on time as one of the two compared quantities (e.g. distance : time) (Lamon, 2007). Rather than focusing on the nature of quantities involved, the concepts of ratio and rate has been distinguished from each other also by how they involve the ideas of accumulation or homogeneity. When two quantities change proportionally, the ratio of the quantities can be conceived as a particular ratio or as a rate-ratio (Kaput & West, 1994). When preparing 5 dl of a juice drink, 1 dl of concentrated juice could be mixed with 4 dl of water. If a larger amount, for example 10 dl, of the same type of drink is to be prepared, each 5 dl of juice drink requires the same particular amounts of concentrated juice (1 dl) and water (4 dl). One would therefore need to accumulate the double amount of each ingredient (2 dl of concentrated juice and 8 dl of water). This accumulation procedure is based on accumulation of the particular ratio: concentrated juice : water = 1 ∶ 4. But the ratio of concentrated juice and water could also be conceived as applicable on any amount of the juice drink. In this case, the (rate-)ratio is a
general description of the recipe, 1 (any-sized) part of concentrated juice
should be mixed with every 4 (equally-sized) parts of water, regardless the volume of each (equal) part, and the amount of fruit drink that is to be prepared. From this view, the homogeneity of the mixture is primary, and particular ratios are subordinate to the rate-ratio, as a general description of how to prepare the fruit juice. Kaput et al. (1994) argue that in addition to equivalence across particular ratios (such as 1 ∶ 4 and 2 ∶ 8), the idea of homogeneity is an important part of a genuine rate concept.
Besides the invariance implied by the notion of homogeneity, conceptualizing rate has also been suggested to require the idea of variation. However, different types of variation are involved. Arguing that all non-linear functions exhibit varying rates of change, Confrey et al. (1994) claims recognizing
variation of rate itself as essential for the transition to calculus. In contrast,
Kaput et al. (1994) suggests variation in ratios as beneficial to notice the equivalence across particular ratios.
Thompson (1994b) defines rate as a “reflectively abstracted constant ratio” (p. 192), and he suggests that the difference between rate and ratio lies closer to people’s apprehension than to the situation per se. What separates rate from
9
ratio then becomes an issue of whether a person comprehends the unique homogeneity that can be represented by different ratios:
A rate, as a reflectively abstracted constant ratio, symbolizes that structure as a whole, but gives prominence to the constancy of the result of the multiplicative comparison.
(Thompson, 1994b, p. 192)
Hence, in this sense, rate allows both compared quantities to vary while, at the same time, homogeneity is central.
Thompson’s (1994b) perspective on the concepts of ratio and rate is related to extensive and intensive quantities. While extensive quantities (for example mass or length) can be directly measured, intensive quantities (for example density or speed) can only be measured indirectly (Schwartz, 1988). Similar to Thompson’s (1994b) distinction between ratio and rate, what to one person is a ratio between two extensive quantities, may to another person be one, intensive quantity. This has since been corroborated by Johnson’s (2012, 2015a, 2015b) research on students’ reasoning about covarying quantities. Johnson (2012) argues that since intensive quantities cannot be measured directly, these are more difficult to conceptualize and use. Further, Johnson (2012) asserts that “When conceived of as an intensive quantity, rate of change measures the intensity of a multiplicative relationship between varying quantities” (p. 314).
2.4 Students’ conceptions of rate
In previous research about how students understand and use rate, it has frequently been represented by the slope of graphs (see, e.g. Castillo-Garsow et al., 2013). However, other representations have also been used, for example tables with corresponding values and amounts of changes in two covarying quantities. For example, Ayalon, Watson and Lerman (2015) report on how tables, in which non-uniform changes are displayed, may reveal students’ capabilities to use a rate concept before they had been taught about this idea. Theoretically closer to this study, Herbert and Pierce (2012) have used a phenomenographic approach (Marton, 1988) to explore different categories of experiencing rate. From interviews with 20 Australian year 10-students, eight
10
hierarchically ordered categories emerged in the study. The differences between these categories were analysed, and four aspects of rate were stated as ‘educationally critical aspects’, (ECA):
ECA 1. Rate as a relationship between changes in two quantities
ECA 2. Rate as a relationship between changes in two quantities which may vary
ECA 3. Rate as a numerical relationship between changes in two quantities which may vary
ECA 4. Rate as a numerical relationship between changes in two quantities which may vary and is applicable to any context
All of the ECA found by Herbert et al. (2012) involve rate as a relationship between changes in two quantities, but also states certain features of such a relationship. These ECA also corroborates previously made assertions of what is necessary for a mature conceptualization of rate. For example, Confrey et al. (1994) suggest variation in rate itself (ECA 2) as important. ECA 3, emphasises rate as a numerical relationship, and connects to Johnson’s (2015a) work with exploring students’ quantification of ratio and rate through the ‘Change in covarying quantities framework’. However, in contrast with the ECA suggested by Herbert et al. (2012), Johnson (2015a) relies upon the idea of quantification proposed by Thompson (2011), which is not necessarily numerical.
2.5 Conceptual and procedural approaches to rate of
change as slope
Procedural knowledge has been described as constituted by two components. One of these consists in recognising the symbols that represent mathematical ideas in a formal language of mathematics. The other component involves the rules through which mathematical tasks can be solved. In contrast with procedural knowledge, conceptual knowledge can instead be thought of as a
11
network of concepts, where the relationships that link the concepts together are as prominent as the concepts themselves. (Hiebert & Lefevre, 1986). The distinction between procedural and conceptual knowledge goes beyond the ostensible dichotomy of ‘procedures’ and ‘concepts’, because a procedure can be performed from mere rote learning, and it can be performed on basis of conceptual knowledge of what is represented by the symbols in the procedure. These two perspectives on mathematical knowledge corresponds to the terms relational and instrumental understanding (Skemp, 1976), respectively. While knowledge in mathematics can be examined with a focus on procedures and concepts, considerable attention has also been paid to relations between them. Hiebert and Wearne (1986) suggest that links between procedural and conceptual knowledge is what characterises mathematical competence. Similarly, it has been argued that an operational and a structural conception of a mathematical notion, are two facets of the same thing (Sfard, 1991). This perspective involves the two different conceptions of a mathematical idea as inseparable and complementary, rather than separated into different types of mathematical knowledge. Similarly, Gray and Tall (1994) use the notion of ‘procept’ in an attempt to deal with processes versus concepts in mathematics: “An elementary procept is the amalgam of three components: a process that produces a mathematical object, and a symbol that represents either the process or the object” (Gray et al., 1994, p 121).
Procedural knowledge of slope could involve the ability to calculate the difference quotient, 𝑦𝑦2−𝑦𝑦1
𝑥𝑥2−𝑥𝑥1. Conceptual knowledge of slope covers the
relationship between the slope of a linear graph, and the rate of change represented by the slope. A student who possess procedural knowledge of slope, has a proficiency to calculate it as the difference quotient. A student with conceptual knowledge of slope may interpret it to make assertions about the rate it represents. Connecting the difference quotient to properties of rate then is a way to connect procedural and conceptual knowledge about slope as representing rate of change. However, slope as a representation of rate of change has been found difficult for students of various ages and on different levels of the school system (Nagle, Moore-Russo, Viglietti & Martin, 2013; Stump, 2001; Weber et al., 2012). For example, a study by Teuscher et al. (2012) revealed a “lack of understanding of the interpretation or meaning of rate of change” among high school students, although they had completed college preparatory courses in mathematics including geometry, algebra and
12
precalculus. Even though the students successfully calculated the rate of change of linear functions, they could not identify where in a graph of a piecewise linear function the rate was equal to 2.
Similar results have been observed among high performing calculus students in relation to the most advanced level of the covariation framework (Carlson, et al., 2002; Oehrtman et al., 2008).
Students frequently exhibited behaviors that gave the appearance of engaging in Mental Action 5 (e.g., construction of a smooth curve with the correct shape), however when prompted to explain their reasoning, they expressed that they had relied on memorized facts to guide their constructions. They were relying on apparent facts such as “faster means steeper” and “slower means less steep,” but they were unable to explain why this was true.
(Oehrtman et al., 2008, p. 37)
In line with these findings, connections made by secondary school students also between a constant rate of change and an invariant slope of a graph may rely upon memorized facts, rather than linking the concepts of rate and slope together (Orton, 1983). Notably, students’ struggles to relate the concepts of rate and slope have been observed also in the case of linear graphs.
In addition to previously found conceptualizations of slope (see for instance Stump (1999, 2001)), Moore-Russo, Conner and Rugg (2011) identified a conception of slope as a linear constant property:
Slope is the fixed property that remains unchanged under translation. It is the one unique property that gives a figure its “straightness”, and it is a constant property that is present in al representations of linear functions.
(Moore-Russo et al., 2011, p. 19)
The conception of slope as a linear constant property has been related to the procedure of choosing any two points on a graph to calculate the slope (Cho & Nagle, 2017). These researchers also suggest a conceptual underpinning associated to this procedure: “Slope is independent of the points chosen, since the ratio of change between the dependent and independent variables is constant” (Cho et al., 2017, p. 148). This conforms with the calculus triangle approach to derivative (Weber et al., 2012), since it aims to offer students
13
possibilities to see that one can imagine a calculus triangle at every single point on a graph of a function. This issue has not only recently been considered pivotal for learning rate of change as slope: “The student must accept that the ratio 𝑦𝑦𝑥𝑥 is the same whatever the triangle, as long as the hypotenuse lies along the given line” (Orton, 1983, p. 238).
2.6 The present study in light of previous research
Previous research suggests connections between students’ success and difficulties in calculus, especially considering derivative, and their learning of rate of change prior to formal calculus (see, e.g. Dorko & Weber, 2013; Oehrtman et al., 2008; Teuscher et al., 2012; Thompson et al., 2008; Weber et al., 2012). Increased knowledge about students’ learning of rate of change may therefore be relevant also to research about students’ learning in higher mathematics.
The frameworks suggested by Carlson et al. (2002), Johnson (2015a) and Thompson et al. (2017), are important theoretical descriptions of students’ ways to reason about covarying quantities and rate of change. As such they are highly relevant to educational research about rate of change. But these frameworks also have limits as to explicitly explain how students can develop their knowledge and abilities. In contrast, this is central in the present study, as it is focused on students’ learning about rate of change. From the perspective of the chosen theoretical framework, variation theory (Marton & Booth, 1997, Marton, 2015), learning to use and express rate of change is a matter of discerning certain, critical, aspect of it. At the same time, these aspects articulate the meaning of this ability.
Kaput et al. (1994) suggest homogeneity to be an important idea in relation to rate, but less is known about the ways in which learners can experience homogeneity. Similarly, important connections between procedural proficiencies and explicit conceptual underpinnings in relation to rate as slope have been identified (Cho et al., 2017), but what is necessary for students to discern, in order to make such connections? Johnson (2015a) points to the importance of students’ use of intensive, rather than extensive, quantities to express rate. What then, has been discerned by students who use intensive
14
quantities, but not by students who do not? I would argue that research on what is critical for students to discern to use and express rate could shed light on these issues.
While educationally critical aspects of rate have been reported by Herbert et al. (2012), these have been identified from interviews outside the classroom. In contrast, critical aspects can also be identified from teaching and learning situations. Knowledge gained through studies of how students experience rate of change in more naturalistic lesson settings, or in relation to certain question types, could further refine the picture of students’ learning about rate of change. With a variation theoretical perspective and learning study as research approach this is an ambition of this thesis.
15
3 Aim of the thesis
The overall aim of the study is to contribute with knowledge about students’ learning of rate of change in school mathematics. More specifically, the study is focused on exploration of the meaning of the ability to use and express the rate of change as a description of how one quantity changes in relation to another. The meaning here refers to the aspects that are necessary, or critical, for a learner to discern in order to develop this ability. The overarching research questions is:
What is critical to discern to use and express rate as a measure of the relation of changes in two quantities?
The three appended papers each contribute with a different perspective of the overall aim. Through an interventional inquiry involving teacher-researcher collaboration Paper I describes how specific aspects of calculating rate were identified as critical to discern. Paper II concerns how students may relate two quantities in different ways depending on the type of question they are facing. Paper III explores how different perspectives of slope may support students to discern homogeneity in rate.
16
4 Theoretical and methodological
frameworks
The aim of this research concerns exploring the meaning of the ability to use and express rate of change. But this meaning is complex, and rate can be experienced in many different ways. Exploring nuances in the ways in which students use and express rate, could contribute to uncover this complexity. In this thesis, variation theory (Marton & Booth, 1997; Marton, 2015) has been chosen as the theoretical framework because it allows particular differences in students’ ways to experience a phenomenon to be articulated. In terms of critical aspects, it offers tools to describe the difference between one way to experience rate of change, and other. At the same time, these aspects constitute the meaning of the ability to use and express rate. Variation theory therefore conforms with the aim of this research.
4.1 Variation theory of learning
With roots in phenomenography (Marton, 1981, 1988), variation theory of learning acknowledges the ‘natural attitude’. Two individuals often ‘see’ different things, although they are looking at the same phenomenon. But individuals also tacitly assume that others see the phenomenon in the same way as themselves (Marton & Booth, 1997). Similarly, “Most teachers tend to assume that if they explain the content to their students clearly, then the students will see the content in exactly the same way as the teachers” (Lo, 2012, p. 20). In contrast, what is natural, is that students, as well as their teachers, have different ways of seeing the content (Lo, 2012). The ‘way of seeing’ something refers to experiencing a phenomenon in a specific way; to discern certain aspects of it simultaneously. When a person experiences a phenomenon in a specific way, it is reflected by a simultaneous discernment of certain structural aspects of the phenomenon. Learning then is a matter of change in the qualitatively way a phenomenon is experienced. (Marton & Booth, 1997). Thus, learning in the sense to experience a phenomenon in new ways, is a matter of discerning new aspects of it. Accordingly, students learning difficulties in relation to a specific content can be explained and specified in terms of aspects that they yet have to discern. The difference
17
between learning and not learning is thereby explained as discerning, or not discerning, certain aspects of that which is to be learned.
4.1.1 Object of learning and critical aspects
In variation theory, learning is intimately connected to that which is learned.
Learning is always the learning of something: there cannot be any learning without something being learned. Focusing on what is learned implies focusing on the content of learning.
(Marton, 2015, p. 22)
What is to be learned, the object of learning, is central in variation theory. However, objects of learning must not be mistaken for learning objectives, which in general are stated in curricula. While learning objectives answers to what students should be capable of at the end of a course, an object of learning describes what the student need to learn in order to achieve a desired learning objective (Lo, 2012). It can be expressed in terms of the aspects necessary, or
critical, for a learner to discern in order acquire certain ability in relation to a
specific content.
Although in-depth analysis of relevant subject theory certainly is relevant, it is not sufficient, and critical aspects must not be considered from the perspectives of curriculum or subject theory only (Pang & Ki, 2016; Runesson, 2017). To interpret critical aspects as being theoretically essential features of a mathematical concept, or as ‘what students tend to forget’, would define them as fixed and easily derived from theory, independent of how they are experienced by learners. Pang et al. (2016) argues that
For example, horizontal distance and vertical distance are considered to be critical aspects for the mathematical concept of slope because students have been found to frequently forget or become confused about what horizontal or vertical distance refers to. We argue that these interpretations are problematic, as critical aspects should be defined in relation to the phenomenon in question as experienced by learners rather than in relation to what is deemed critical in the curriculum or subject discipline.
18
Critical aspects go beyond what is ‘hard to understand’ since they specify what is necessary to discern in order to experience a phenomenon in a certain way. They originate neither from subject content, nor from the individual, but from the relation between the subject knowledge and the learner (Pang et al., 2016).
4.1.2 Identifying critical aspects
This research is focused on exploring aspects that are critical to learn to use and express rate of change. Through the lens of variation theory, a way of seeing a phenomenon is constituted by certain aspects.
A particular way of experiencing something reflects a simultaneous awareness of particular aspects of the phenomenon. Another way of experiencing it reflects a simultaneous awareness of other aspects or more aspects or fewer aspects of the same phenomenon.
(Marton & Booth, 1997).
Similarly, critical aspects allows logical relations between different ways of seeing a phenomenon to be made explicit (Marton, 2015). Examination of different ways in which an object of learning is experienced by learners may therefore reveal critical aspects. Although subject theory can be used to find candidates for critical aspects, they must be established from a variation of students’ learning, either between individuals or in relation to what has been taught (Marton & Runesson, 2015). Considering that learning is seen as a change in an individuals’ ‘way of seeing’, it is hard to argue that one can actually observe this learning. But it is reasonable to assume that there is a relationship between what a person sees and how she acts. Under this condition, one can ‘read’ a person’s actions in terms of how things must appear to her (Marton, 2015). For example, in a task that requires a the use of rate, the way in which a student acts is related to what she sees (i.e. the aspects of rate she has discerned and takes into consideration when solving the task). Another student may act differently, and hence has discerned other aspects of rate. Consequently, to identify aspects critical for a learning a specific ability, one can study learners’ different approaches to tasks in which this ability is central. Similarly, differences in what aspects a student take into consideration prior to and after teaching, could reveal aspects that are critical in relation to what the object of learning. In this study, critical aspects have been identified by examining differences between students’ ways to act on tasks about rate,
19
and differences in students’ learning in relation to what has been taught in lessons.
“There is no learning without discernment. And there is no discernment without variation” (Marton & Trigwell, 2000, p. 381). From a variation theory perspective, learning involves the discernment of critical aspects. But in order to discern an aspect, one must separate it from the whole. One must experience a difference, a contrast, which in turn implies variation. For example, one cannot discern slope as an aspect of a graph if the slopes of all graphs one has ever experienced are equal. It would be impossible to separate the slope from the graph itself, and hence to discern it as an aspect of the graph. To discern this aspect, the learner needs to be aware of at least two different slopes, and so slope must vary. When the variation of an aspect is enacted, the aspect is said to be opened as a dimension of variation. Consequently, opening a critical dimension of variation allows the corresponding critical aspect to be discerned (Marton, 2015).
To assess what has been made possible to learn in a lesson, aspects opened as dimensions of variation needs to be identified. Seeing the lesson through the lens of the object of learning allows for an analysis on micro-level and in terms of meanings of the content. During a lesson, a teacher can intentionally focus on the variation of certain aspects. Since patterns of variance and invariance are necessary for learning to take place, identifying these patterns in relation to the object of learning is central. But even if an aspect is varied by the teacher, the variation must also be experienced by the learners if they are to discern the aspect (Marton, 2015). Therefore, what is varied and what is invariant through the eyes of the learners is imperative to identify critical aspects. The teacher may also use open-ended tasks to let learners themselves open up dimensions of variation they find necessary. In this way, the group of learners being taught is the most valuable source to find critical aspects, (Marton, 2015).
4.2 Learning study
The data for this study has been generated from a learning study (Pang et al., 2003). With variation theory as theoretical framework, learning study can be used as a teacher-researcher collaborative, iterative and cyclic research
20
arrangement designed to explore critical aspects of a specific object of learning.
4.2.1 Learning study as research approach
In all research, theoretical and methodological decisions must be made with the overarching purpose to align the aim of the research with the knowledge claims made. In educational research, the interpretation of the results naturally depends on the epistemological view adopted. When commonly adopted learning theories shift, so does the meaning of what is to be studied, and the methods needed for research on teaching and learning are in turn affected (Brown, 1992). Learning may be considered a way of seeking meaning in contrast to learning as primarily reproducing (Marton & Booth, 1997). Consequently, the complexity of assessing learning is affected. In relation to reading comprehension, Brown (1992) writes: “…the problem became one of how to capture degrees of understanding, nuances of meaning, acceptable alternative viewpoints, a problem that has kept the field busy for several years” (p. 147). In research guided by variation theory, this problem is directly addressed as learning involves a change in qualitatively different ways of experiencing a particular object of learning.
A theoretical aim of a learning study is to generate knowledge in the form of a refined, theoretical, description of the object of learning; one which better conforms with variation in how it may be experienced by learners. The learners’ actions on the object of learning, their speaking, gesturing, questioning and solving tasks et cetera, can inform researchers about how it is seen through the eyes of the learners. Also, what has been made possible to discern during a lesson is compared to what students have learned (i.e. how their view of the object of learning qualitatively has changed). In this way, the relation between teaching and learning can inform a small, local theory about the meaning of the object of learning, and this can be put to test in another lesson. Stiles (2009) describes abduction as the use of new and particular cases to permeate and test theoretical conjectures. The exploration and refinement of the object of learning is in this sense, a process of abduction.
Another aim of learning study is to improve teaching and learning. In a learning study, the variation in how the object of learning is enacted are related
21
to variation in how it is experienced by the learners (Pang et al., 2003). Results of a learning study may thus also involve descriptions of certain patterns of variation, which has been found to be successful for students’ learning. Knowledge of the critical aspects themselves, and of how they may be enacted in classrooms through patterns of variation, can be used by practitioners in education. Hence, learning study aims to produce insights that may be used both as theoretical descriptions and practical guidelines to improve teaching and learning (Pang et al., 2003; Pang & Lo, 2012; Marton & Runesson, 2015). The practical contribution of learning study is not limited to the use of critical aspects and patterns of variation in classrooms. A salient ingredient in the process is that of teachers deepening their pedagogical content knowledge (Schulman, 1986) with insights derived from evidence-based classroom activity (Pang et al., 2012).
4.2.2 Learning study as research arrangement
Learning study (Pang et al., 2003), was developed from lesson study, a collaborative arrangement used for in-service training of teachers in Japan (Stigler & Hiebert, 1999), and design experiment (Brown, 1992; Cobb, Confrey, diSessa, Lehrer & Schauble, 2003). All three arrangements share the idea that interventional studies can inform educational practice through testing and re-designing of research lessons. There are however also significant differences between the three approaches.
In a learning study, the iterative, cyclic design of lesson study (Stiegler & Hiebert, 1999), in which a group of teachers explore a lesson through collaborative planning and evaluating, is combined with the theoretical emphasis of design experiment. As in design experiments, the two phases of testing conjectures and re-designing a lesson mutually inform each other (Pang et al., 2003). In contrast with design experiments though, learning studies are more focused on the object of learning, rather than on learning ecologies. Another important difference is the connection between learning study and design of teaching as being the main professional task for teachers. Learning study aims to improve educational practice and generate theory-based knowledge. With a focus on the object of learning it also connects to design of teaching and has been suggested a good model for ‘clinical’ research in subject matter didactics (Carlgren, 2012). The explicit focus on the object
22
of learning, and the presence of a theoretical framework, are two characteristics of learning study that distinguishes it from lesson study (Pang et al., 2003).
Although other theoretical perspectives may be adopted, the most common theoretical framework used in learning studies is the variation theory of learning (Marton, 2015). Consequently, certain epistemological points of departure are inherited into learning study. For example, learning is seen as learning something. Hence the centrality of the object of learning. Also, initial conjectures about the object of learning are made in the form of hypothetical critical aspects. These conjectures are then explored in detail trough an iterative process, constituted by cycles with both prospective (planning) and reflective (analysing) phases. The steps which constitute a learning study are shown in Figure 2.
23
First, a specific learning goal (the intended object of learning) for the research lesson is chosen. It should be considered worthwhile for the students to learn (Pang & Lo, 2012), and the learning study aims to identify its critical aspects. Relying on the phenomenographic idea of individuals experiencing the same phenomenon differently, learners’ perspectives on the object of learning must be taken into account. A pre-test is therefore used to inform the teacher group about the ways in which the students already have developed the ability that is embedded in the object of learning. The pre-test is analysed to find students’ learning difficulties in relation to the object of learning. By focusing on the students’ different ways to solve the pre-test tasks, tentative1 critical aspects
can be suggested and incorporated in the first lesson. Guided by variation theory, the first lesson is planned with the aim to open the tentative critical aspects as dimensions of variation. The lesson is taught to a group of students and documented on video, and the students are given a post-test a few days after the lesson. Video data are analysed to identify how the object of learning was made possible to experience during the lesson, and differences between students’ responses to the pre- and post-test are analysed to draw conclusions about what the students learned. From this analysis, the lesson is revised, again using variation theory to create possibilities for the learners to discern certain critical aspects. A second version of the lesson is then given to a new group of students. Again, video data from the lesson, and the students’ responses to the post-test are analysed. Typically, a learning study consists of three or more of these cycles. Critical aspects may through this process be corroborated, revised or abandoned altogether, but new critical aspects may also appear in the analysis of lesson video data or post-tests. Both lesson video data and students’ responses to the tasks in the pre- and post-tests constitute important resources to identify critical aspects, since the learners “reveal critical aspects by what they say and what they do.” (Marton, 2015, p 261).
1 In this thesis, the term ‘tentative critical aspects’ is used to denote aspects which are
24
5 Methods
Three appended papers are framed in this thesis. The papers are associated with the overall aim of the thesis: to explore the meaning of the ability to use and express the rate of change. To meet this aim, a variation theory perspective of learning has been adopted and students’ different ways to experience rate of change have been central throughout the study. The methods used for production and analysis of data have been chosen in accordance with this theoretical point of departure and was framed by learning study as research approach. Hence, pre- and post-tests were administered, and lessons were planned and evaluated iteratively. Furthermore, practical arrangements and ethical considerations were affected by these methods. This chapter describes the design of the conducted learning study and the production and analysis of data in relation to the three appended papers.
5.1 Design of the learning study
The learning study was conducted at a secondary school in a mixed socioeconomic area in a small town in Sweden. It comprised three research lessons and was conducted by a team formed by two teachers and me as a teacher-researcher. The school was chosen for locality reasons and all three members of the learning study team were working as mathematics teachers at the school.
5.1.1 The object of learning, pre- and post-tests
The object of learning, ‘to express the quantitative rate of change of a linear relation2’, was considered worthwhile to the students, prior to calculus courses
2 In the learning study, this phrasing was used with the meaning “to express the rate
of change of a linear relation quantitatively”. Hence, the phrase does not refer to any certain ‘quantitative’ rate of change.
25
in upper secondary school. It was also regarded suitable to study by the teachers, because they considered their current teaching to often involve a simplified view of rate as merely the value of 𝑚𝑚 in the standard formula for linear functions, 𝑦𝑦 = 𝑚𝑚𝑚𝑚 + 𝑏𝑏, or as ‘what the y goes up by, as x increases one unit’ (cf. Lobato, Ellis, & Munoz, 2003).
The learning study team had several meetings prior to the first lesson. During these sessions, experiences from practice and examples from text books, related to the object of learning, were used as input in discussions. For example, it was noticed that in tasks involving a comparison of two different constant rates, the comparison was often about to assess the (visual) slope of two linear graphs. Hence, it was not about comparing changes in two quantities. This drew the project towards different ways to experience rate as the slope of a graph.
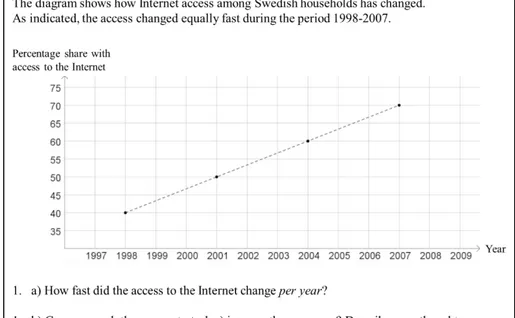
The team constructed paper-pencil pre- and post-tests (see appendices 4 and 5, respectively), each consisting of five tasks. In all tasks, calculating the rate of change of a linear relation was central, and graphs were provided in four of the tasks. However, rate was not represented as 𝑚𝑚, and the formula 𝑦𝑦 = 𝑚𝑚𝑚𝑚 + 𝑏𝑏 was not used in any task, as it possibly could encourage the students to use pre-determined formulas independent of context. Instead, rate was placed in contexts like filling containers with water, stock values and increasing internet access among households. In this way, rate was not viewed in the light of a mathematical function, but rather in relation to real life referents. The tasks in the post-test were very similar to those in the pre-test, although they differed with respect to numbers and contexts. The pre-test was given to all 69 students prior to the first lesson, and student responses were analysed to inform the group of tentative critical aspects. The students were allowed to use calculators, and to work with the tasks for as long as they wished.
5.1.2 Settings and participants
A total of 69 students, aged 15-16, participated in the pre-test, and 27 of these students also participated in a lesson (nine different students were taught in each of the lessons). The students were from three mixed ability classes and students with all existing grades in the Swedish grading system (F to A) were represented among these 69 students.
26
In addition to inform the learning study team of tentative critical aspects, the pre-test results were also used to select smaller groups of students to participate in the lessons. The reason for limiting the number of students in the lesson was to increase the possibilities to observe the students’ actions and communication closely. Therefore, based on the results on the pre-test, nine students from each of the three classes were offered to participate in one lesson each. These students were selected on a wide-range principle with the purpose to maximise the possibility of variation among the students in each lesson. Nine students from the first class were offered to participate in the first research lesson. Relative to their classmates, three of these students scored low on the pre-test, three of them high, and three of them on average. The same wide-range principle was used to select and offer nine students from the next class to participate in research lesson 2. The selection of nine students from the third class for participating in research lesson 3 was made in the same way. Hence, each of the three research lessons was taught to a separate group of nine students from a separate class.
After each lesson, a post-test was given to all students in the class from which the nine students were chosen. However, only the post-test responses from the nine students who participated in the lesson were analysed by the team, and are thus included in this study. The lesson videos was analysed in junction with the post-tests and the team planned the lessons 2 and 3 on basis of these analyses. Figure 3 shows a schematic view of the conducted learning study, with the number of students participating in each part of the process.
27
Figure 3. Schematic view of the learning study.
5.1.3 Lesson settings
The length of the lessons varied between 73 and 90 minutes, and all three lessons were conducted in the same classroom. The teacher used a ceiling mounted projector to display the lesson material. A large whiteboard was used as projector screen, which allowed the teacher to make notes and markings directly on the graphs displayed by the projector. The students had access to pencils, erasers, paper sheets, rulers and calculators.
During the lessons, the students were grouped together in three groups of three students each. There were two major reasons for this arrangement: to support interaction between students, and to make it possible to collect video data of students’ actions and communication on a detailed level. However, lessons also contained wider discussions, involving all nine students who participated in the lesson. In general, each lesson involved discussions in the student groups to solve tasks about rate introduced by the teacher. The students’ ideas and suggested solutions to the tasks were then brought to a whole-class discussion orchestrated by the teacher. A new task was then introduced for the students to discuss in the smaller groups. Each lesson consisted of several such alternating phases.
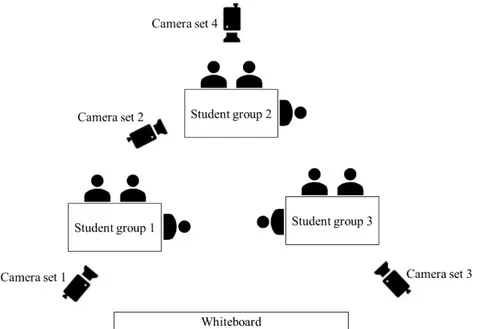
Four camera sets (camera and external microphone) were used in each lesson. Three of these sets were dedicated to capture the work and interaction within each of the three students’ groups. The fourth camera set was positioned in the back of the classroom, with the purpose to capture the teachers’ actions, any
28
examples showed to the students, and notes on the board, see Figure 4. All camera sets were set to record simultaneously, which facilitated synchronization of the video recordings during analysis.
Figure 4. Positions of the students, the whiteboard and camera sets, in the lessons.
5.2 Overview of data and analysis
Carlgren, Eriksson and Runesson (2017), distinguishes between different ways to conduct research through learning studies. Two of these ways are related to how learning study has been used in this work. In part of this study, learning study has been used as the research process, which involves the analysis of data. This way of using the learning study approach may be appropriate to explore and refine critical aspects as they are tested in lessons. While the time to conduct detailed analyses of lessons, pre-test and post-test could be quite limited during an on-going learning study, further analyses may still be made after it is concluded. In this case, learning study acts as a data
generating process (Carlgren, et al., 2017). Hence, results from these analyses